In Kubernetes, the leading container orchestration system, there are three important types of metrics to monitor: resource metrics, cluster state metrics, and control plane metrics.
Resource metrics track the availability of important resources like CPU, memory, and storage. Accessing these metrics is important for ensuring cluster health and the performance of the applications running on K8s.
Cluster state metrics are important for knowing about the health and availability of Kubernetes objects including pods and deployments.
Control plane metrics are exposed by Kubernetes directly and provide metrics for each of the core components in the control plane, including the API server, controller managers, schedulers, and etcd.
In this article, we’ll explore all of the available Kubernetes metrics, with a focus on resource metrics. In addition, we’ll highlight the tools and processes available to engineering teams for tracking these metrics on their own.
Kubernetes resource metrics overview
Fortunately, Kubernetes, an open-source project, has taken a thoughtful approach to resource metrics. Resources like CPU, memory, and storage are critical to ensuring performance and availability. And accessing and monitoring resource metrics is an important early step for most engineering teams.
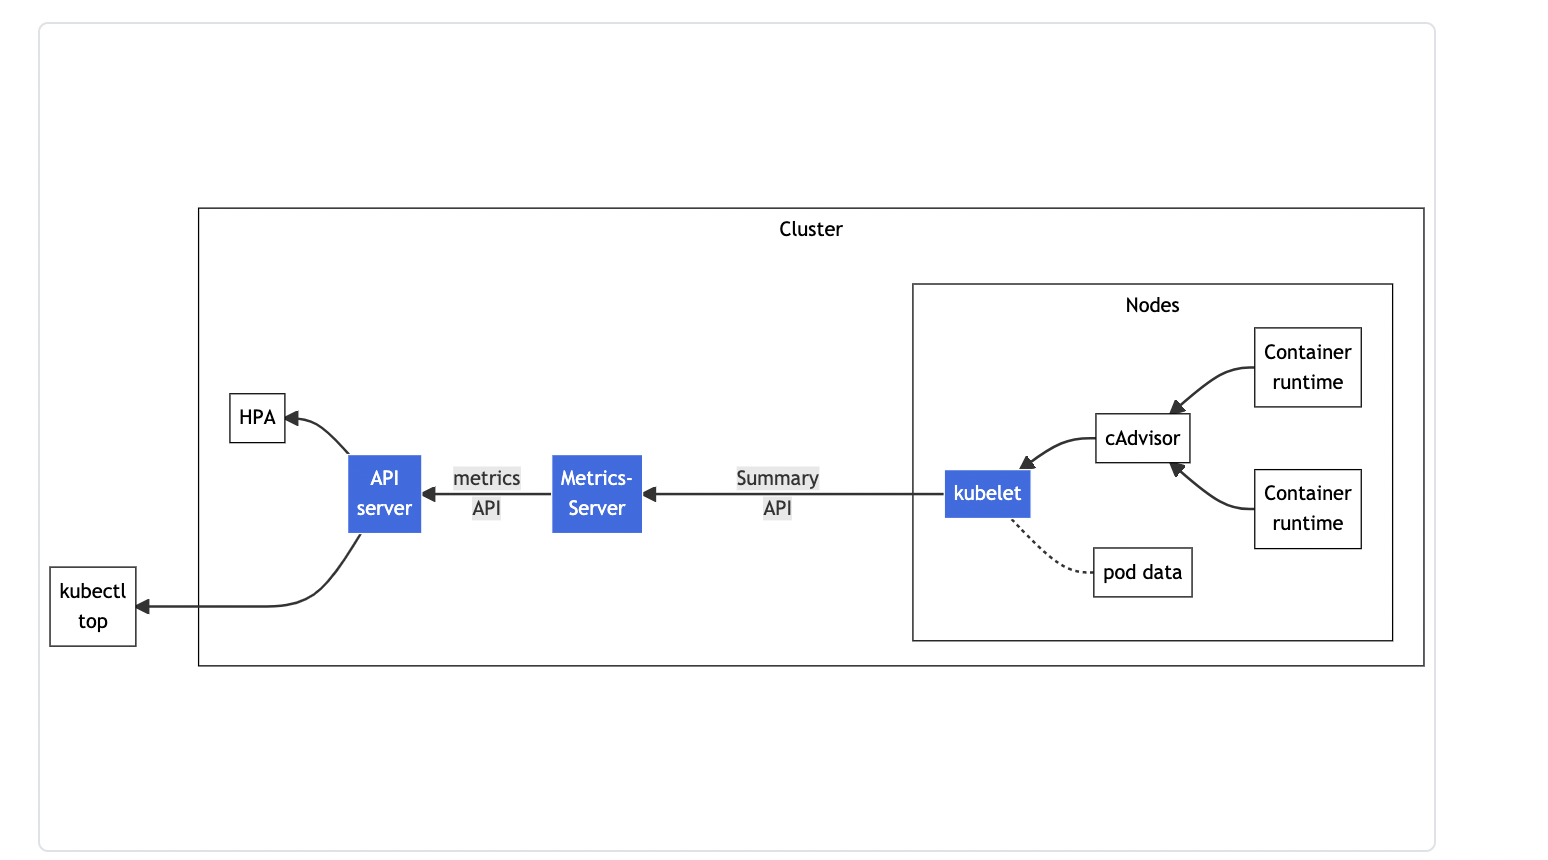
The above diagram shows how the Kubernetes resource metrics pipeline operates.
cAdvisor is a daemon for collecting container metrics exposed in Kubelet. Kubelet and the Summary API make per-node metrics available through the ‘/metrics/resource’ and ‘/stats’ endpoints.
The Metrics Server is an important cluster add-on component that allows you to collect and aggregate resource metrics from Kubelet using the Summary API.
The Metrics API allows you to access the CPU and memory for the nodes and pods in your cluster, and it feeds metrics to the Kubernetes autoscaling components, which are important for most use cases.
Installing the Metrics Servicer is an important step because it allows you to use Kubectl commands, such as kubectl top node, which is discussed later in this post. It also allows you to use a separate monitoring toolset like Prometheus.
Tracking resource metrics and availability is important in ensuring that end users can access your applications. CPU utilization, available vs. used memory, and storage are finite resources, and metrics can be used to determine the load on the servers and whether additional resources must be added to the cluster. These metrics can also indicate when resources are overprovisioned and there could be an opportunity to reduce usage and costs.
Cluster state metrics overview
In Kubernetes, the API server provides valuable metrics for tracking the count and availability of Kubernetes objects. Often described as cluster state metrics, they’re helpful for identifying issues with nodes and pods. Depending on the type of controller that manages these objects — a deployment or a DaemonSet — there are different types of metrics available.
By using Kubectl, or kube-state-metrics, you can retrieve availability and count metrics for all of the objects in your cluster.
Node status is a popular cluster state metric. For example, in Kubernetes, node conditions might include Ready, MemoryPressure, DiskPressure, and more. In kube-state-metrics, the following metric name returns the status of the node:
It’s also important to track pod availability and the number of unavailable pods. In kube-state-metrics, the following metrics show the number of available pods:
or if you’re using a DaemonSet:
And these metrics show the number of unavailable pods:
Control plane metrics overview
As mentioned previously, Kubernetes provides metrics for the core control plane components, including the API server, controller managers, schedulers, and etcd. These control plane components are critical for ensuring cluster management, so tracking the availability and performance of these components is essential.
Here are a few control plane metrics that you should consider monitoring:
Etcd_server_has_leader: An etcd cluster should have a leader, and this metric will return a 1. However, if the etcd cluster does not have a leader, this metric will return a 0, which means that the etcd cluster is down and unable to serve queries.Apiserver_request_latencies_count: This metric is important because it tracks the amount of time it’s taking for user-initiated commands to create, delete, or query resources to execute. A spike in latency may mean that commands are executing slowly as a result of the API server being overworked.Scheduler_schedule_attempts_total: This metric is important for monitoring the throughput of the Kubernetes scheduler. It counts the number of attempts made by the scheduler to schedule pods to nodes, and it measures the latency of the ultimate execution of those attempts.
Accessing resource metrics with Kubectl
Kubectl is a powerful command-line tool that allows engineers to perform a large number of actions on a Kubernetes cluster, without needing to make API calls directly.
Fortunately, Kubectl offers important functionality for accessing Kubernetes metrics directly from the command line.
Using Kubectl get
After deploying the Metrics Server, you can use the kubectl get command to retrieve metrics for pods and nodes.
Using the following command, you can retrieve a pod’s resource metrics:
In the example above, you would replace <POD_NAME> with the actual name of the pod. You can find the names of all of your pods by using the kubectl get pods command.
The returning JSON object will include the CPU and memory for the given pod at that specific point in time.
Using Kubectl top
With a properly installed Metrics Server, you can use the kubectl top command to pull metrics for pods, nodes, and even individual containers.
To retrieve the metrics for all of your running nodes, use the kubectl top nodes command. Below is an example of the output from running this command in a test environment:
$ kubectl top node
| NAME | CPU(CORES) | CPU% | MEMORY(BYTES) | MEMORY% |
|---|---|---|---|---|
| gke-test-default-pool-2948c9y9-fk93 | 42m | 2% | 744Mi | 65% |
| gke-test-default-pool-2948c9y9-kd94 | 43m | 2% | 854Mi | 53% |
Similarly, by using kubectl top pods, you can view the CPU and memory metrics for all of the pods running. If you’d like, you can add –namespace-level filtering, and drill down to specific containers by using the –containers flag. We provide examples in this step-by-step guide to using the kubectl top command.
Using Kubectl describe
If you’re interested in knowing more about how resources are allocated within nodes, you can use the kubectl describe node <NODE_Name> command to learn more.
The kubectl describe node command works with or without the Metrics Server. It can be helpful to know which pods are taking up capacity inside a node. The kubectl describe command returns the total amount of resources, expressed as a percentage, used by each pod.
Our tutorial on using Kubectl describe provides additional examples and context.
Accessing the Kubernetes dashboard
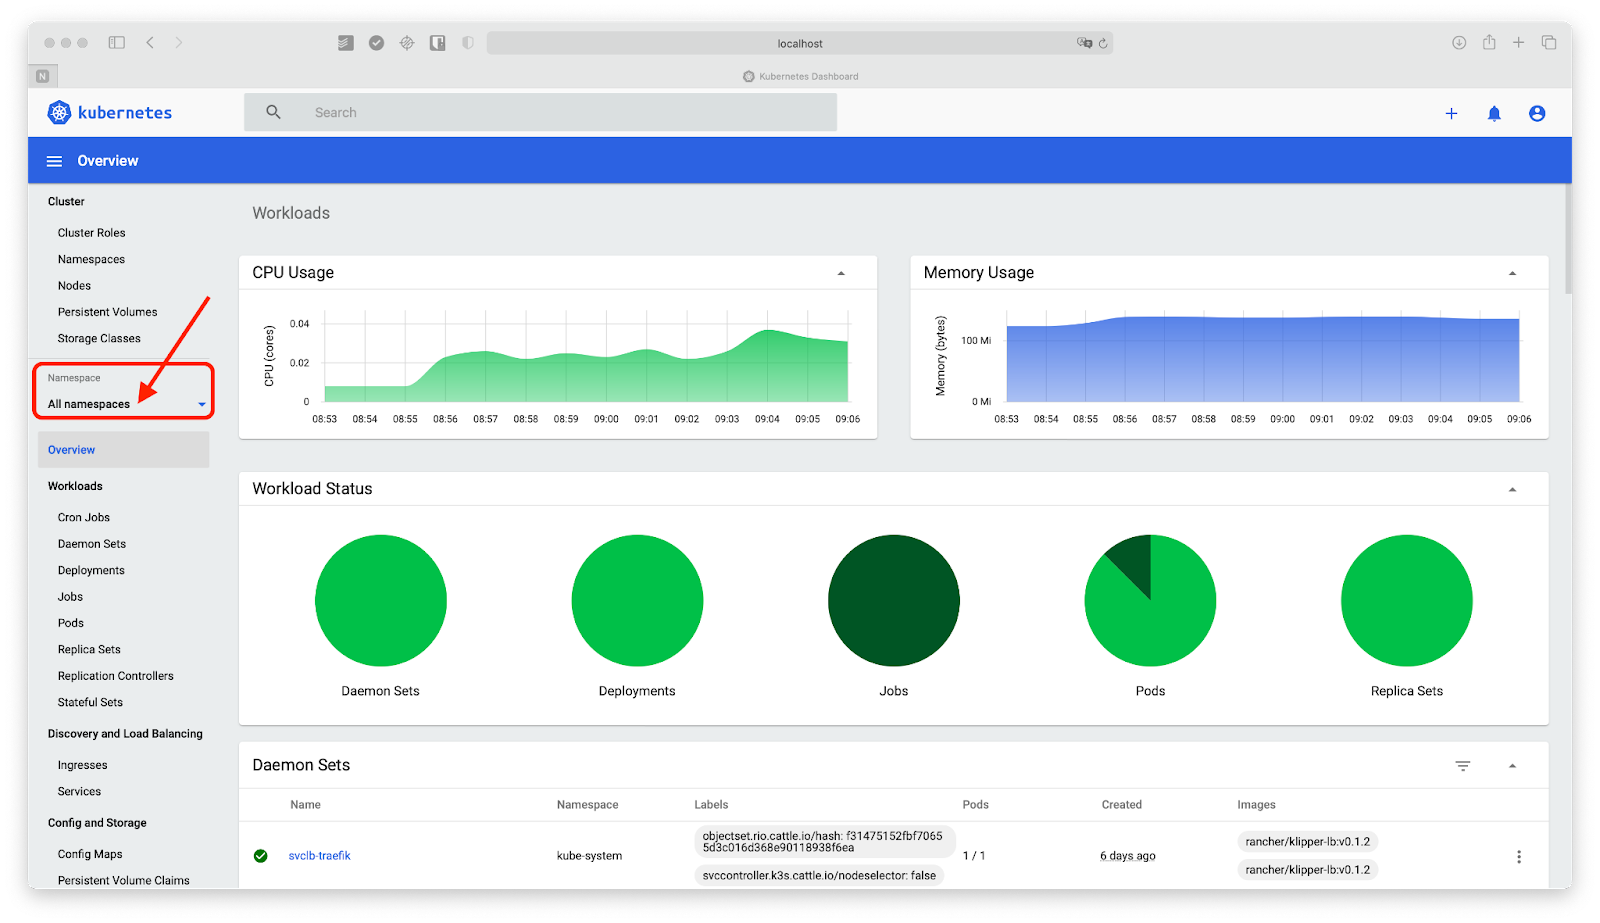
The Kubernetes Dashboard is a web-based tool for viewing Kubernetes metrics, monitoring, and for accessing your cluster. The Kubernetes dashboard can be thought of as an extension to Kubectl, in that you can accomplish the same core actions with the dashboard as you would with Kubectl on the command line directly. However, the Kubernetes Dashboard offers added functionality, like historical views.
For example, using the Kubernetes dashboard, you can access node and pod metrics, similar to how you’d do that using Kubectl top. You can view point-in-time metrics for all of your resources in addition to metadata. You can also view and visualize recent metrics — up to 15 minutes by default — metrics for all of your nodes, pods, and namespaces. This additional context can be helpful when you’re debugging and getting a sense of how metrics may have recently changed.
Installing the Kubernetes dashboard is relatively easy, and we provide a step-by-step walkthrough in this guide.
Prometheus
Prometheus is a popular and thoughtfully built toolset for metrics and monitoring. This open-source time-series database is used by companies large and small and is very popular in the Kubernetes ecosystem.
Prometheus allows teams to efficiently collect and store metrics using a highly dimensional data model. Prometheus is well known for its PromQL query language and for Alertmanager, which can be used to configure alerts. Users are able to send alerts from Alertmanager to a large number of services, including PagerDuty and Opsgenie.
While Prometheus does offer a basic UI, it’s most often used in combination with another tool for visualization, such as Grafana.
Prometheus offers a large number of integrations and client libraries.
Prometheus can be self-hosted, or it can be used as a managed offering through many cloud providers, like AWS, GCP, and other third parties.
Final thoughts
Kubernetes metrics play an important role in ensuring cluster health and performance applications. In this article, we introduced the three fundamental types of Kubernetes metrics: resource metrics, cluster-level metrics, and control plane metrics. Depending on your use cases, and the applications running on K8s, you may want to prioritize certain metrics in your monitoring and alerting. Resource metrics in particular are important because they showcase the availability of core resources, like CPU and memory, which are needed to run your workloads.
Identifying the metrics that matter is an important first step. And once you’ve identified the metrics that most matter in your environment, it’s strategically important to put in place a toolset that allows your team to monitor, track, and alert on changes in these metrics.
If you're looking to build a dashboard to track metrics and get notifications in real-time, consider using Airplane. Airplane is the developer platform for building internal tools. With Airplane Views, you can build a custom React-based UI using pre-built components and templates that make tracking your metrics easy to do.
Sign up for a free account or book a demo to build a metrics dashboard quickly using Views.