


Prometheus is an open-source monitoring and alerting software that can collect metrics from different infrastructure and applications. It saves these metrics as time-series data, which is used to create visualizations and alerts for IT teams. Prometheus has gained a lot of market traction over the years, and when combined with other open-source tools like Grafana, it provides a robust monitoring solution.
You can query Prometheus metrics directly with its own query language: PromQL. In this article, you will learn some useful PromQL queries to monitor the performance of Kubernetes-based systems.
But before that, let’s talk about the main components of Prometheus.
Prometheus components and PromQL
The main components of Prometheus are:
- The Prometheus server: The main application server that collects and stores metrics and sends alerts.
- Push gateway: This is used to send metrics from short-lived jobs to Prometheus.
- Exporters: These are like “agents" that expose metrics from a wide variety of applications, infrastructure, APIs, databases, and other sources. The Prometheus server scrapes their endpoints and saves the data as metrics.
- Alertmanager: The Alertmanager interfaces between the Prometheus server and receiving endpoints like email and PagerDuty. The alert manager also takes care of duplicating, grouping, routing, and silencing alerts.
Other Prometheus components include a data model that stores the metrics, client libraries for instrumenting code, and PromQL for querying the metrics. PromQL allows you to write queries and fetch information from the metric data collected by Prometheus. You can use these queries in the expression browser, Prometheus HTTP API, or visualization tools like Grafana.
Structure of a PromQL query
The simplest construct of a PromQL query is an instant vector selector. This selector is just a metric name. PromQL queries the time series data and returns all elements that match the metric name, along with their values for a particular point in time (when the query runs). Here are two examples of instant vectors:
node_cpu_seconds_total: This returns the total amount of CPU time.instance_memory_usage_bytes: This shows the current memory used.
You can also use range vectors to select a particular time range. For example, the following query will show the total amount of CPU time spent over the last two minutes:
And the query below will show the total number of HTTP requests received in the last five minutes:
There are different ways to filter, combine, and manipulate Prometheus data using operators and further processing using built-in functions. Of course, this article is not a primer on PromQL; you can browse through the PromQL documentation for more in-depth knowledge.
Setting up a Kubernetes cluster
Let’s create a demo Kubernetes cluster and set up Prometheus to monitor it. In the following steps, you will create a two-node Kubernetes cluster (one master and one worker) in AWS. I’ve deliberately kept the setup simple and accessible from any address for demonstration.
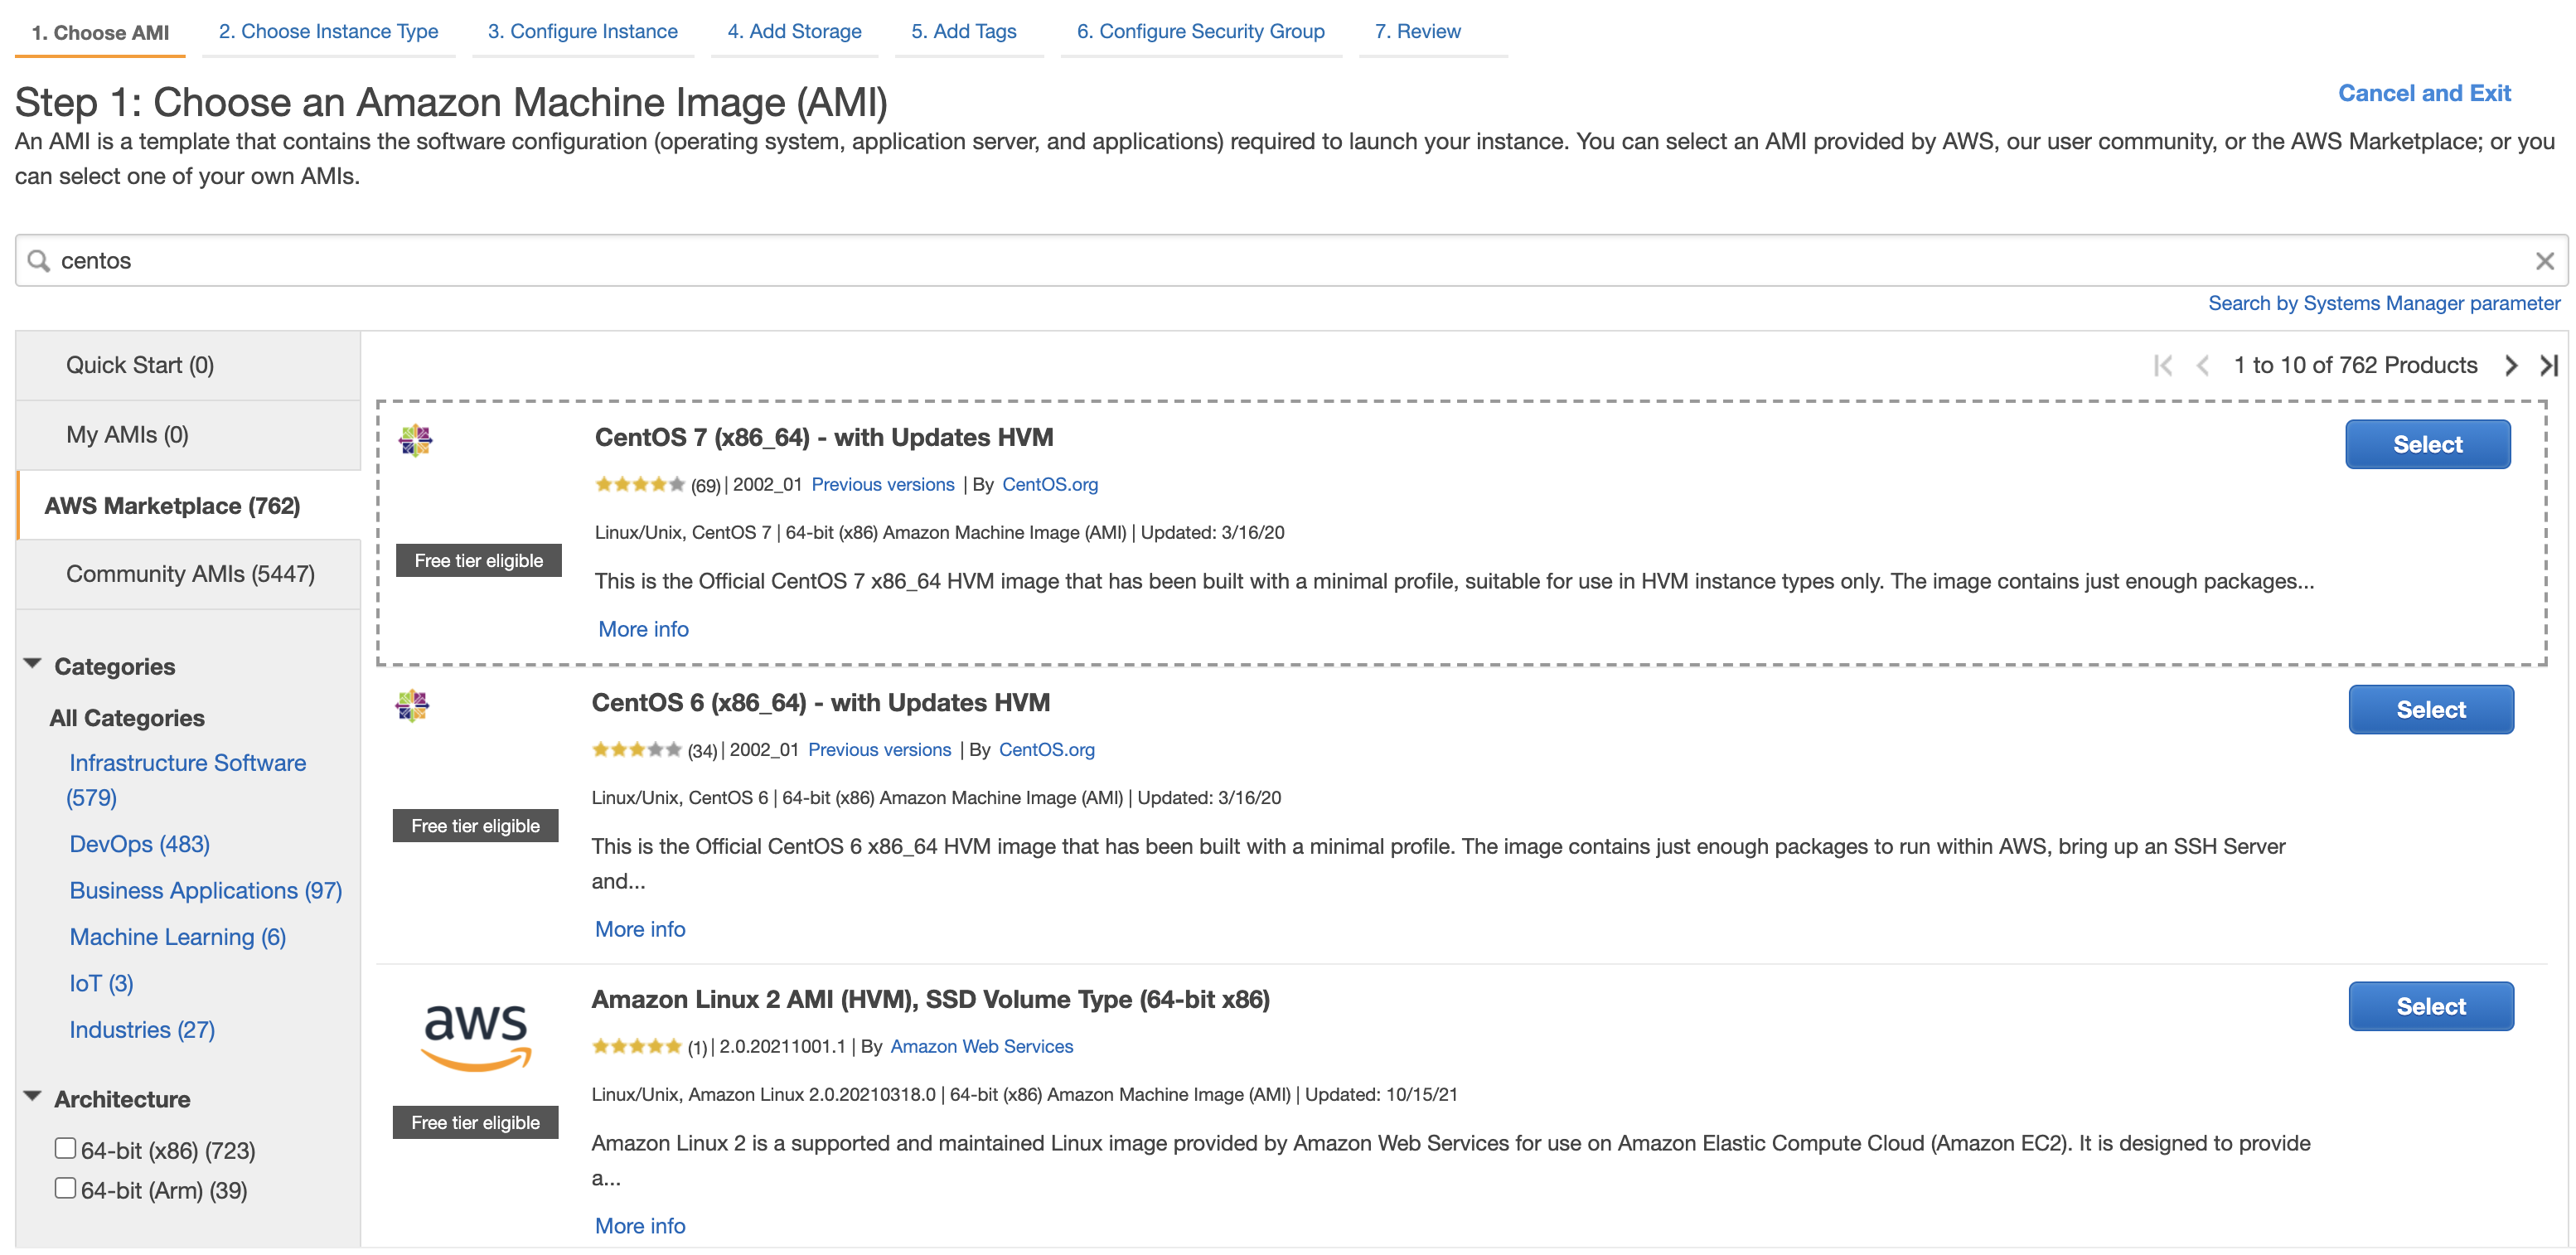
Step 1: Launch EC2 instances
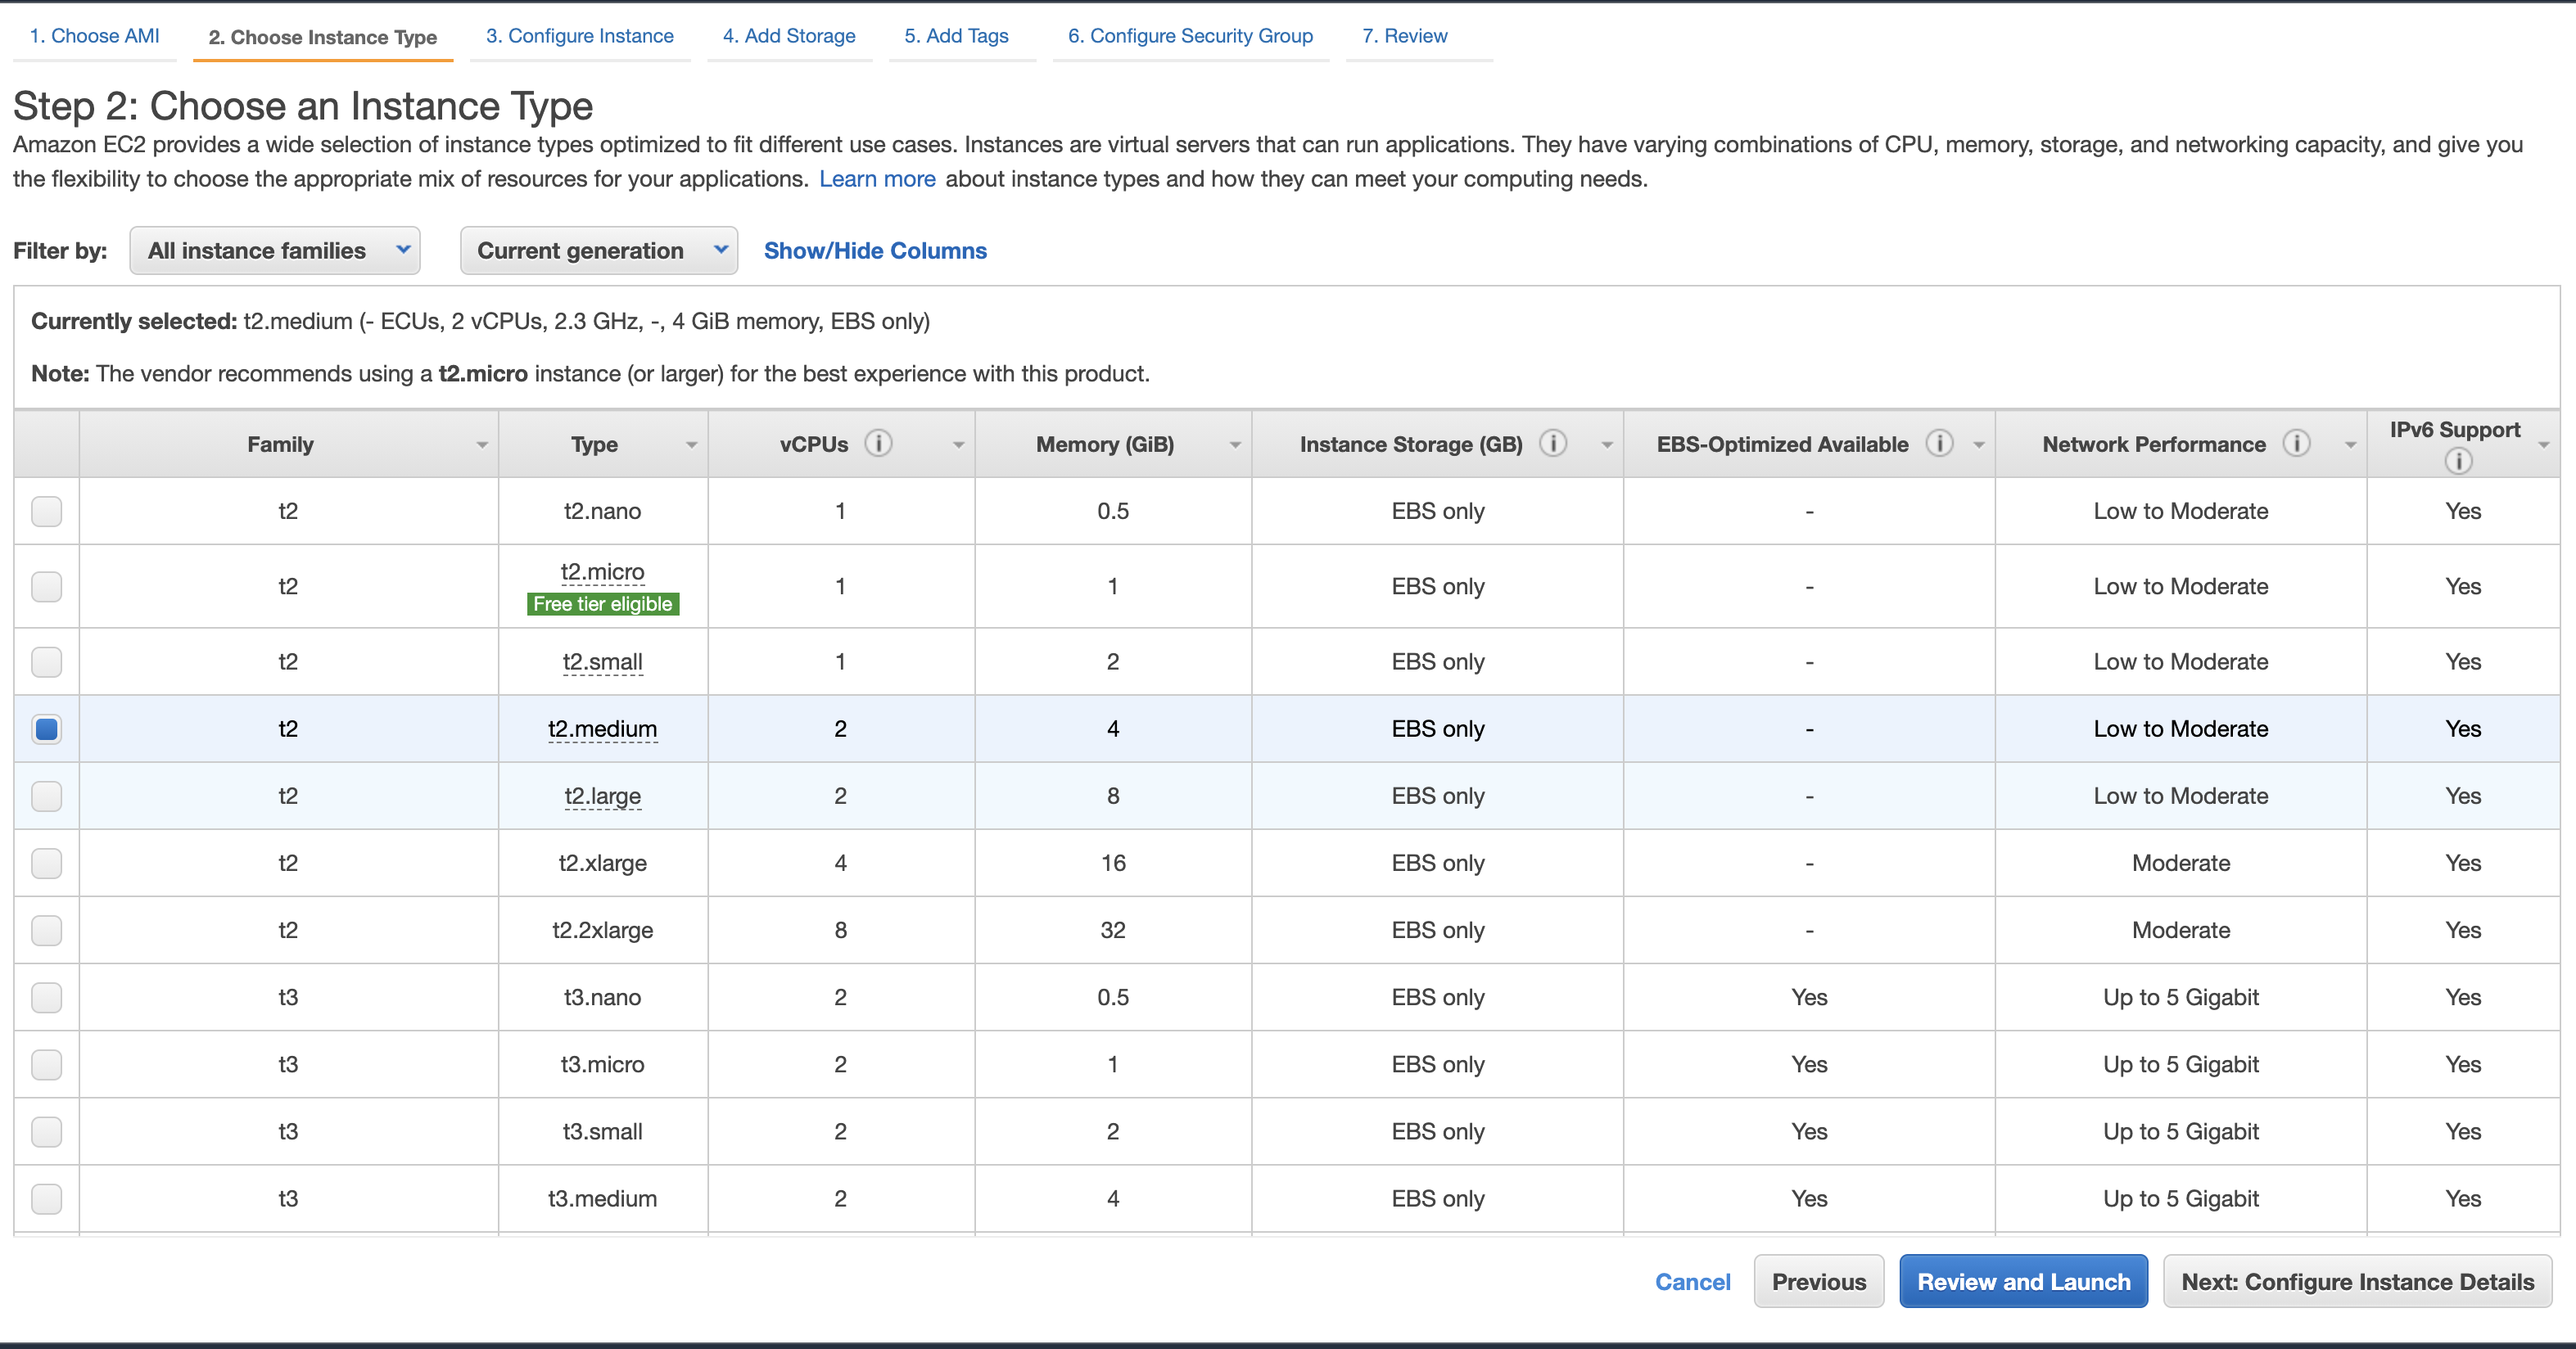
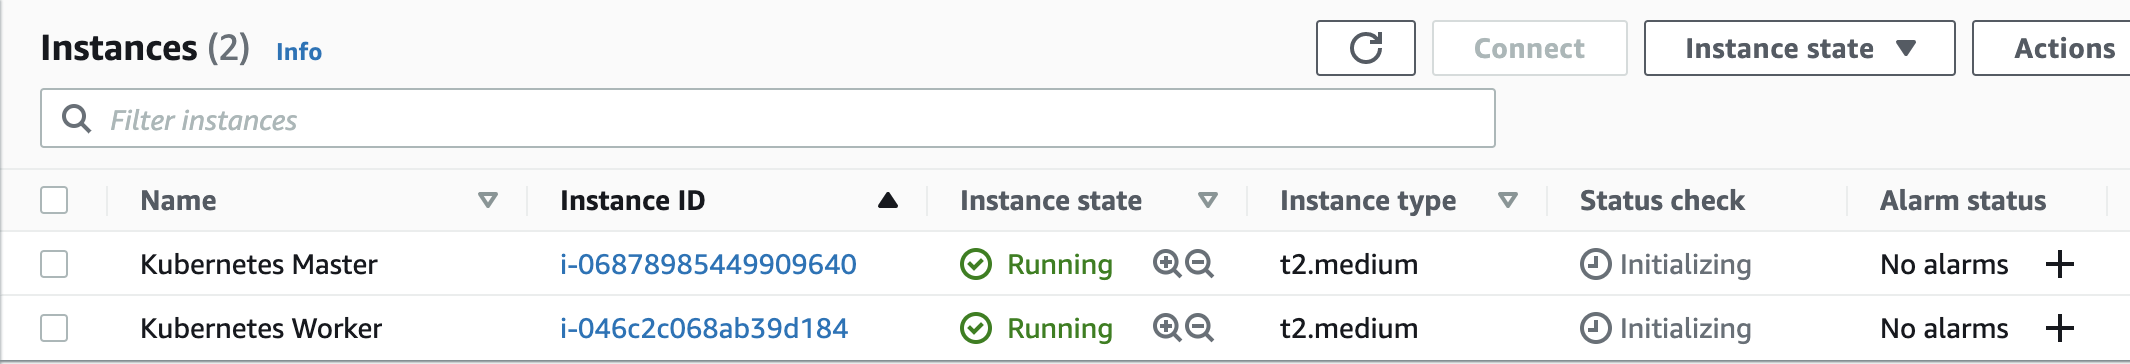
In AWS, create two t2.medium instances running CentOS. Name the nodes as Kubernetes Master and Kubernetes Worker.
Step 2: Create a security group
Next, create a Security Group to allow access to the instances.
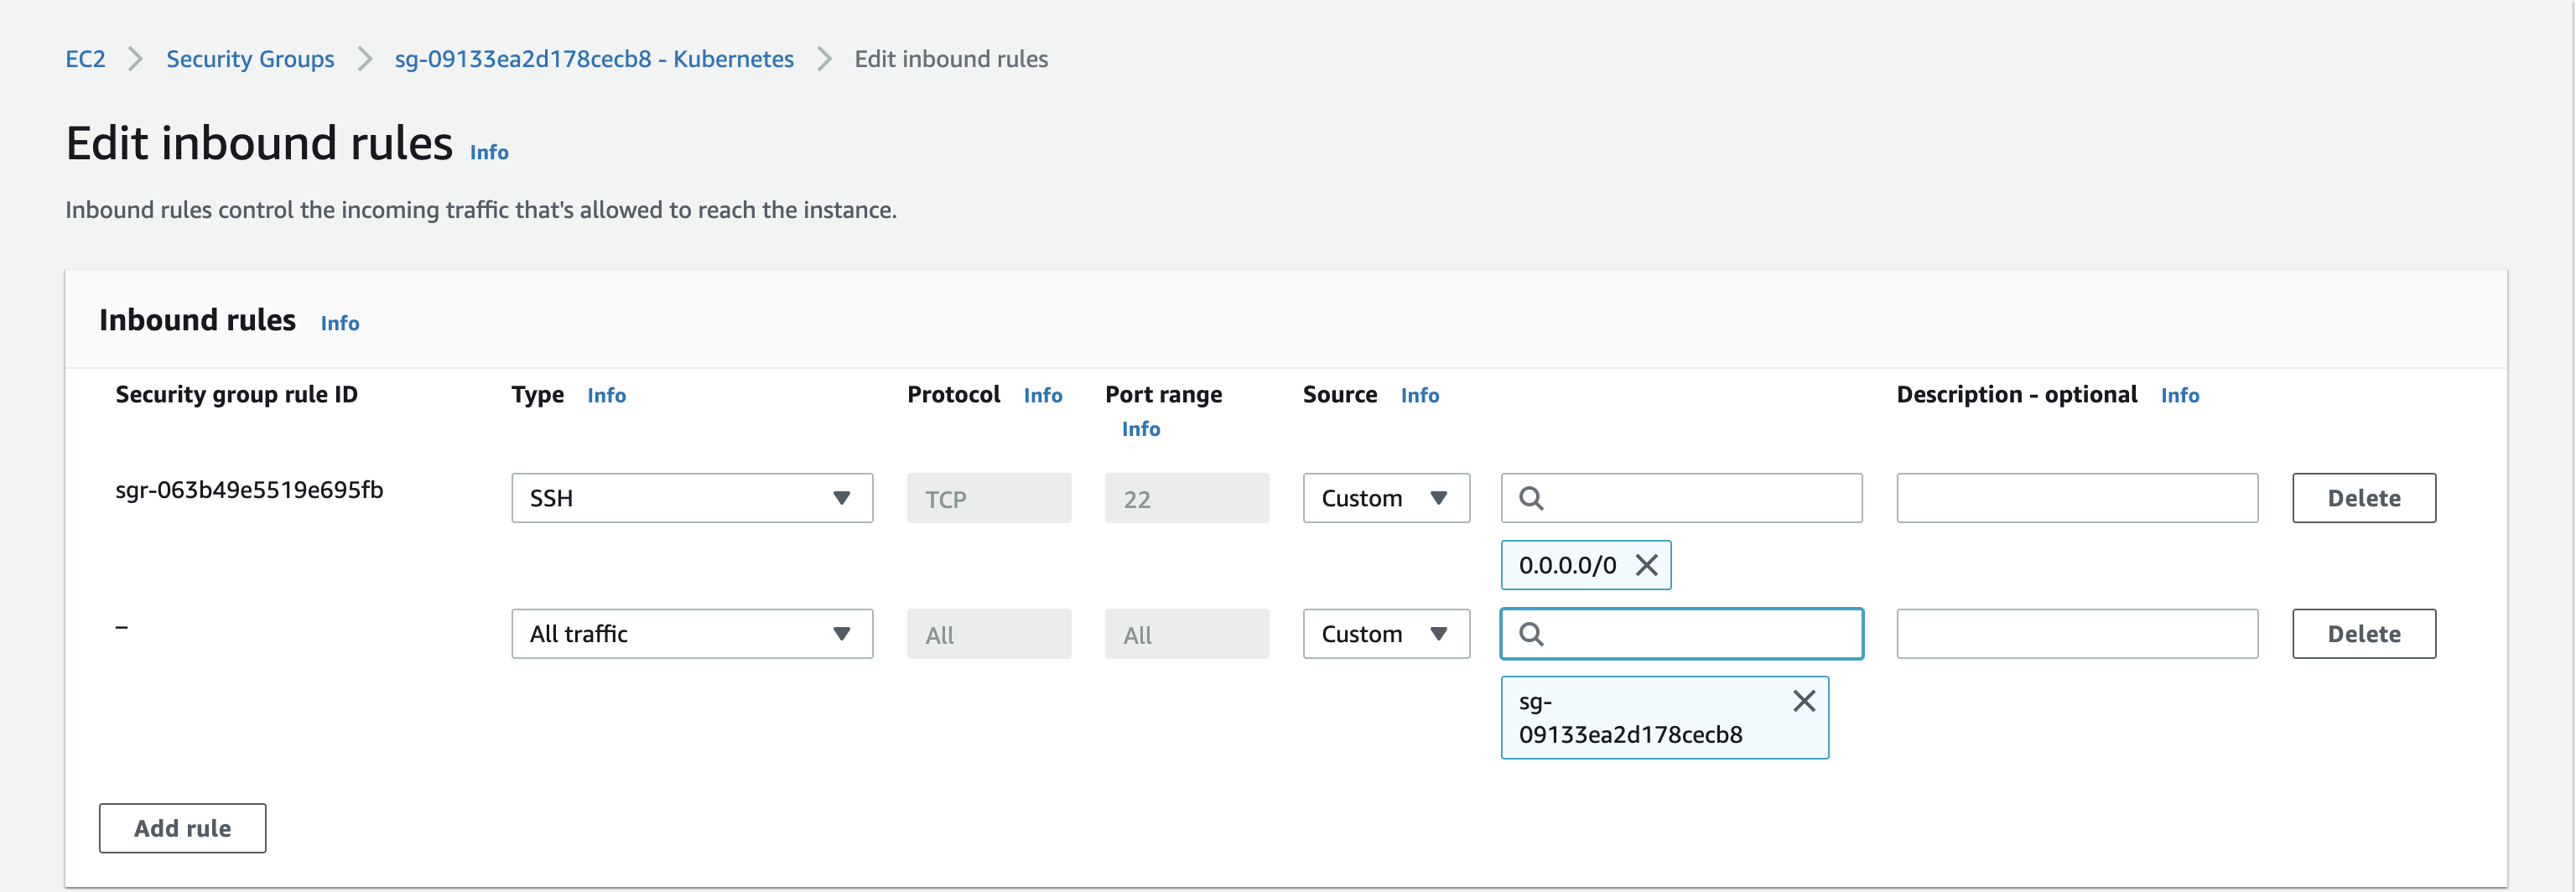
Once configured, your instances should be ready for access.
Step 3: Install Docker
SSH into both servers and run the following commands to install Docker
Step 4: Configure the Kubernetes repository
Run the following commands in both nodes to configure the Kubernetes repository.
Step 5: Install kubelet, kubeadm and kubectl
Run the following commands in both nodes to install kubelet, kubeadm, and kubectl.
Step 6: Set hostnames
Set the hostname in both nodes.
Step 7: Configure the hosts files
In both nodes, edit the /etc/hosts file to add the private IP of the nodes.
Step 8: Update IPTables
In both nodes, edit the /etc/sysctl.d/k8s.conf file to add the following two lines:
Then reload the IPTables config using the sudo sysctl --system command.
Step 9: Disable SELinux and swapping
Run the following commands in both nodes to disable SELinux and swapping:
Also, change <terminal inlne>SELINUX=enforcing<terminal inlne> to <terminal inlne>SELINUX=permissive<terminal inlne> in the <terminal inlne>/etc/selinux/config<terminal inlne> file.
Step 10: Install Kubernetes
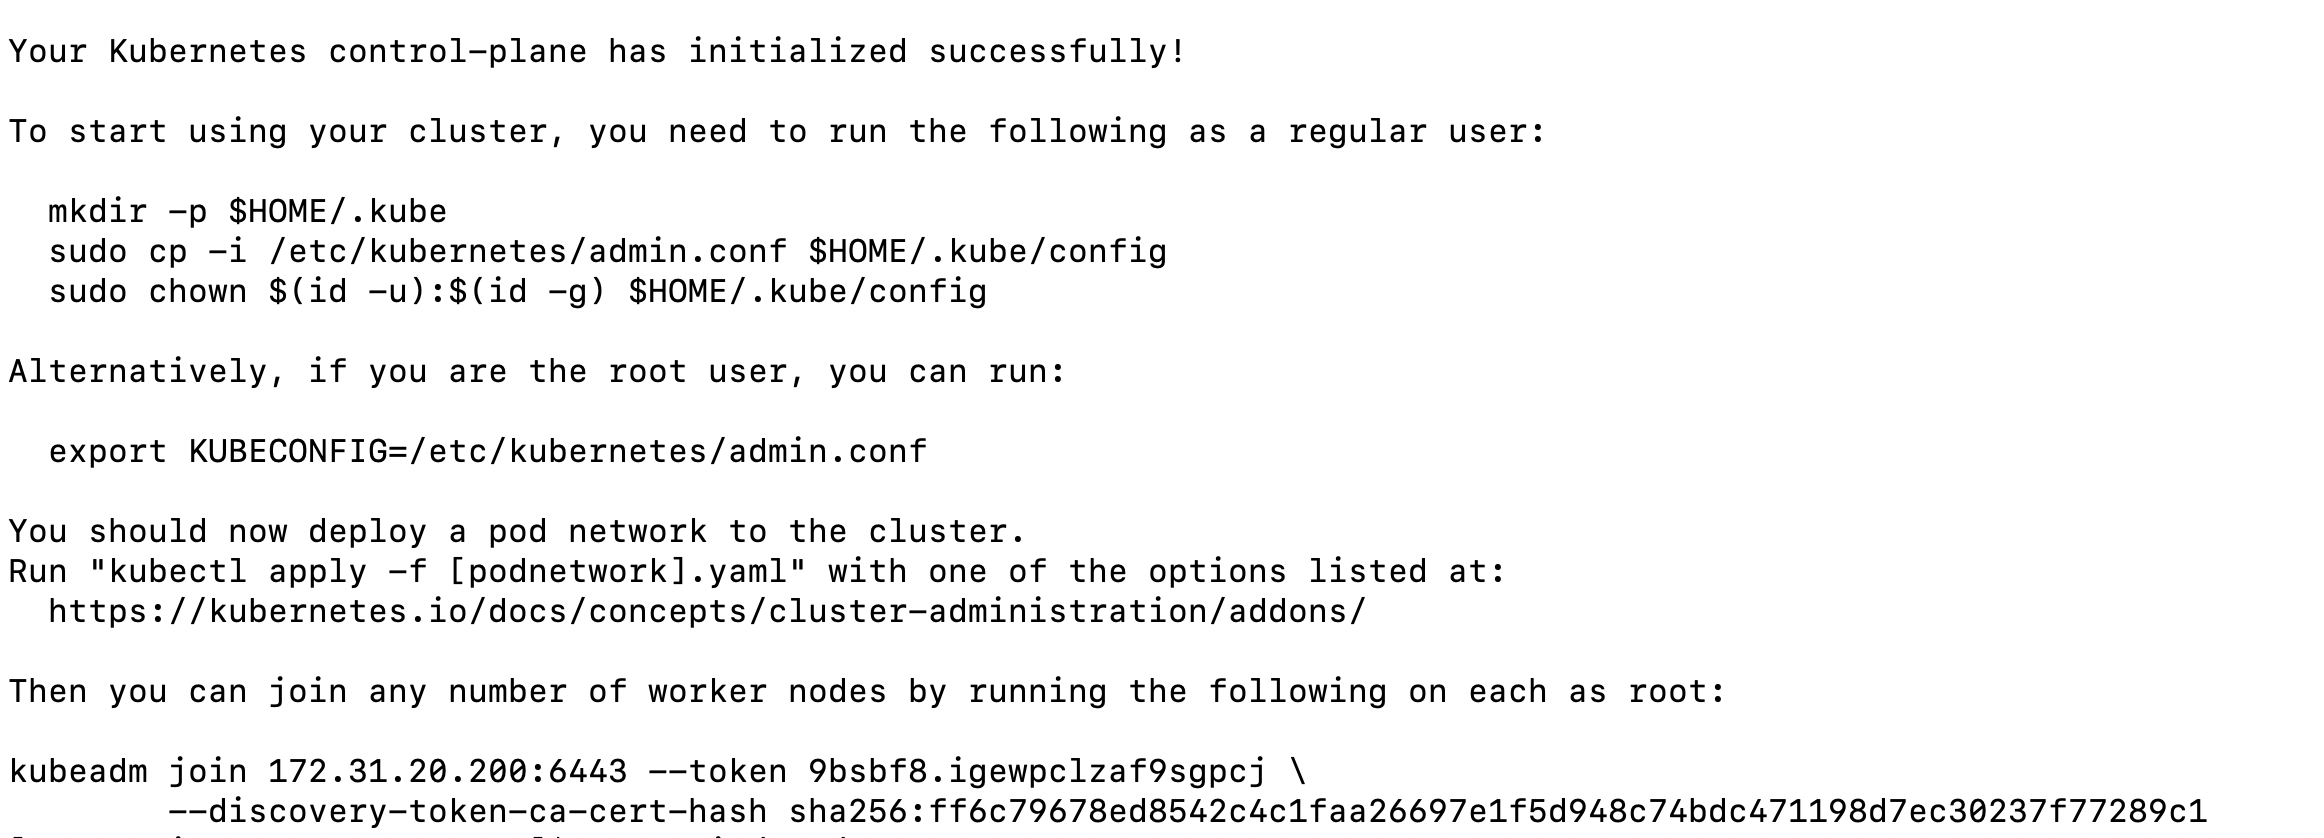
Now, let’s install Kubernetes on the master node using kubeadm. Run the following command on the master node:
Once the command runs successfully, you’ll see joining instructions to add the worker node to the cluster.
Step 11: Copy kubeconfig
Run the following commands on the master node, only copy the kubeconfig and set up Flannel CNI. We’ll be executing kubectl commands on the master node only.
Step 12: Configure the worker node
On the worker node, run the kubeadm joining command shown in the last step.
Note that for your use case, the token values will be different.
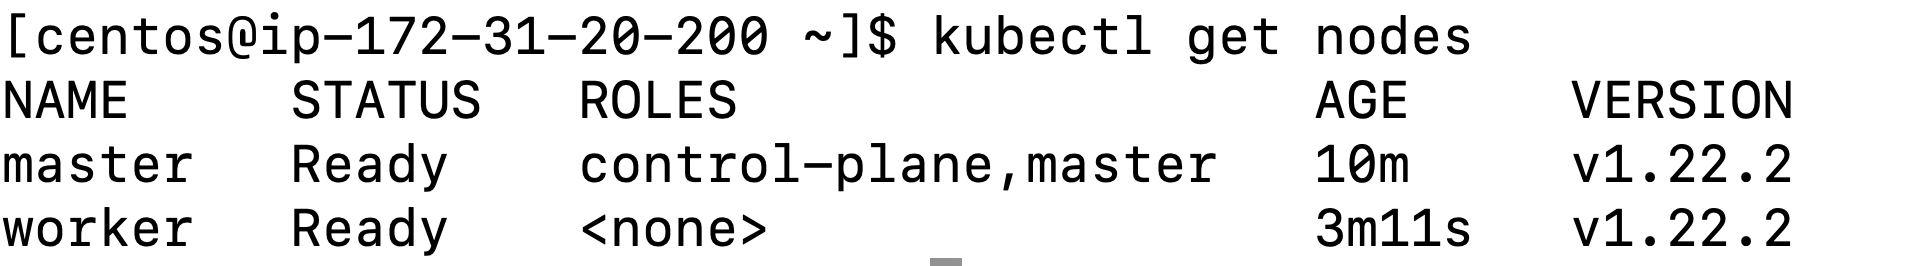
Step13: Check cluster status
At this point, both nodes should be ready. You can verify this by running the kubectl get nodes command on the master node.
Setting up Prometheus
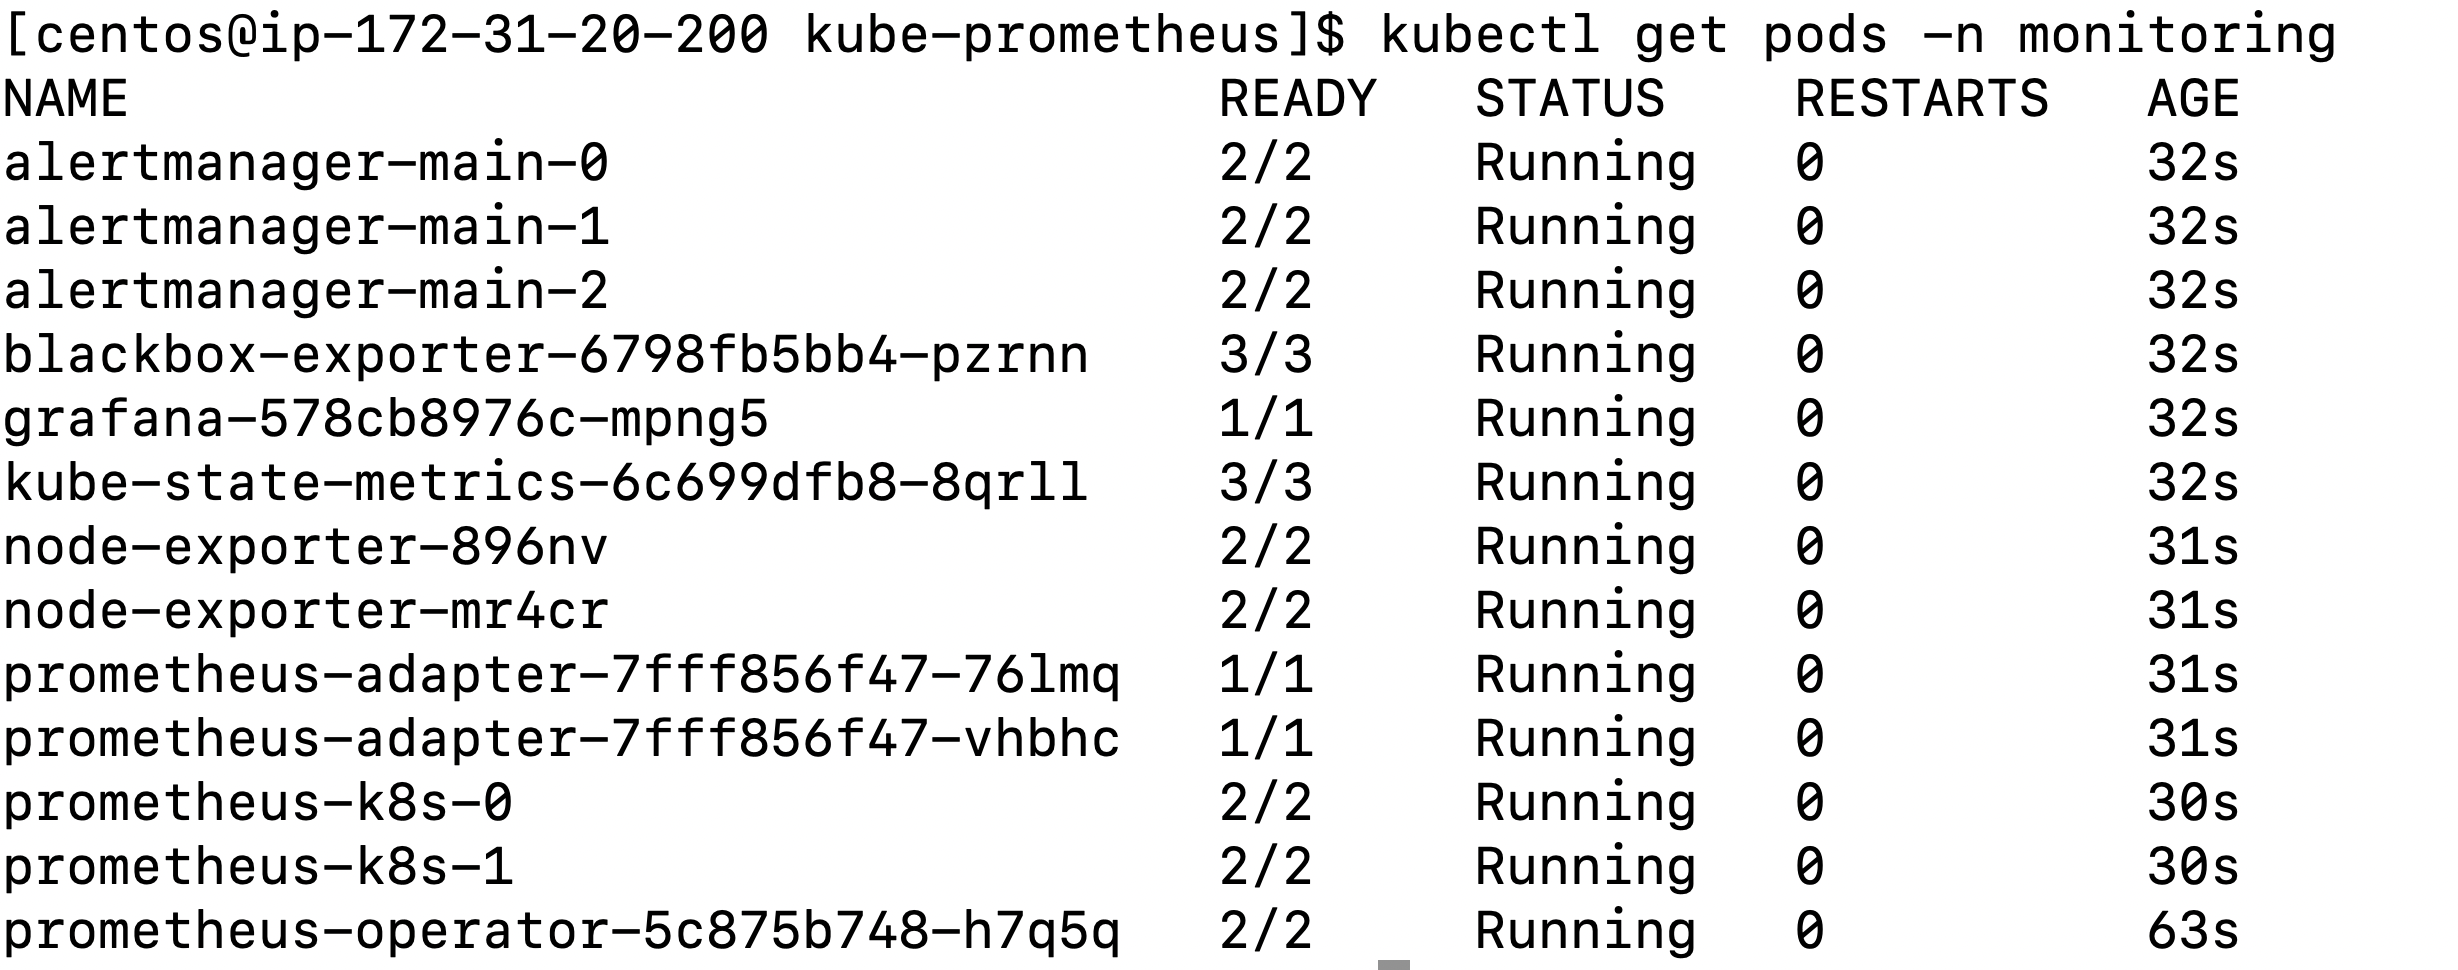
Run the following commands on the master node to set up Prometheus on the Kubernetes cluster:
Next, run this command on the master node to check the Pods’ status:
Once all the Pods are up and running, you can access the Prometheus console using kubernetes port forwarding. To do that, run the following command on the master node:
Next, create an SSH tunnel between your local workstation and the master node by running the following command on your local machine:
If everything is okay at this point, you can access the Prometheus console at http://localhost:9090.
11 queries - Kubernetes metric data with PromQL
Now comes the fun stuff. You can run a variety of PromQL queries to pull interesting and actionable metrics from your Kubernetes cluster. These queries will give you insights into node health, Pod health, cluster resource utilization, etc.
Of course there are many types of queries you can write, and other useful queries are freely available. However, the queries you will see here are a “baseline" audit. These will give you an overall idea about a cluster’s health.
You’ll be executing all these queries in the Prometheus expression browser, so let’s get started.
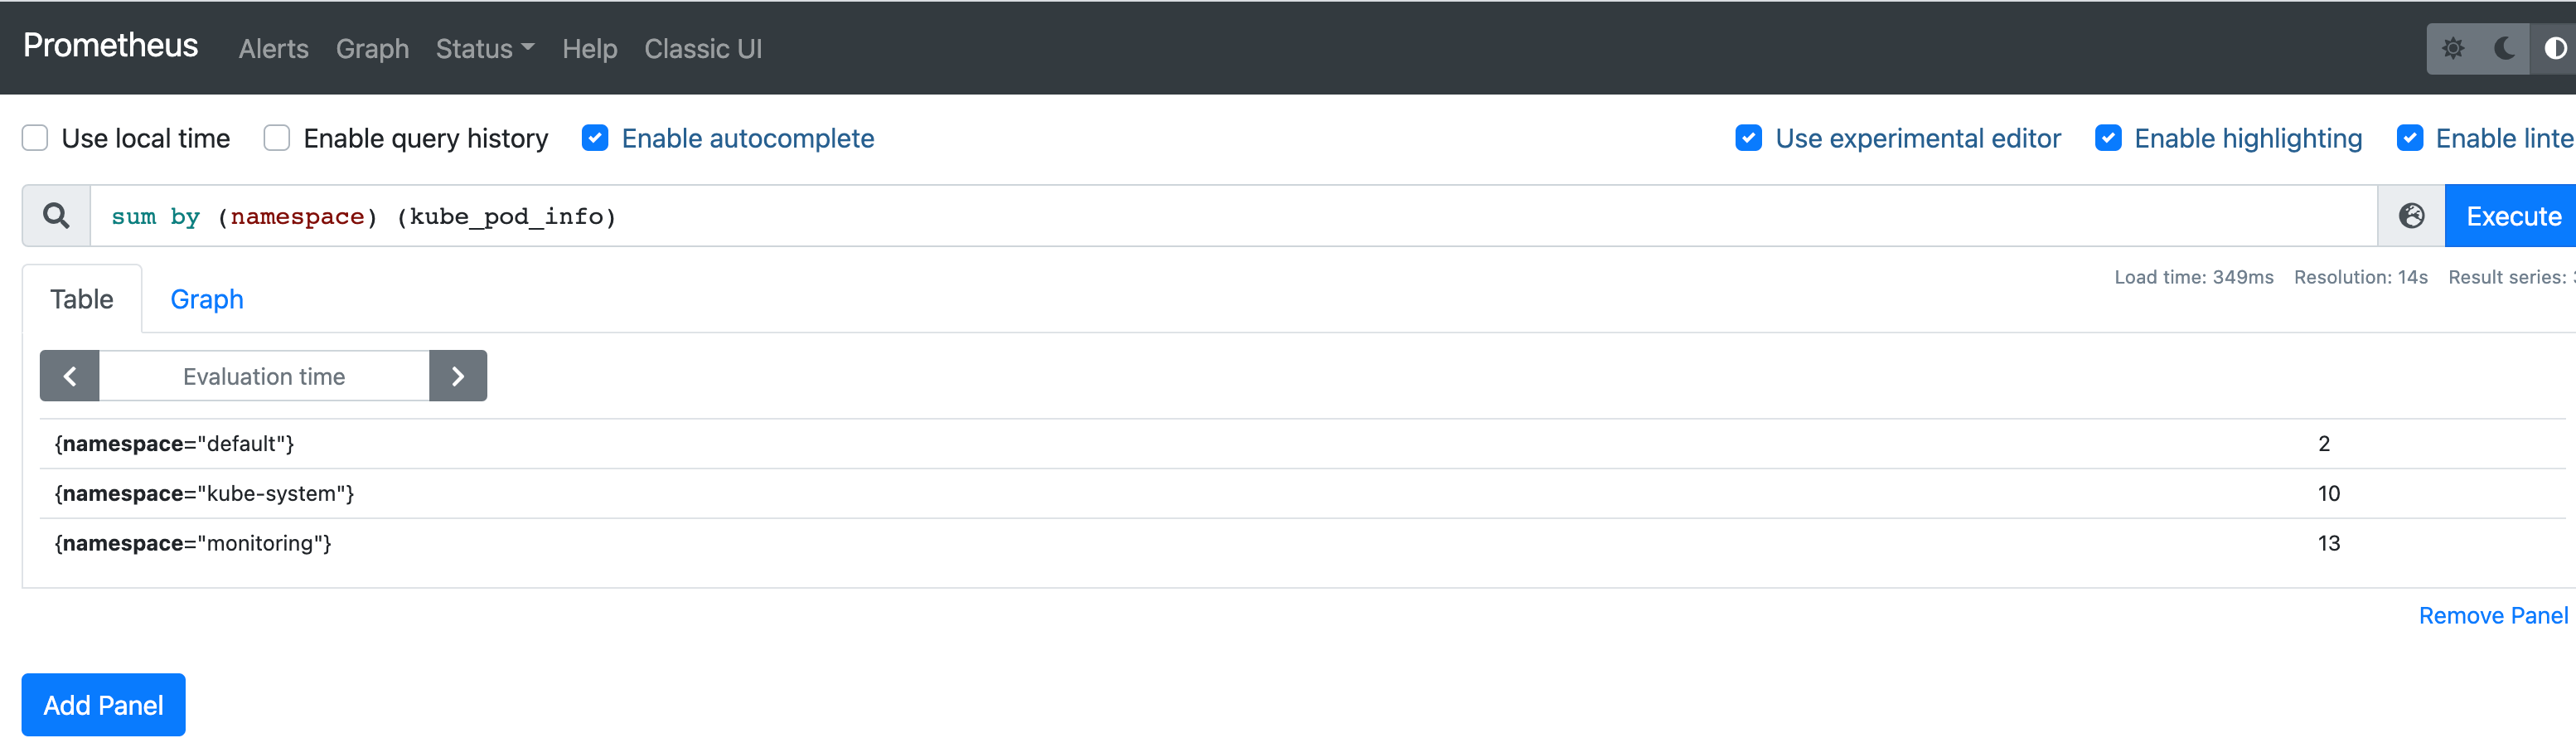
Query 1: Find the number of pods per namespace
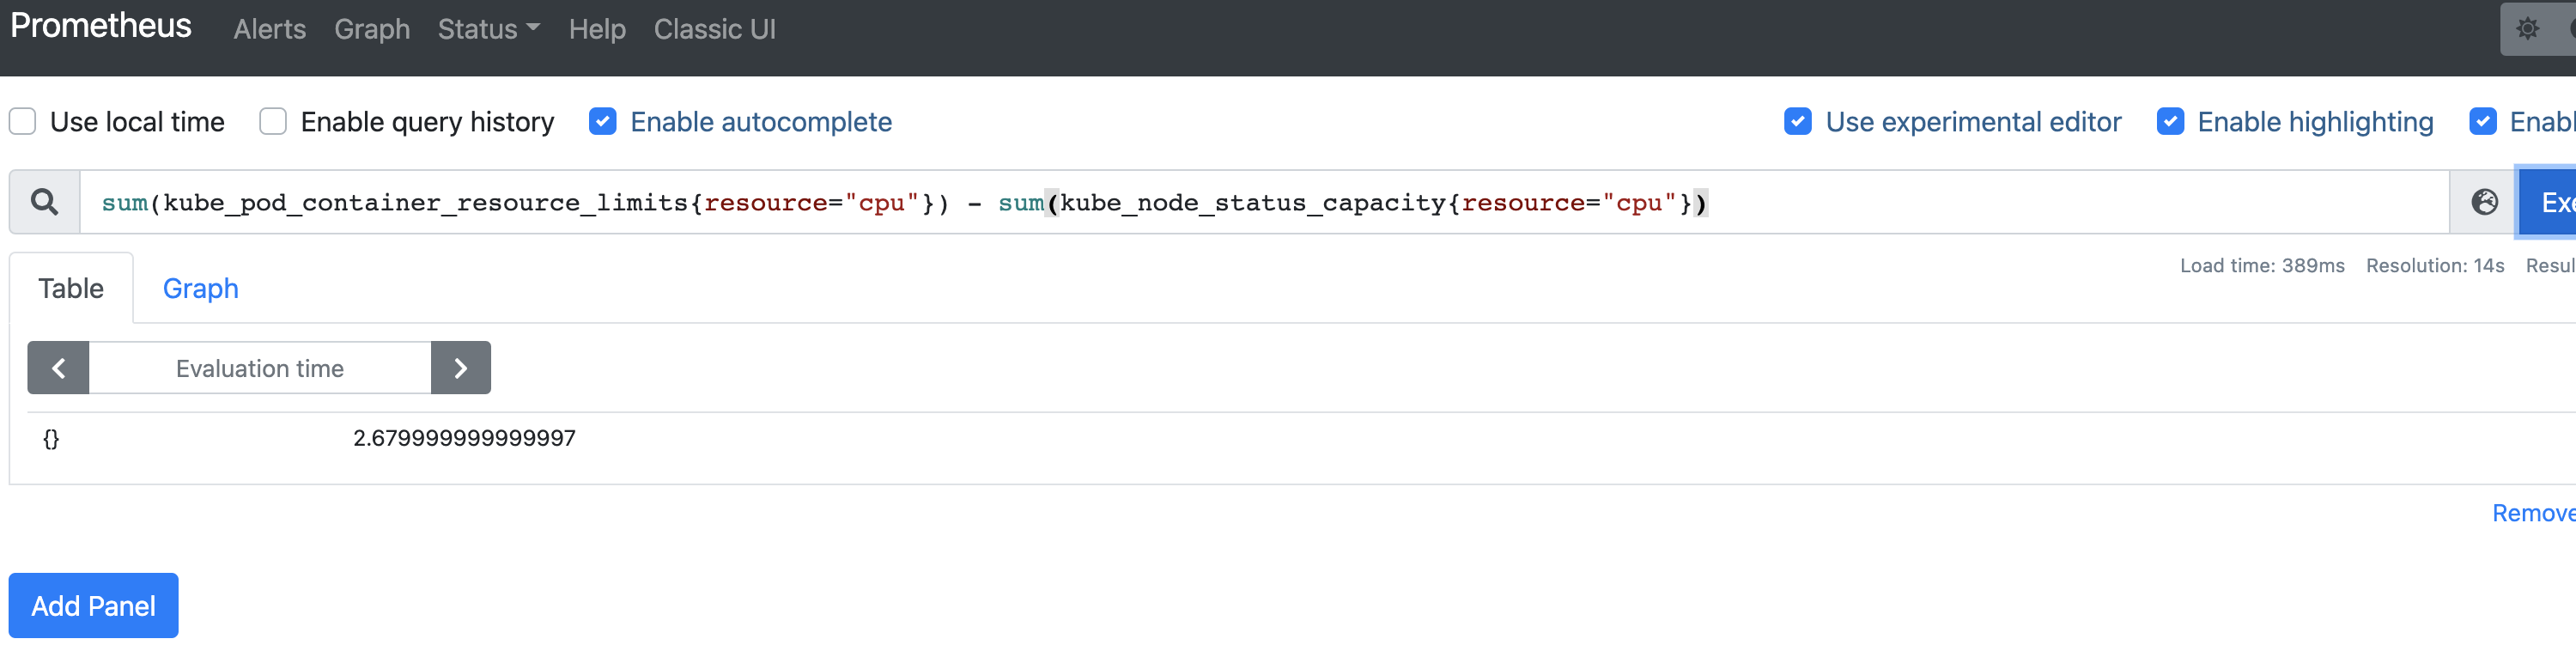
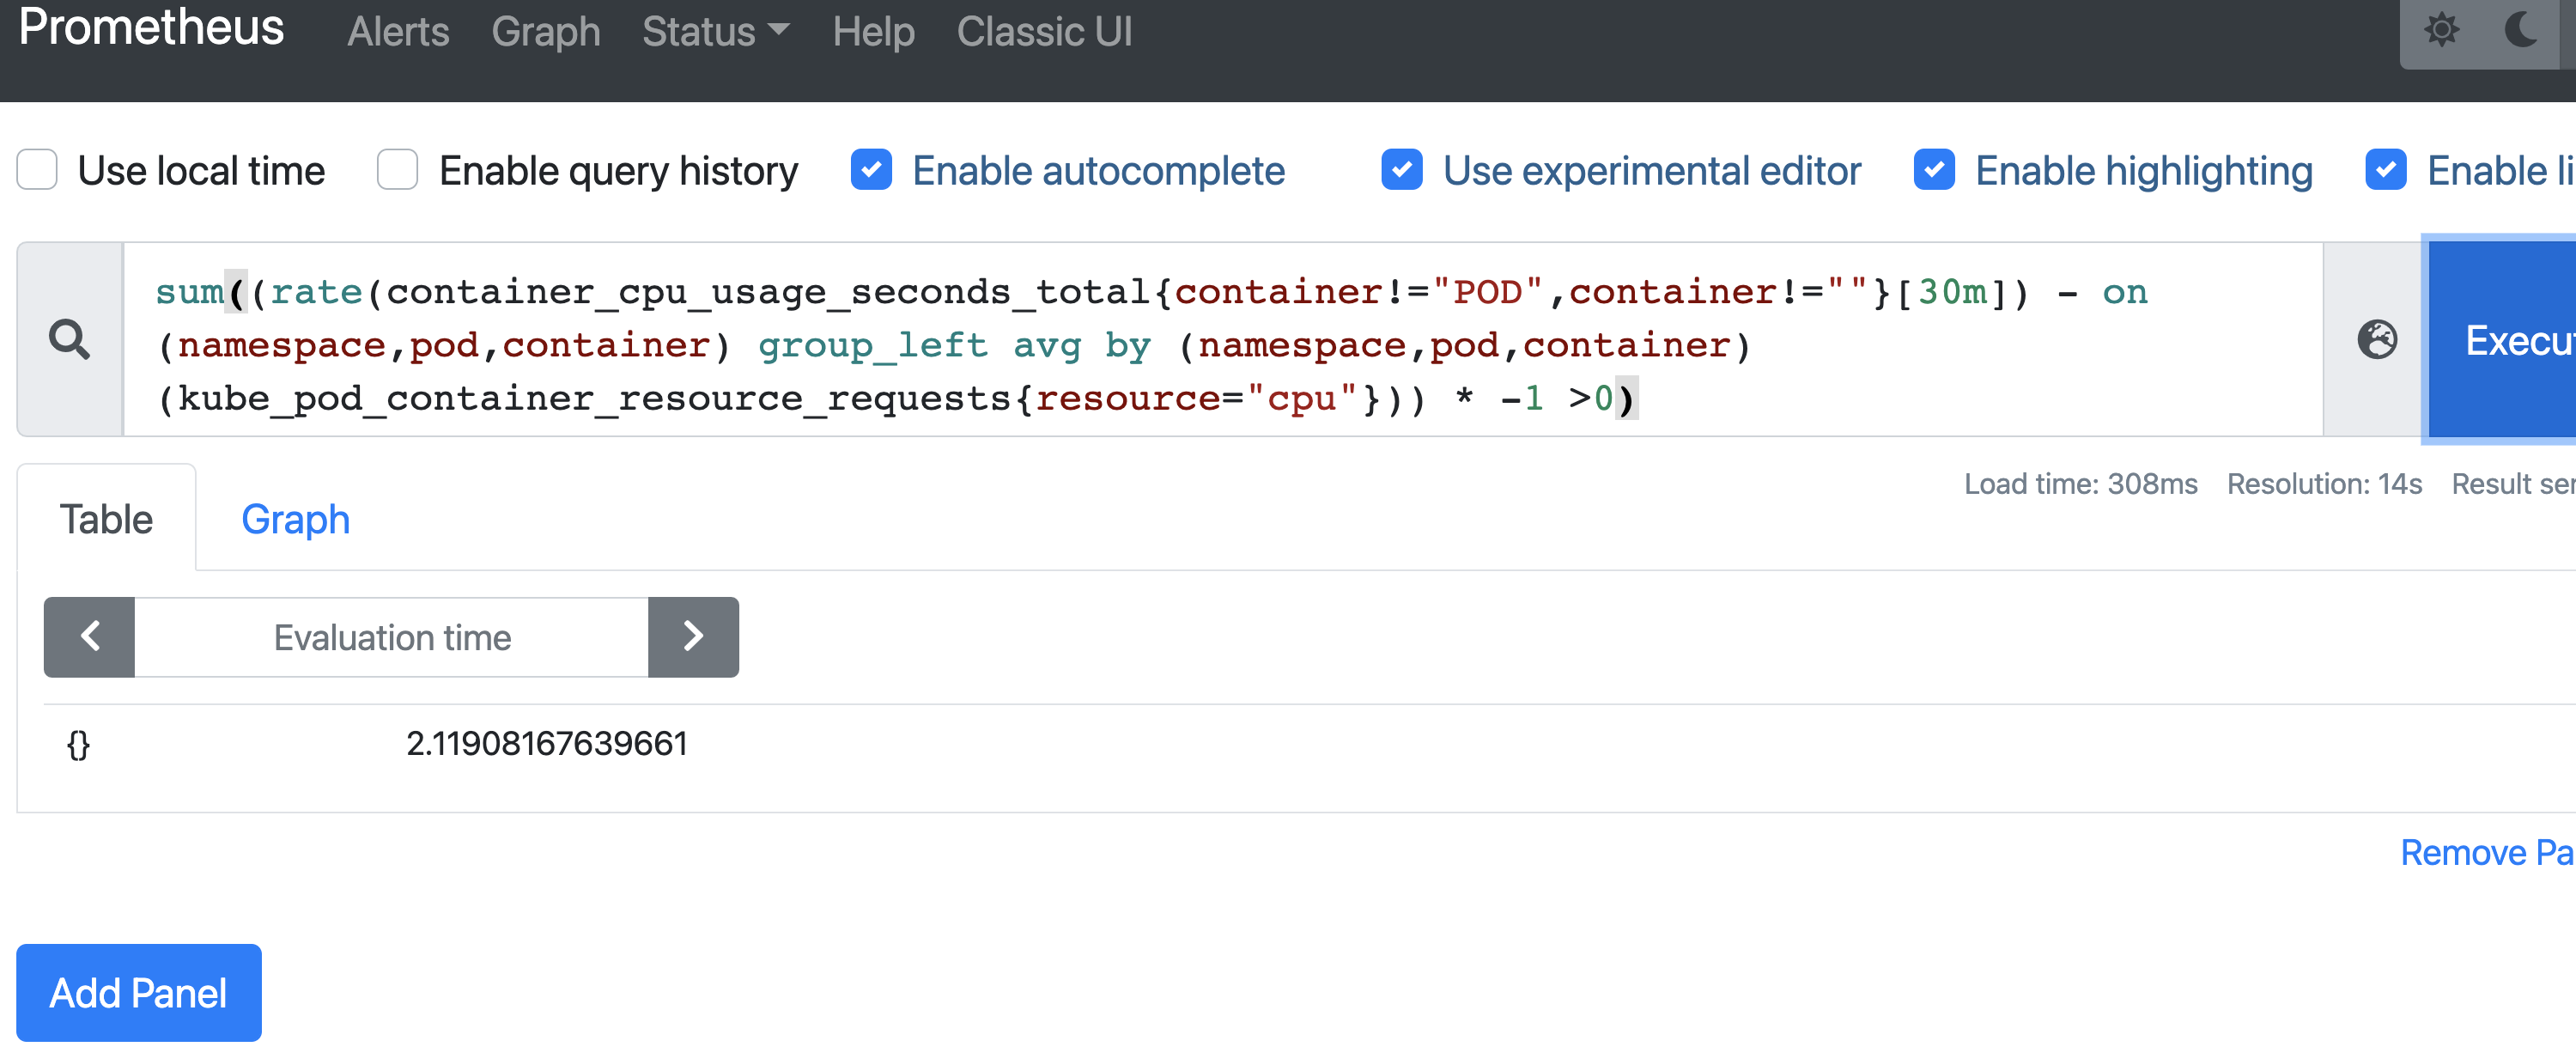
Query 2: Find CPU overcommit
Before running this query, create a Pod with the following specification:
Now run the following query:
If this query returns a positive value, then the cluster has overcommitted the CPU.
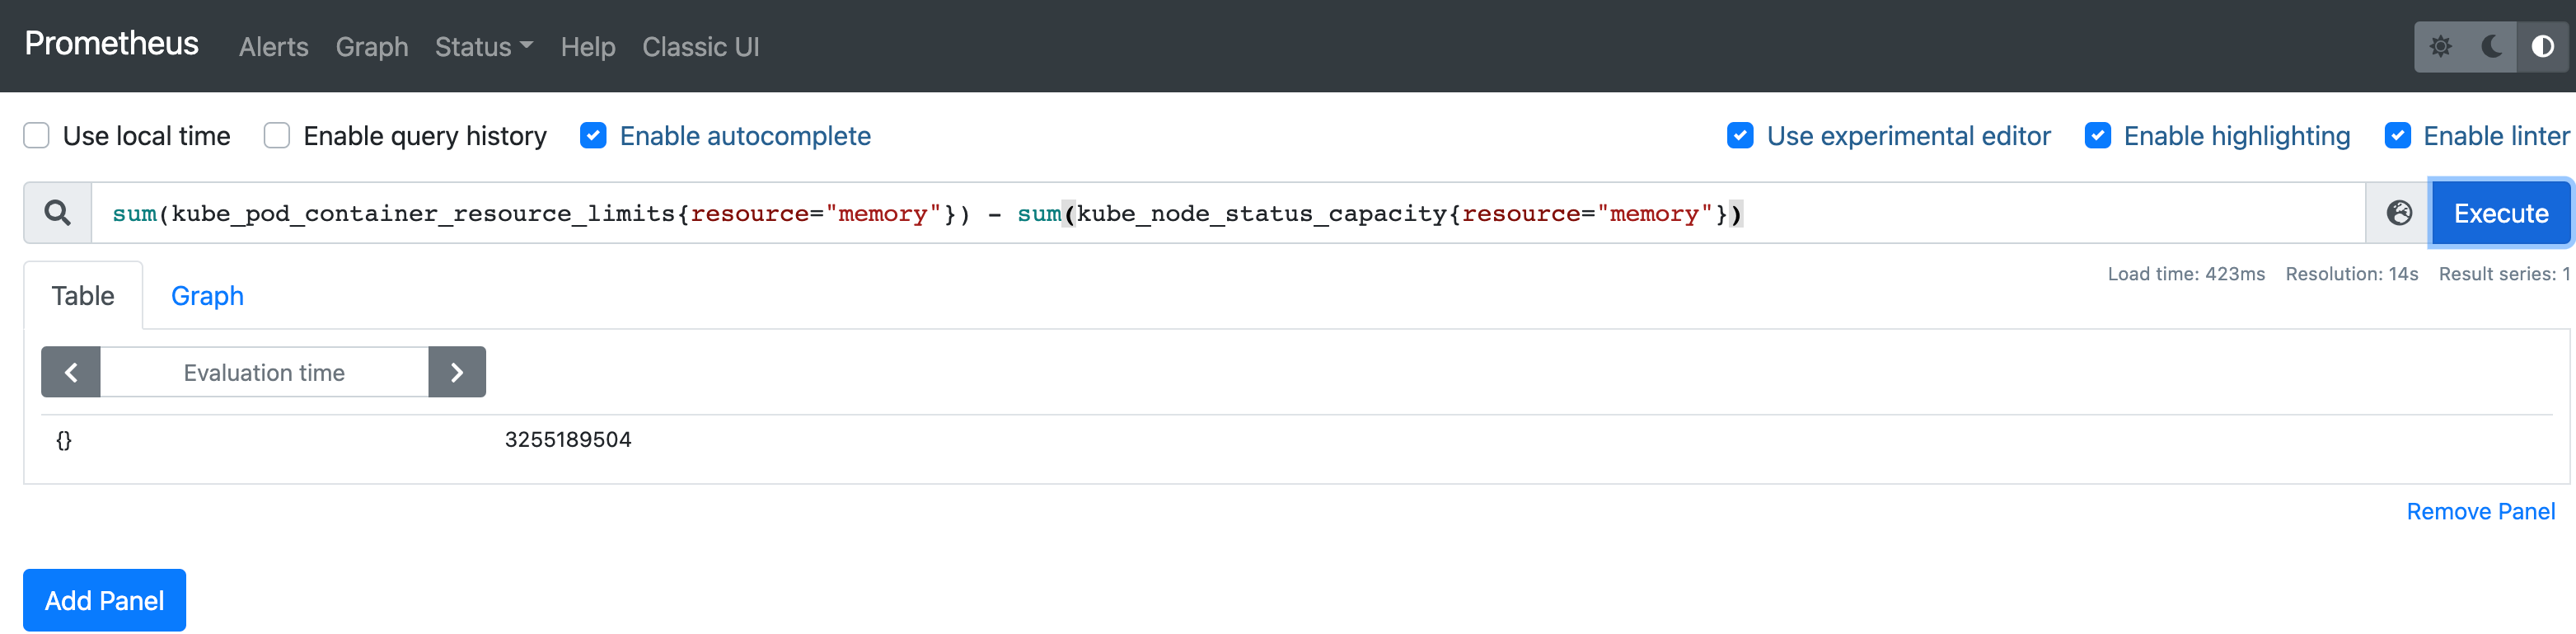
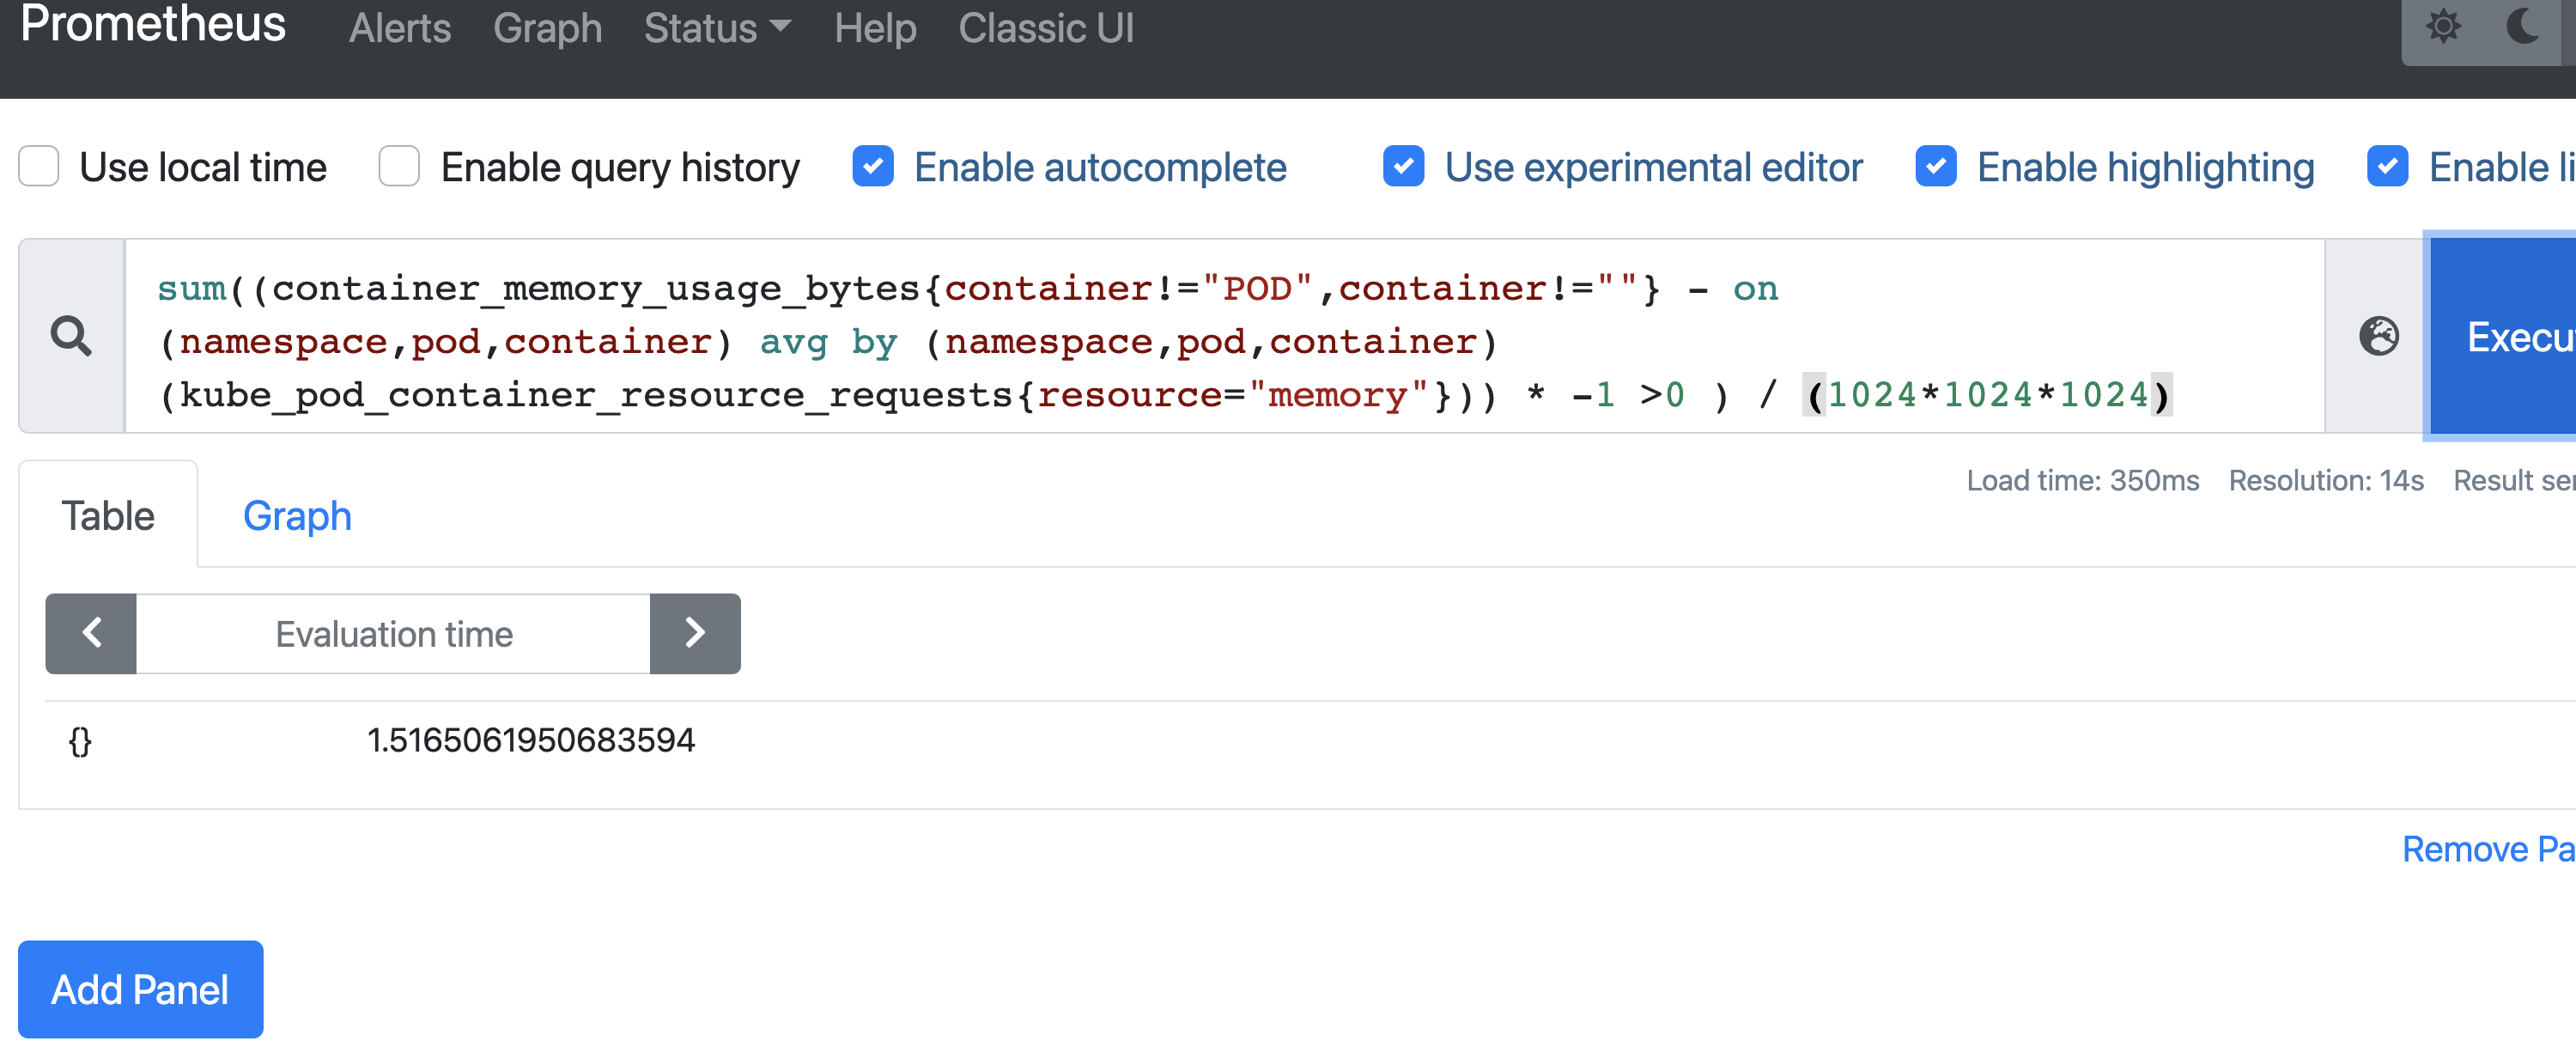
Query 3: Memory overcommit
If this query also returns a positive value, then our cluster has overcommitted the memory.
Query 4: Find unhealthy Kubernetes pods
Before running this query, create a Pod with the following specification:
This pod won’t be able to run because we don’t have a node that has the label disktype: ssd.
Now run the following query:
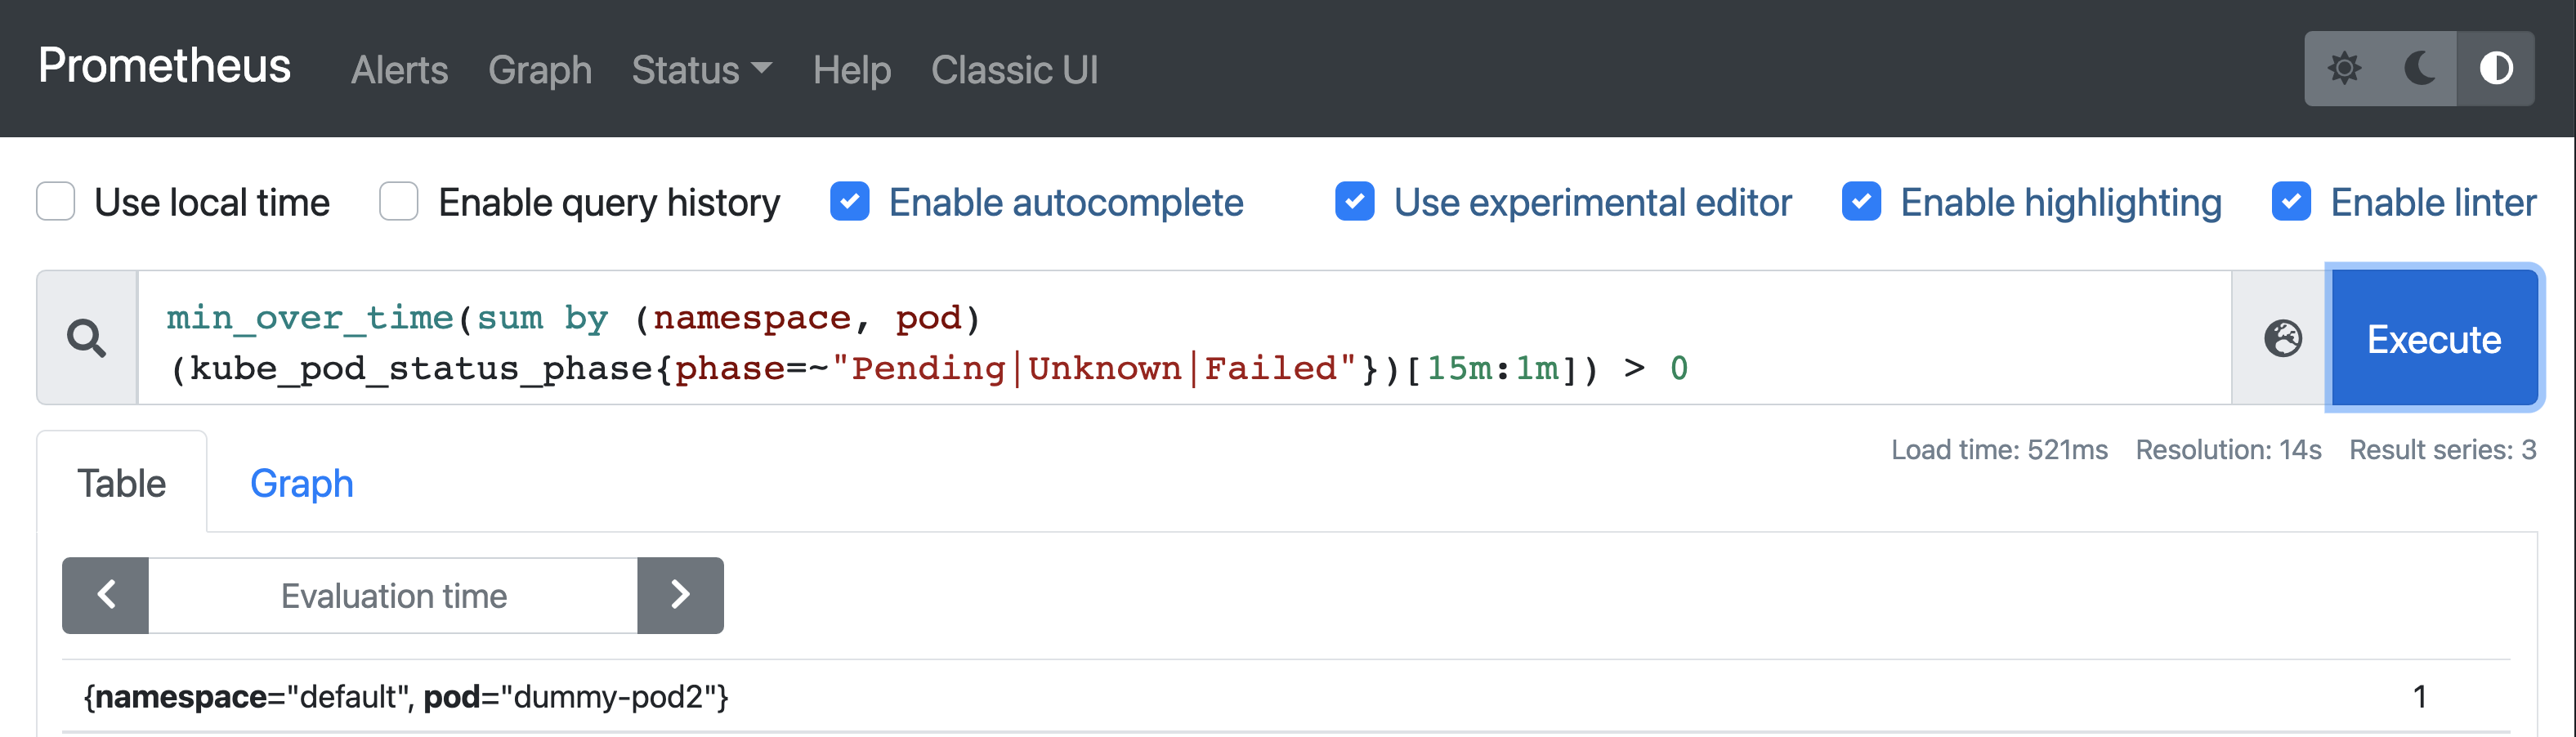
Query 5: Find Kubernetes pods CrashLooping
Before running the query, create a Pod with the following specification:
Now run the following query:
More on CrashLooping here.
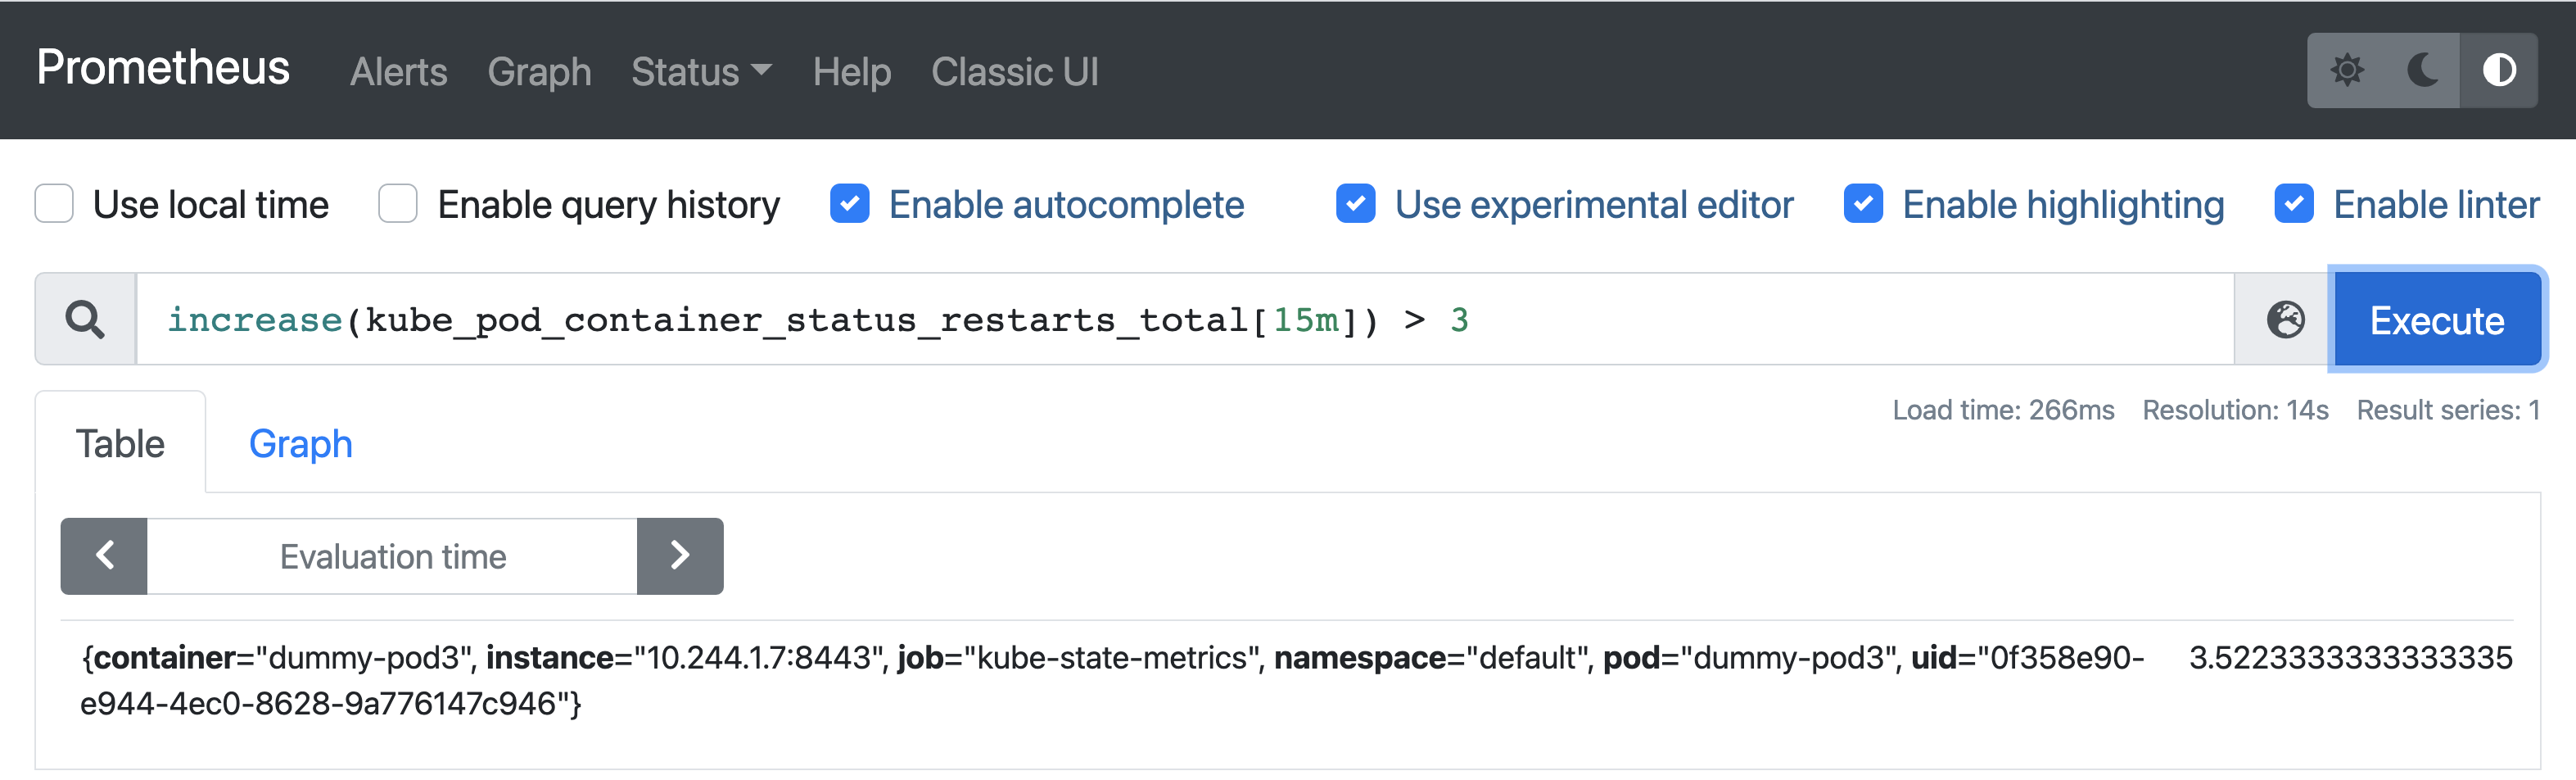
Query 6: Find the number of containers without CPU limits in each namespace

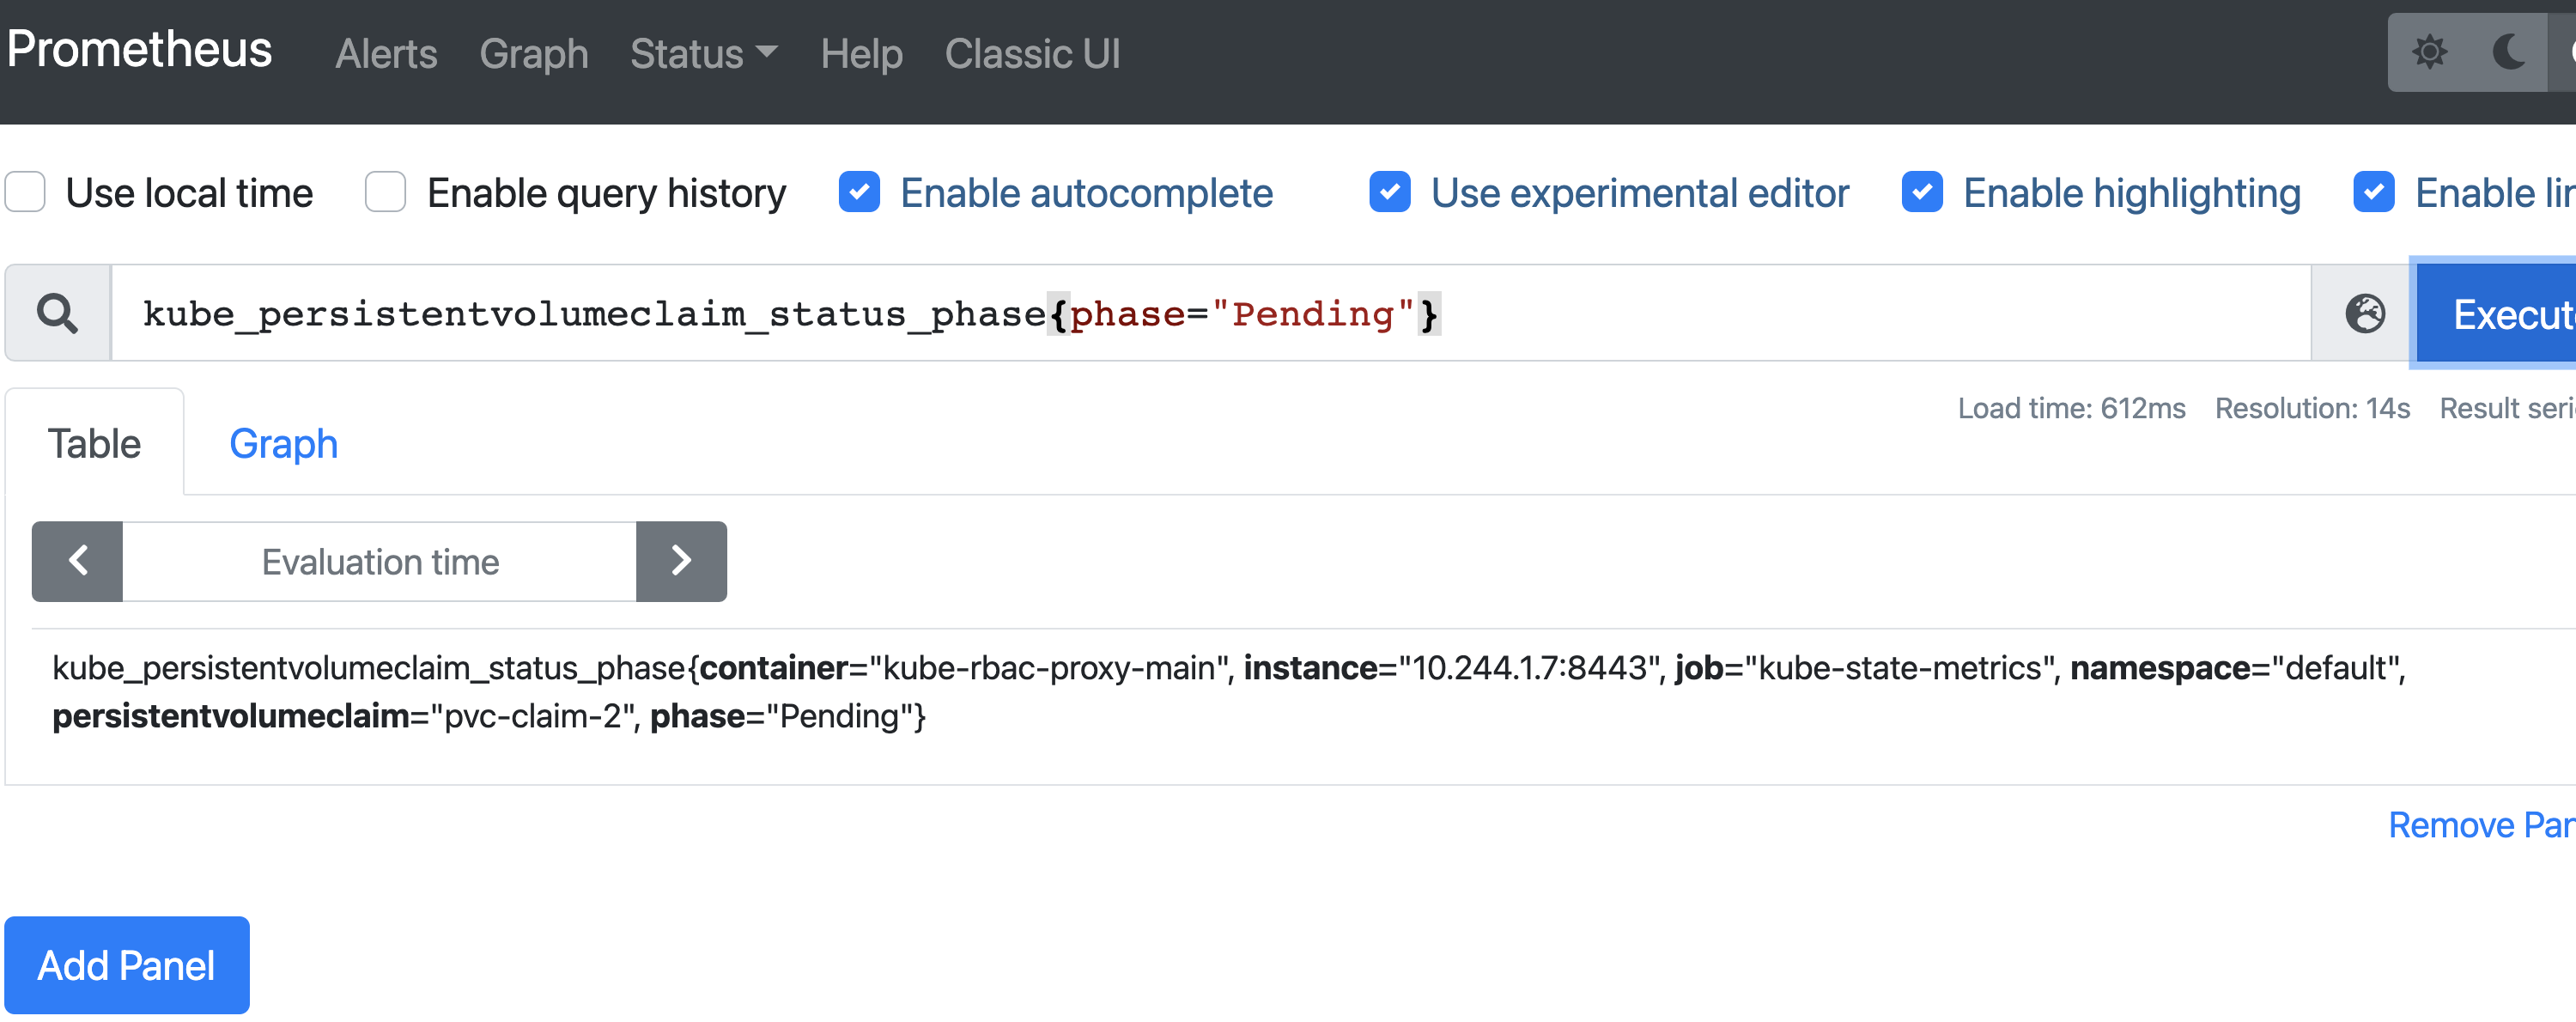
Query 7: Find PersistentVolumeClaim in the pending state
Before running the query, create a PersistentVolumeClaim with the following specification:
This will get stuck in Pending state as we don’t have a storageClass called “manual" in our cluster.
Now run the following query:
Query 8: Find unstable nodes
In this query, you will find nodes that are intermittently switching between “Ready" and “NotReady" status continuously.
If both the nodes are running fine, you shouldn’t get any result for this query.
Query 9: Find idle CPU cores
Query 10: Find idle memory
Query 11: Find node status
Conclusion
This article covered a lot of ground. You’ve learned about the main components of Prometheus, and its query language, PromQL. You saw how PromQL basic expressions can return important metrics, which can be further processed with operators and functions. You set up a Kubernetes cluster, installed Prometheus on it, and ran some queries to check the cluster’s health.
These queries are a good starting point. The real power of Prometheus comes into the picture when you utilize the alert manager to send notifications when a certain metric breaches a threshold. And then there is Grafana, which comes with a lot of built-in dashboards for Kubernetes’ monitoring. I suggest you experiment more with the queries as you learn, and build a library of queries you can use for future projects.
If you're looking to build even more powerful Kubernetes monitoring dashboards or build secure internal tools using scripts, queries, APIs, and more, Airplane may be a great fit for you. With Airplane, you can build custom internal UIs and workflows using code within minutes.
Airplane also offers strong built-in features like job scheduling and permissions setting that make it easy to automate your workflows and provide internal tooling access to non-technical team members in a secure manner.
To try it out and build your first internal tool in Airplane, sign up for a free account or book a demo.


