AWS Fargate is a service provided by Amazon that allows users to run containers on Amazon’s cloud computing platform. Fargate handles and configures the servers and core infrastructure, so users can focus on managing activities at the container level. It’s a pay-as-you-go engine that provides serverless compute resources for Amazon Elastic Container Service (ECS) and Amazon Elastic Kubernetes Service (EKS).
Log collection enables you to obtain visibility into your ECS clusters and the Fargate architecture that powers them. This article demonstrates how you can use CloudWatch to keep an eye on the actions of your Amazon ECS and Amazon EKS clusters hosted on AWS Fargate. Additionally, you’ll learn how to set up and run a simple Python application on an ECS and EKS cluster using Fargate as a compute engine.
What is AWS Fargate?
Fargate was launched by AWS in 2017 to help organizations run and manage containers without the need to manage the EC2 infrastructure. When scalability and workflow management are concerns, Fargate is frequently used with ECS or EKS. You don’t need to concentrate on choosing instance types because Fargate calculates the amount of compute resources required. Fargate’s pay-as-you-go feature means you only pay for what you use and don’t have to worry about overpaying and wasting resources.
Fargate offers good monitoring and observability thanks to built-in integrations with other AWS services such as Amazon CloudWatch Container Insights and other third-party tools. You can easily deploy and scale containerized data processing workloads using Fargate with ECS or EKS. When training, testing, and deploying your machine learning (ML) models, you can use Fargate to increase server capacity without over-provisioning.
How does Fargate work?
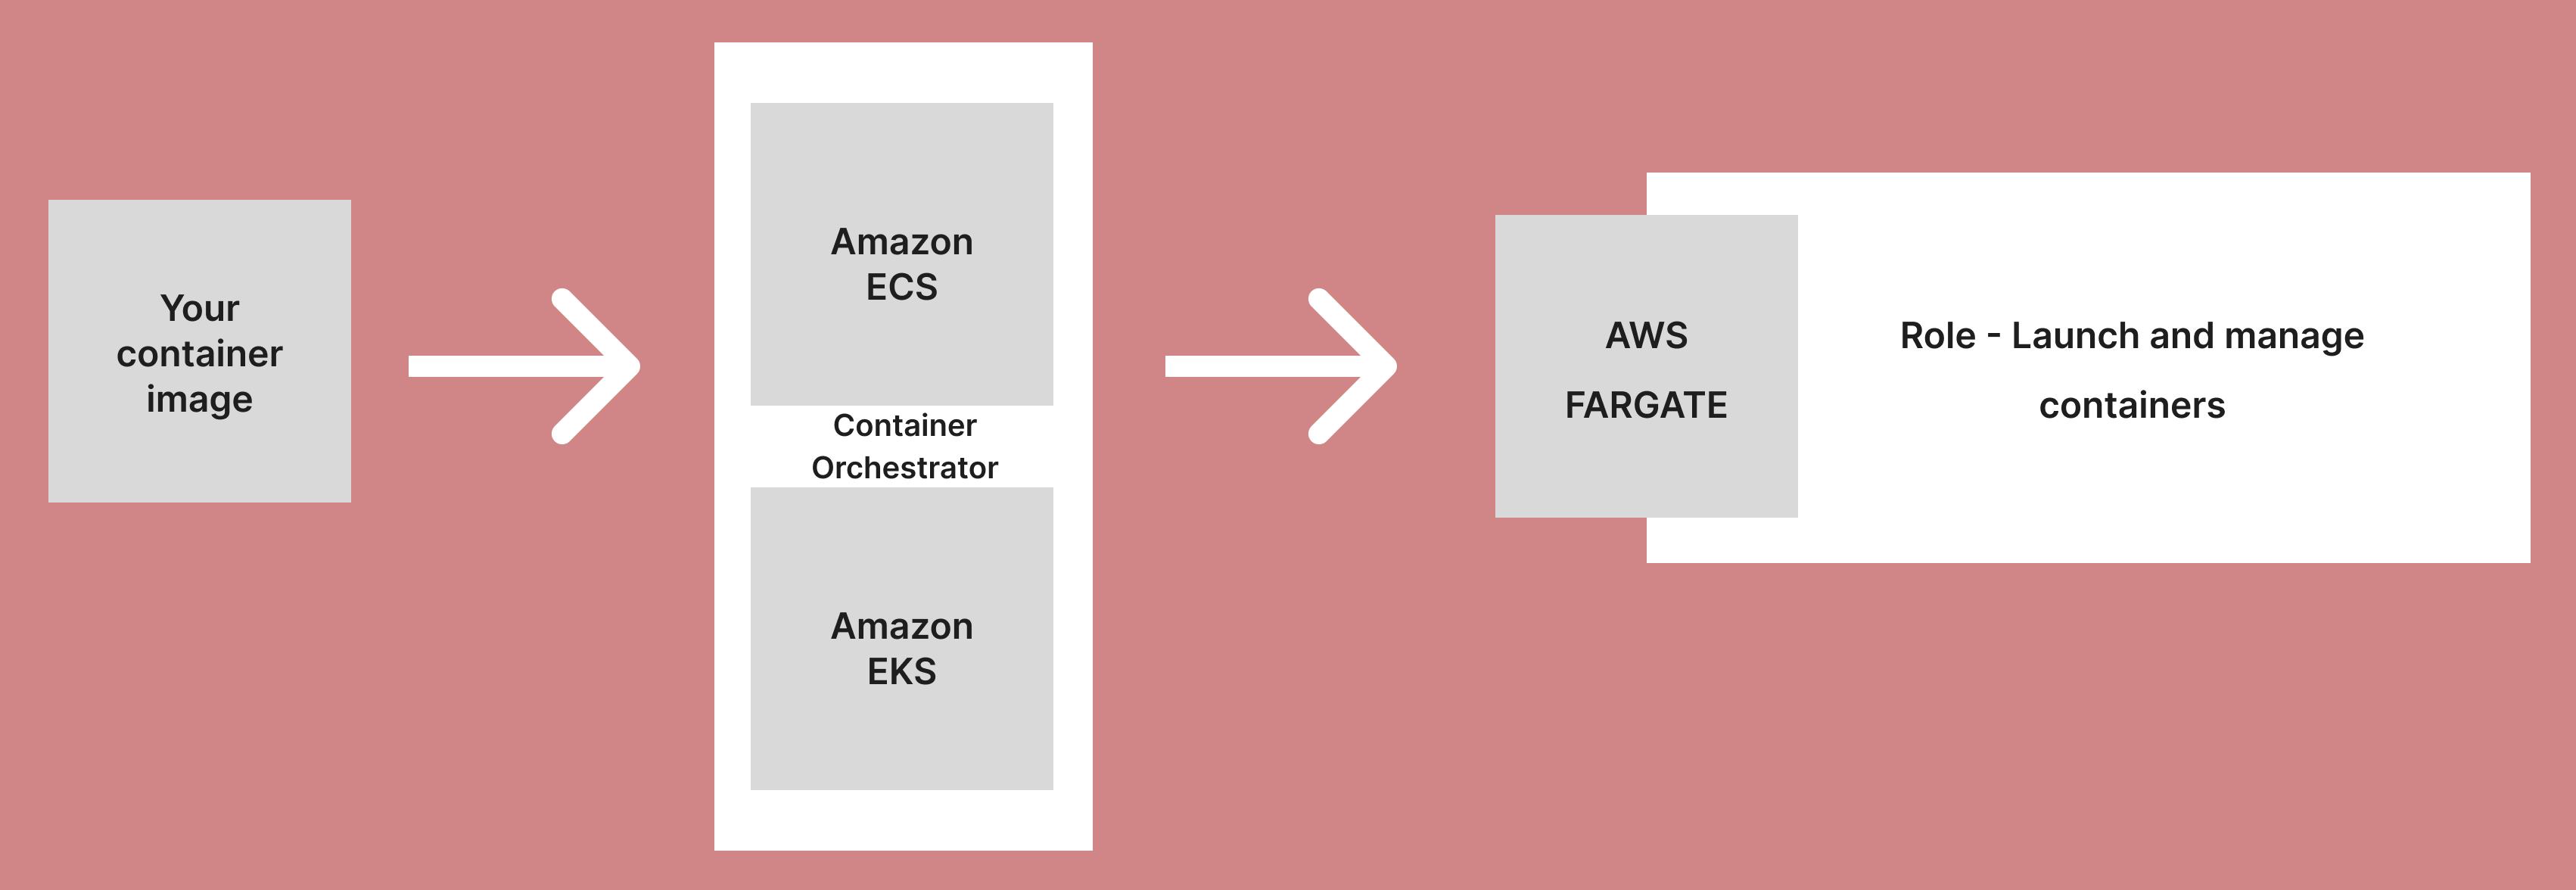
To use Fargate to manage your application container deployment, you must first create a task and cluster using an orchestration service such as ECS or EKS, as well as a container stored in a container registry. This involves the following steps:
- Create a container image (readonly template).
- Host in a registry, such as Amazon ECR.
- Choose an orchestration service, such as Amazon ECS or EKS.
- Create a cluster and choose AWS Fargate.
Log collection challenges in Fargate
AWS Fargate stores, monitors, and manages your log files using CloudWatch logs. Logs are important because they help you manage your applications. By default, AWS Fargate retains CloudWatch logs indefinitely. However, the retention period can be changed by adjusting the range, which can be set from one day to ten years.
Though AWS Fargate has significant benefits, as with anything, it also has some drawbacks. Monitoring and observability remain challenging with Fargate, and there are some significant problems with collecting and monitoring logs. One common issue with log collection in Fargate is that CloudWatch logs can return empty after running some applications.
This makes tracking and monitoring your application difficult. This inconsistency could be caused by the applications not writing to the correct location, problems with the host instance, or other factors.
Another issue with log collection in Fargate is that some logging inconsistencies can make it difficult to monitor running tasks. Some task logs may be visible, while others may not. Other challenges include how difficult it is to set up and configure, particularly for beginners, and missing log issues with EKS.
Containerization, running your apps in AWS Fargate, and log monitoring
This tutorial explains how to collect and monitor logs on ECS and EKS running with Fargate. You’ll begin by launching a basic web application on AWS. You will next create an image for this application, distribute it to ECS and EKS clusters, and lastly publish it to AWS Fargate. You’ll create a simple application that demonstrates the entire procedure of gathering logs by default through CloudWatch.
Running ECS with Fargate
You can deploy, manage, and scale containerized apps with ease using Amazon ECS (Elastic Container Service), a fully managed container orchestration service. With Fargate, unlike EC2, you do not have to worry about the underlying infrastructure.
Prerequisites for ECS with Fargate
This tutorial assumes you are familiar with web app development and containerization. To proceed, make sure you have an AWS account, Docker installed and running on your local development system as well as the AWS CLI, and a basic understanding of these technologies. We will also be using Python to create a simple app, so you must have it installed. We’ll create a simple news aggregator that will pull data from a News API. You can obtain your API key here.
Create a simple Flask app
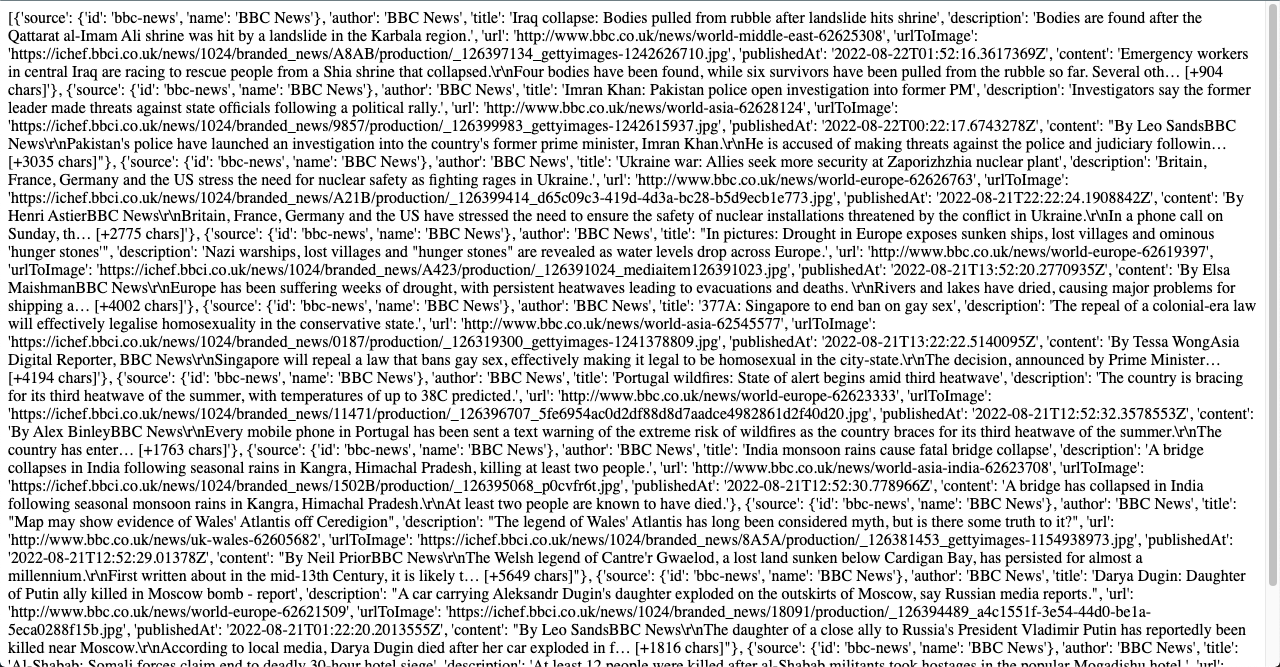
First, you’re going to create a simple Flask app, which, as mentioned earlier, is an aggregator that pulls data from the News API endpoint.
Create your project folder mkdir flask-fargate-tutorial.
Move into the project’s directory in your terminal, so cd flask-fargate-tutorial.
Next you need to to set up a virtual environment. If you don’t have an environment installed, use the following command: pip install virtualenv or pip3 install virtualenv if you’re on Python 3. If it’s already installed, type python -m venv env into your terminal.
After that, run the following activation command: source env/bin/activate. You should start seeing (env) prefixed to the start of your terminal line.
Next, create a requirements.txt file. This houses all the needed packages. It should contain:
Run the command pip install -r requirements.txt to install the dependency packages in the requirements file. Create a file called run.py and set up our ports:
To create the main body of the code, create a folder within the root folder and call it web.
Within the web folder, create a file __init__.py, which will hold all our codes. Add the following code to this file:
Run python run.py or python3 run.py if you are on Python 3.
When you visit http://localhost:8080 in your browser, you should see something like this:
Creating a Docker image
Now that your app is up and running, you’re going to deploy it to Docker.
Create a ‘Dockerfile’, add the code below to this file, and save it:
Afterwards, start your Docker application. You can check your Docker engine’s status to see whether or not your Docker is running successfully.
Return to your project terminal, make sure you’re in the root folder, and then run the command `docker build -t flask-fargate-tutorial .`. This command creates your Docker image.
To see the working version of docker build, type `docker run -p 8080:8080 flask-fargate-tutorial`. A link will be generated, which you can access in your browser.
Identity and access management (IAM)
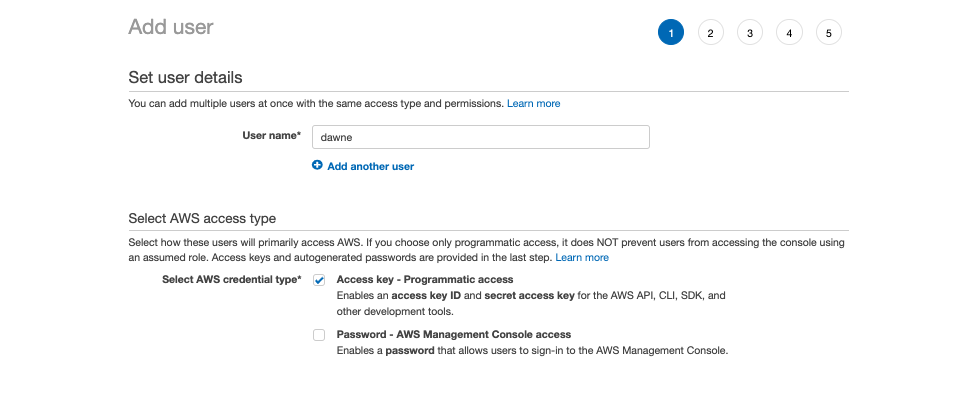
You’ll need an AWS access key ID and an access key. So, log in to your AWS account, go to your IAM Dashboard, and click the “Add User” button.
Give this user a username and select “Access key - Programmatic access” as the Access Type. By selecting this credential type, access key ID and secret access key will be enabled for this user and they may use it to access AWS development tools.
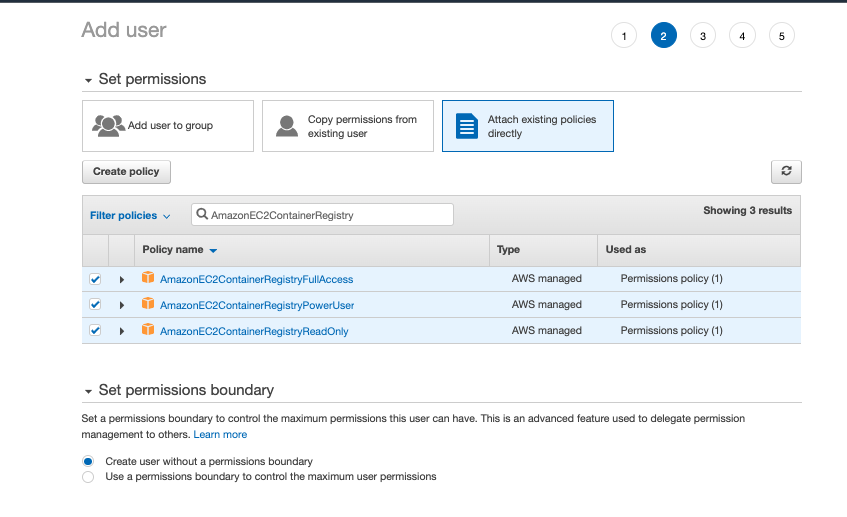
Next, set the following user permission:
- AmazonEC2ContainerRegistryFullAccess
After this, you’ll have the opportunity to add tags. This step is optional and not necessary for this tutorial.
Click the Review button to view a summary of your user details.
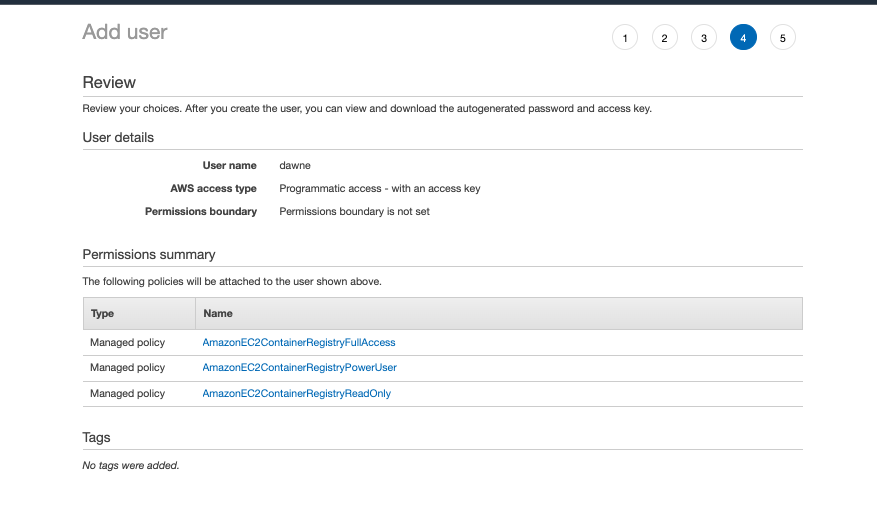
If everything is ok, click the Create User button to create the new user.
After your user is created successfully, save the user keys as you’ll need them later (remember to keep them secure).
Setting up roles
Remain in your IAM dashboard, and follow the steps below to create a new role.
- Click on the Create role button.
- Select “AWS service” as your trusted entity type.
- Under the use case option, select the “Elastic Container Service Task” option, and then click next.
- Under the “Set permissions boundary - optional” dropdown, choose the “Create role without a permissions boundary” option and then click next.
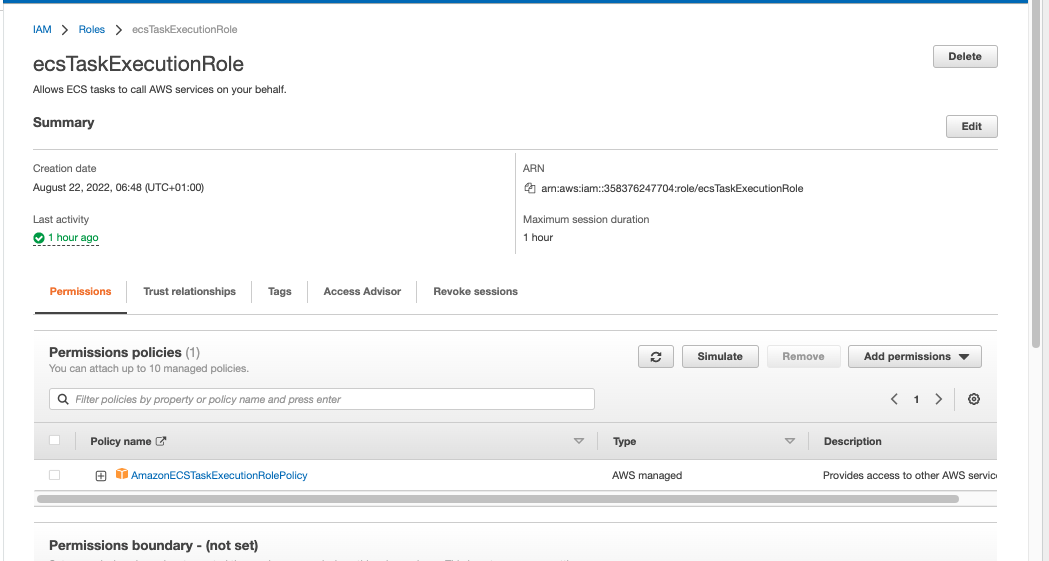
- Set ecsTaskExecutionRole as the role name and add the optional tags if you have any to add.
- Click the “Create role” button. The created role should look as follows:
Create a repository in Elastic Container Registry (ECR)
Amazon Elastic Container Registry (ECR) is a fully managed Docker container registry for managing and deploying Docker container images. Setting up your ECR registry involves a few steps.
Search for ECR in the search bar and then proceed to create a new repository. Simply enter your preferred name.
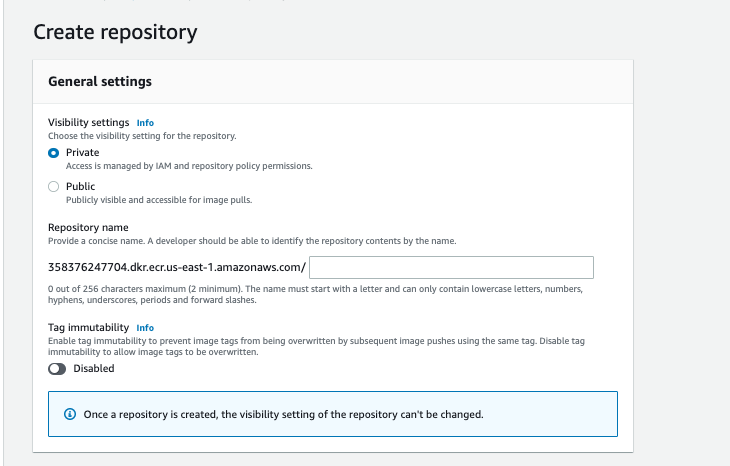
There’s no need to adjust any of the other options for this tutorial, so click the create button.
Select the newly created repository and click the view push commands button. You’ll see a list of commands that you must run on your computer (To run these, you must have AWS CLI installed.)
Before you begin executing these commands, you need to configure your terminal. Enter the command `aws configure`. When prompted for an access and secret key, enter the access key you generated earlier while creating the user.
With the aws configuration complete, the ECR commands can be executed.
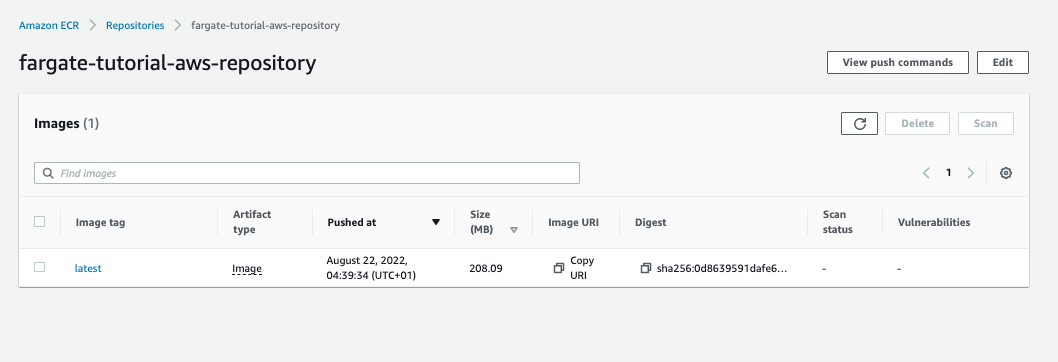
After running all the commands, the image should now be present in the repository on your dashboard.
Configuring your ECS cluster
This section demonstrates how to set up your ECS cluster.
Search for ECS in the search bar and then proceed to create a new cluster.
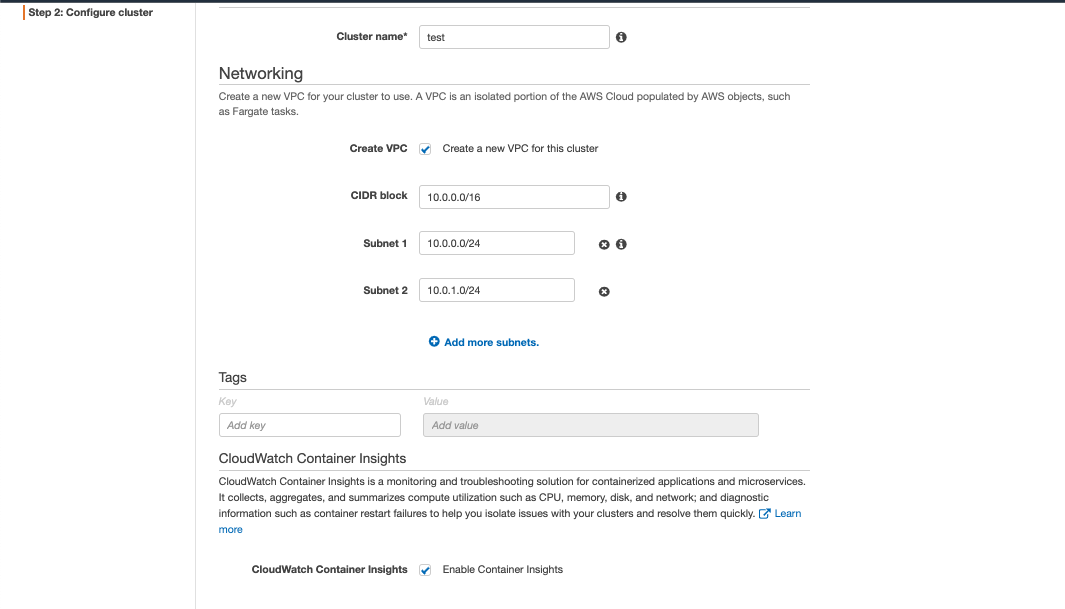
Next, select the network only cluster template and then simply enter your preferred name.
Enter a name for your cluster, check the create VPC and enable CloudWatch Container Insights checkboxes.
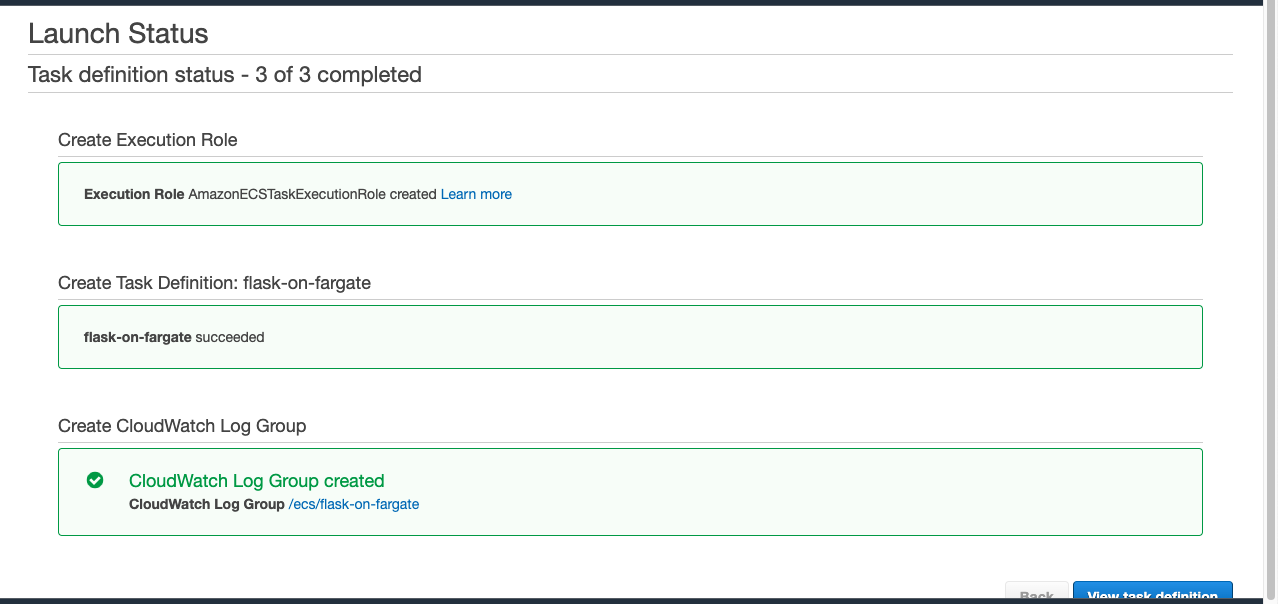
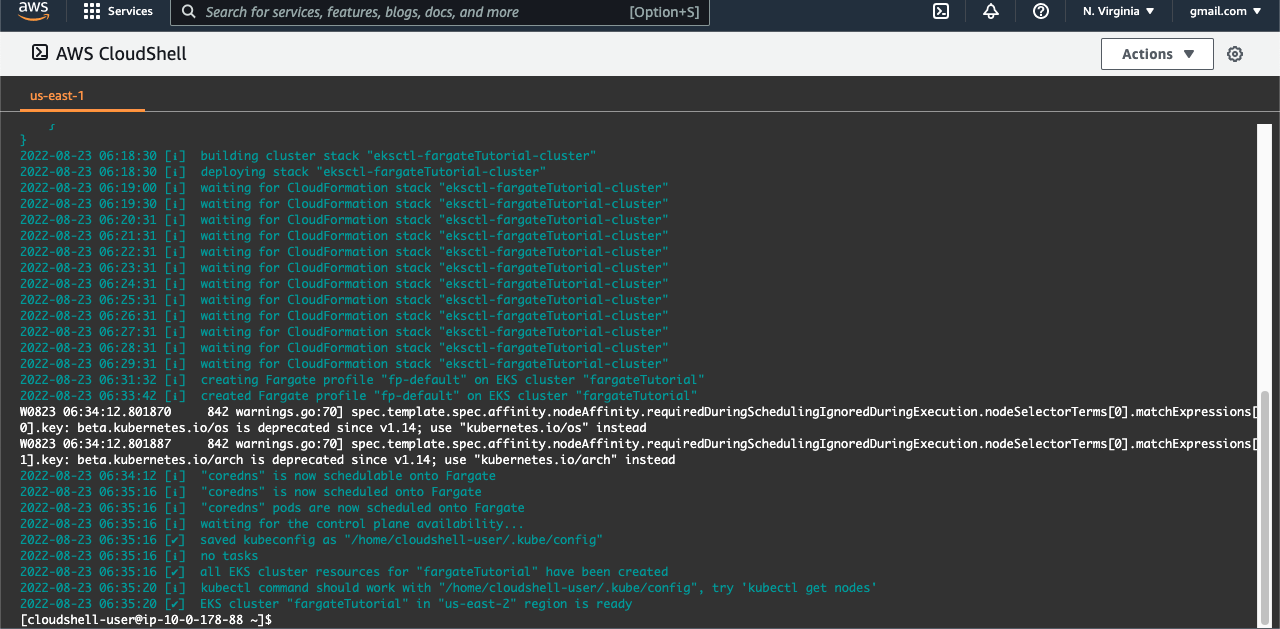
You’ll be directed to a launch status page, from which you’ll launch the ECS cluster and CloudFormation stack. It may take some time. The end result should be as follows:
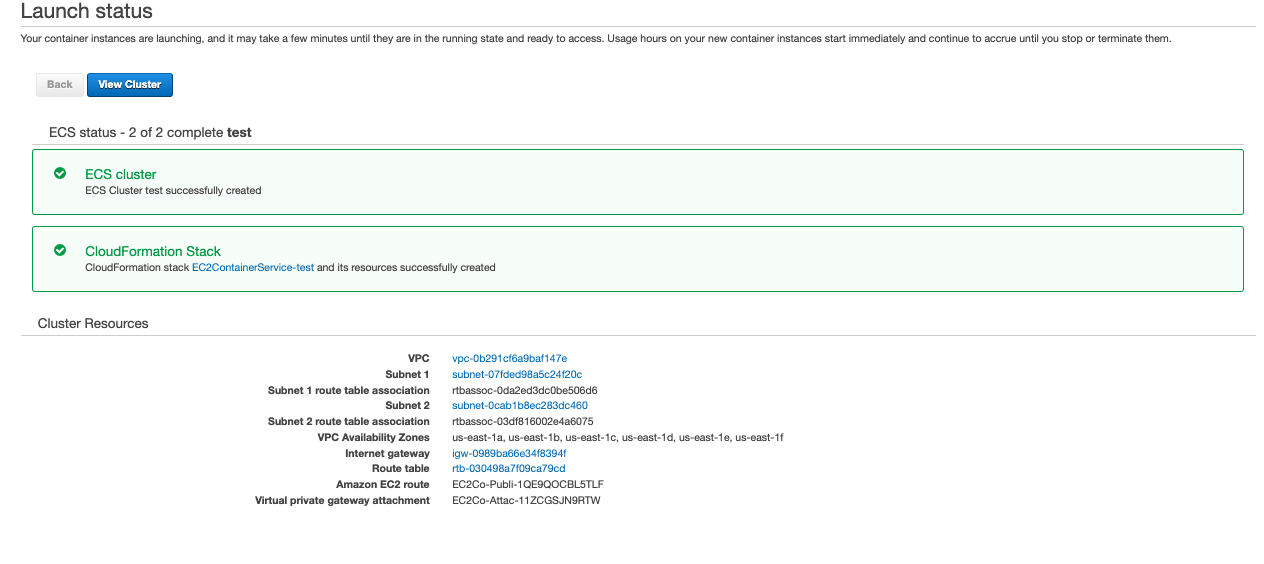
After that, examine the cluster. There should be no services or tasks running.
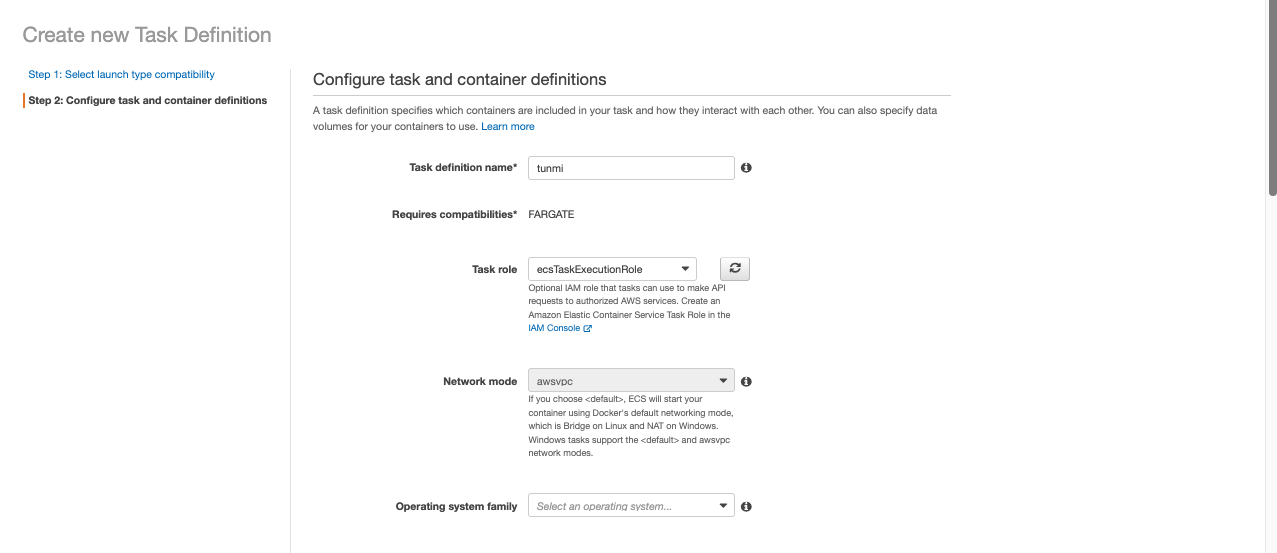
Navigate to Task Definitions and create a new task definition.
Choose Fargate as your launch type and continue.
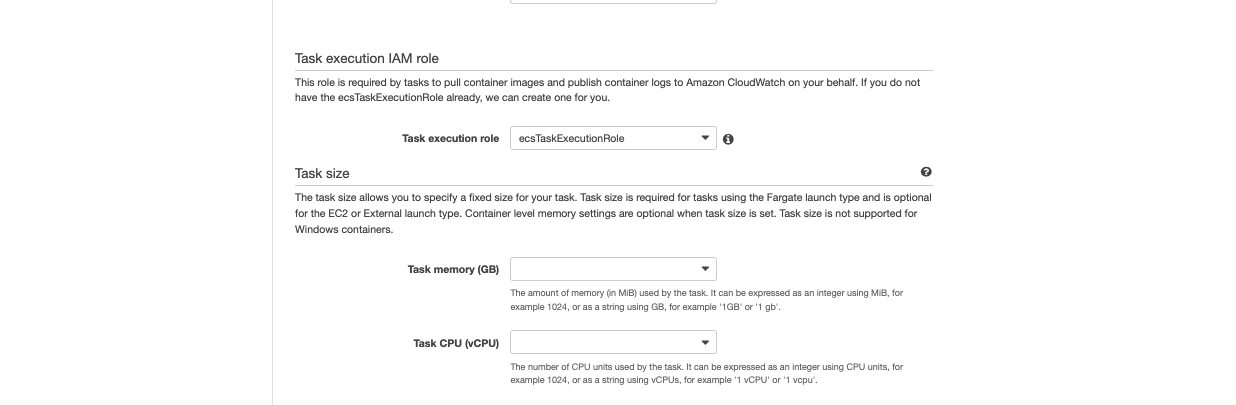
Give the task a name, select the role you created earlier, and, because this is a simple application, select the minimum task memory and CPU power (unless you require more,in which case go ahead and select more than the minimum).
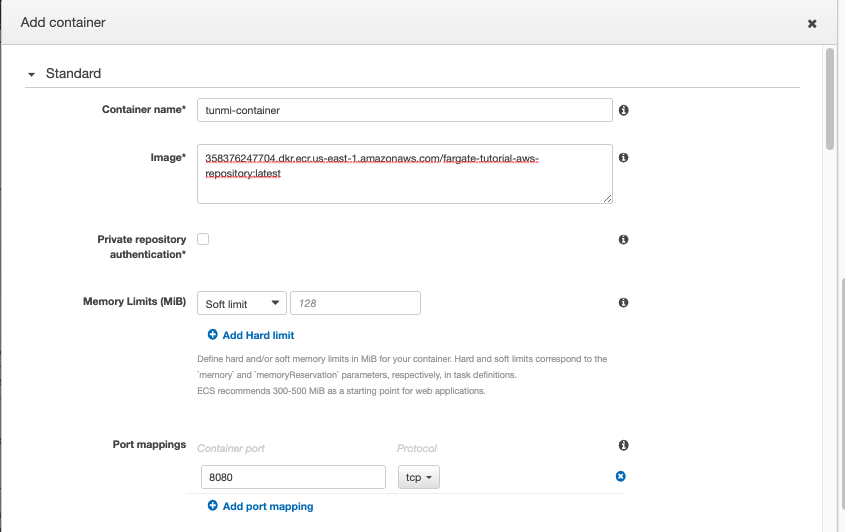
Then, to create a container, select the “Add Container” option.
Set the port to the port value in your flask application and add a container name of your choice.
You’ll be asked to provide an image. This refers to the image link in your ECR registry. So, open your registry in a new tab, select the repository you created, and copy the URL of the image you created within it. Return to the add container form and paste this URL before clicking the add container button.
In your cluster, you now have a defined task.
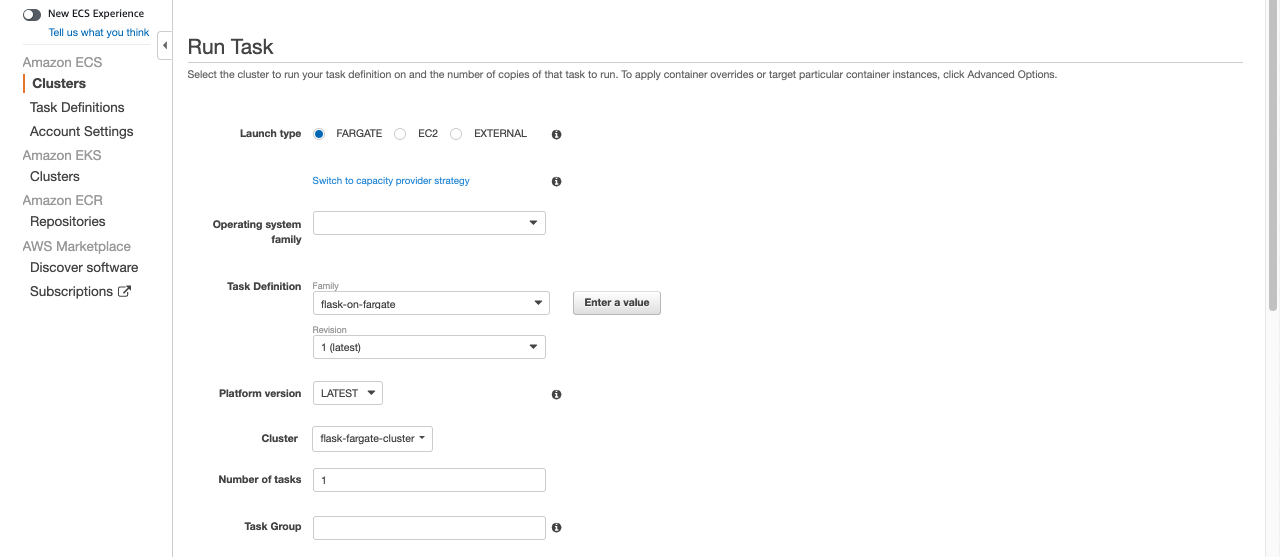
In the task tab of your clusters, click the Run task button.
You’ll need to fill out a couple of forms. First, choose Fargate as the launch type, followed by your newly created task definition and cluster.
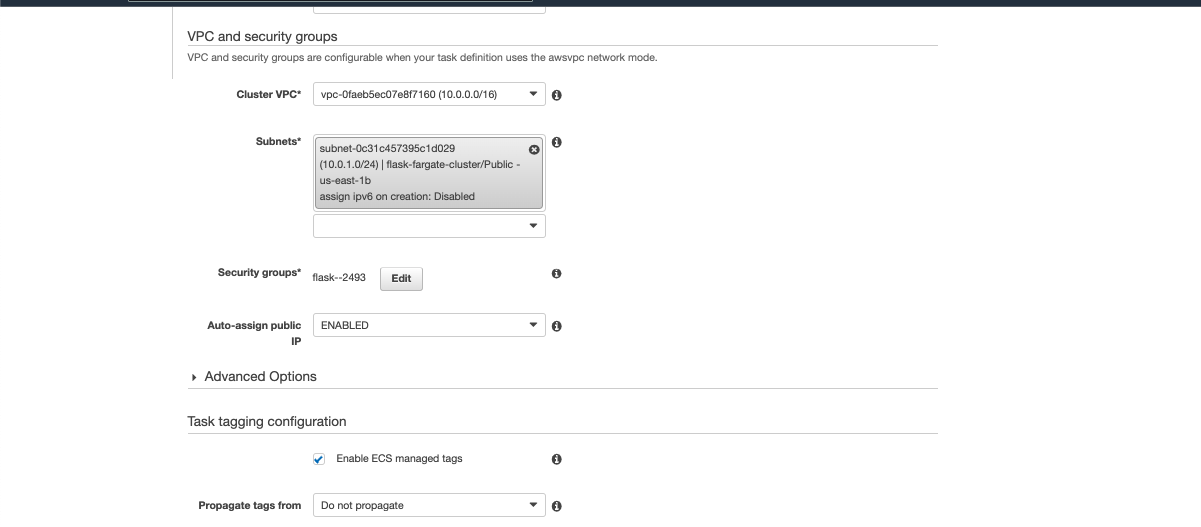
Choose a VPC of the cluster and subnets. Also, ensure that Auto-assign IP is enabled.
After that, you can start the task.
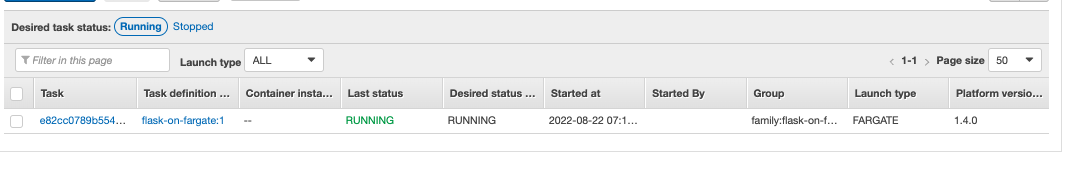
If the task is completed successfully, you should see something like this:
Exposing your defined ports
You need to expose the port that you specified in your application.
Choose your newly created task.
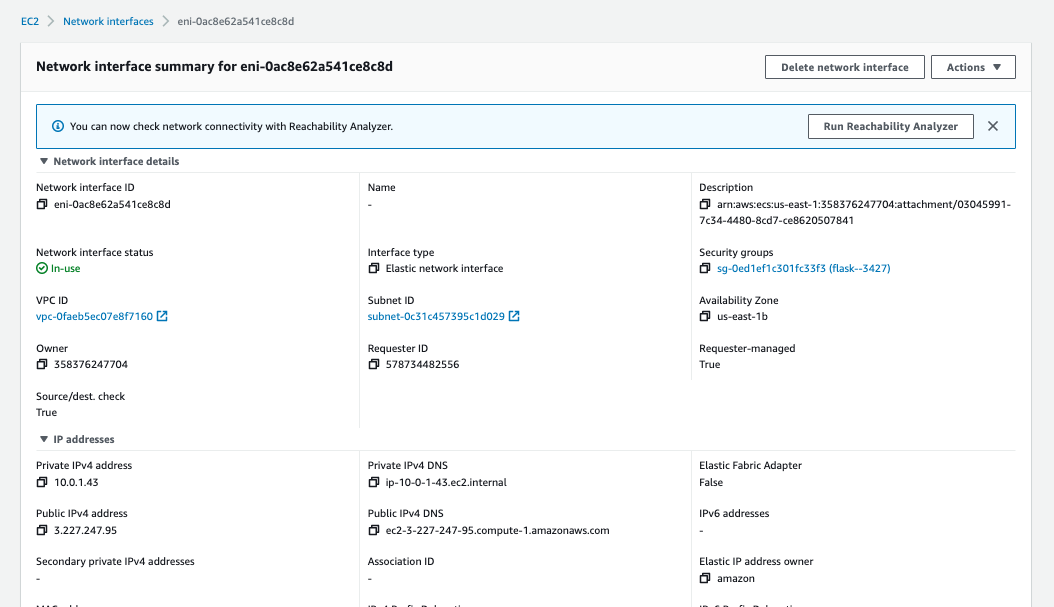
Under the network section, select “ENI id.” A “Network Interface Summary” will appear.
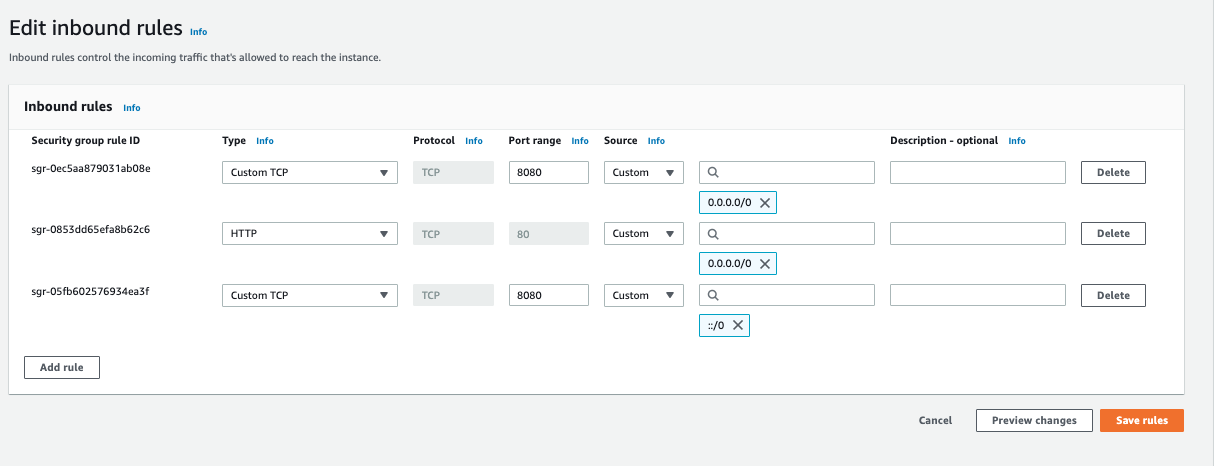
After clicking the security groups links, click the Edit Inbound Rules button.
Save your port as a custom TCP (use both the 0.0.0.0/0 and::/0 masks).
To see the final result of this process, copy your network’s public IP address and append your port to it. For instance, “3.227.247.95:8080.” When you visit this link, you should see your application up and running.
Monitoring logs in your ecs cluster with CloudWatch
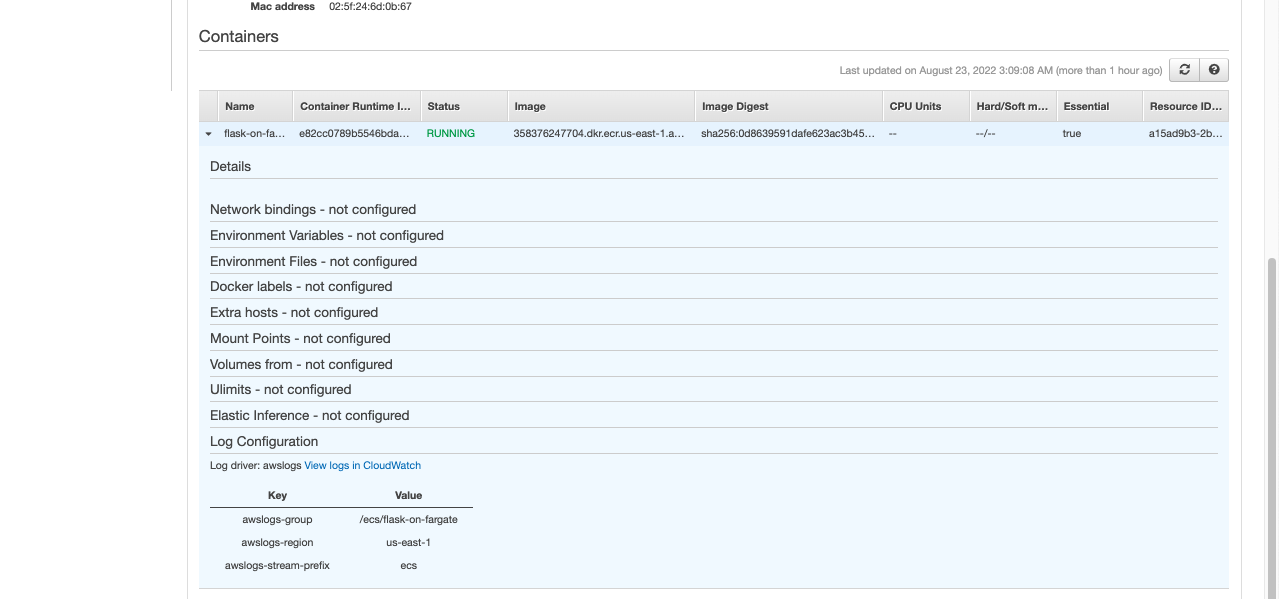
You can CloudWatch for real-time monitoring of Amazon infrastructure resources and applications. It collects metrics such as latency and request counts. For this tutorial, CloudWatch is used to manage and monitor logs. Keep in mind that the CloudWatch Container insights were also set up when your ECS cluster was being configured. To monitor logs in Cloudwatch, go to containers in your task overview and select “View logs in CloudWatch”.
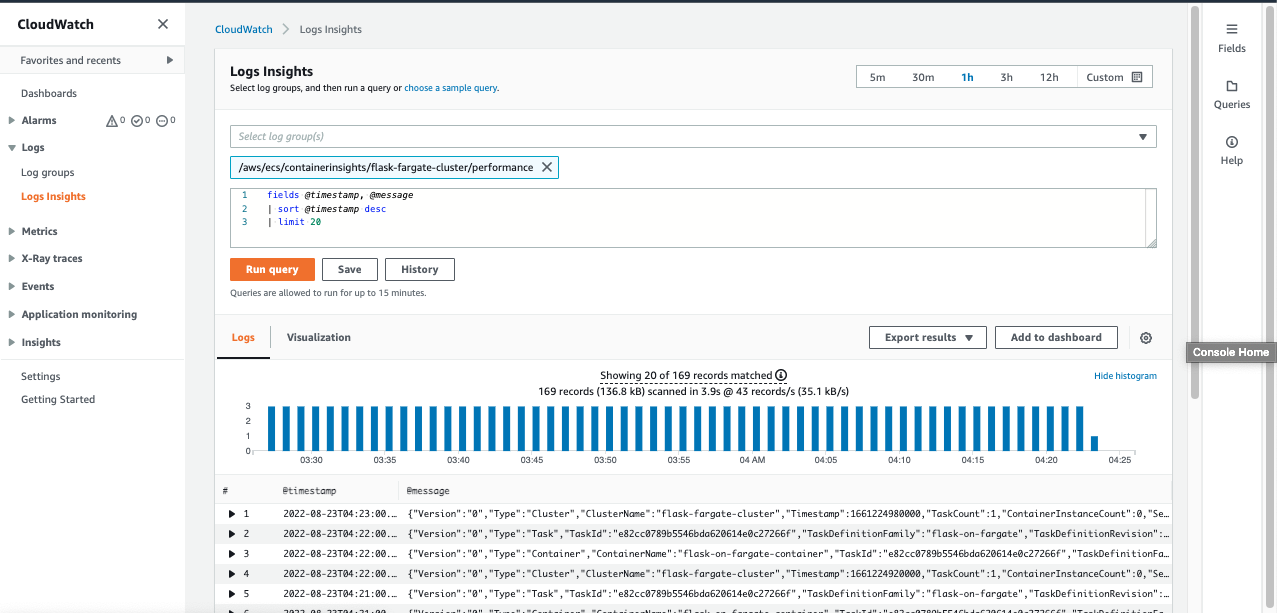
When you click the link above, you should see something similar to the image below. You can now start debugging and monitoring.
Running EKS with Fargate
Amazon Elastic Kubernetes Service (Amazon EKS) is a managed container service that allows you to manage and run Kubernetes on AWS without the need to set up a kubernetes service yourself. In this section of the tutorial, you’ll deploy a simple Python application on an EKS instance running Fargate. You’ll use the same simple application that you created earlier.
Prerequisites for EKS with Fargate
Like before, you’ll need an AWS account, Docker installed and running on your local development system, and AWS CLI. For this portion of the tutorial, you must be familiar with serverless technologies and Kubernetes. Before proceeding, you also need to have Kubernetes and eksctl and kubectl installed.
Configuring your EKS cluster
Search for AWS CloudShell and open it.
Create a service role, just as you did in the ECS example, but instead choose EKS as the use case.
Configure your AWS CLI using `aws configure`. Put in the access key ID and secret key of the previously created IAM user and enter your region.
In your Shell environment enter this command `eksctl create cluster --name YOUR-PREFERED-CLUSTER-NAME --fargate`. This command creates an EKS cluster and might take a while to load fully. It also creates the cluster with IAM Roles, VPC, Fargate profile and node, subnet, and a RouteTable.
You’ll be using the ECR repository, created above, which already has our docker image.
You’ll need to create a `deployment.yaml` (name it whatever you like, the one used for this tutorial is named `fargate-eks-deployment.yaml`) file, which will point to the app to deploy and the ECR repository. The file should contain this:
Run the following command to launch the above deployment:
kubectl create -f fargate-eks-deployment.yaml
To check the deployment list running on a cluster within the default namespace, you can run the following command:
kubectl get deployments
To check the pod list running on a cluster within the default namespace, you can run the following command:
kubectl get deployments
You need to create a Load Balancer service. The goal is to generate an external IP address that anyone can access rather than exposing secure components of your cluster. This service serves as a ruse.
So, create a new service and name it whatever you like e.g. `fargate-eks-service.yaml`. It should contain the following contents, and the name of the service should be your service name and the app as well. To create a new service:
Finally, the link under the EXTERNAL IP section is your successfully deployed service and can be used to access your Python application. When you run the link in your browser, you should see a list of news coming from the News API.
As with your ECS environment, you can also monitor EKS logs using Cloudwatch. So, go to your Cloudwatch dashboard and navigate into log groups to view and start monitoring the Fargate logs.
Benefits and disadvantages of logging Fargate with CloudWatch
AWS CloudWatch monitors your containers and applications to ensure that your system runs smoothly and flawlessly. It is useful for debugging your application, ensuring you have as little downtime as possible, and monitoring the performance of your system.
CloudWatch offers both free and paid plans. The paid plan includes different plans for the various CloudWatch functionalities, from as little as $0.50 per month.
There are a few disadvantages to collecting logs with Fargate, some of which include rising costs as your system scales, limited data retention, and static graphs.
Final thoughts
Fargate lets you focus on managing your container activities while it handles the underlying infrastructure of your project. Unlike EC2, you don’t need to deploy and manage your EC2 instances. Monitoring contributes to high performance, dependability, and availability. Collecting logs will help with system debugging and ensuring that everything works properly.
You can monitor, store, and retrieve log files with AWS CloudWatch, but you must specify the awslogs drive in your task definitions to configure it. It includes a set of tools for monitoring and troubleshooting AWS Fargate containers. It collects everything logged by your ephemeral Fargate pods. The platform simplifies monitoring the health of your cluster using metrics like logs, events, latencies, and traces.
If you're looking for a maintenance-free solution to build a dashboard for monitoring the health of your cluster, then try out Airplane. Airplane is the developer platform for building internal tools. With Airplane, you get powerful built-ins like audit logs, job scheduling, templates, and more that make it simple to get started and build custom workflows and UIs. Airplane's engineering workflows solution can streamline your most critical engineering use cases.
Sign up for a free account or book a demo to get started.