Launched by AWS in 2017, Fargate, which enables organizations to run containers without managing the infrastructure, has risen in popularity.
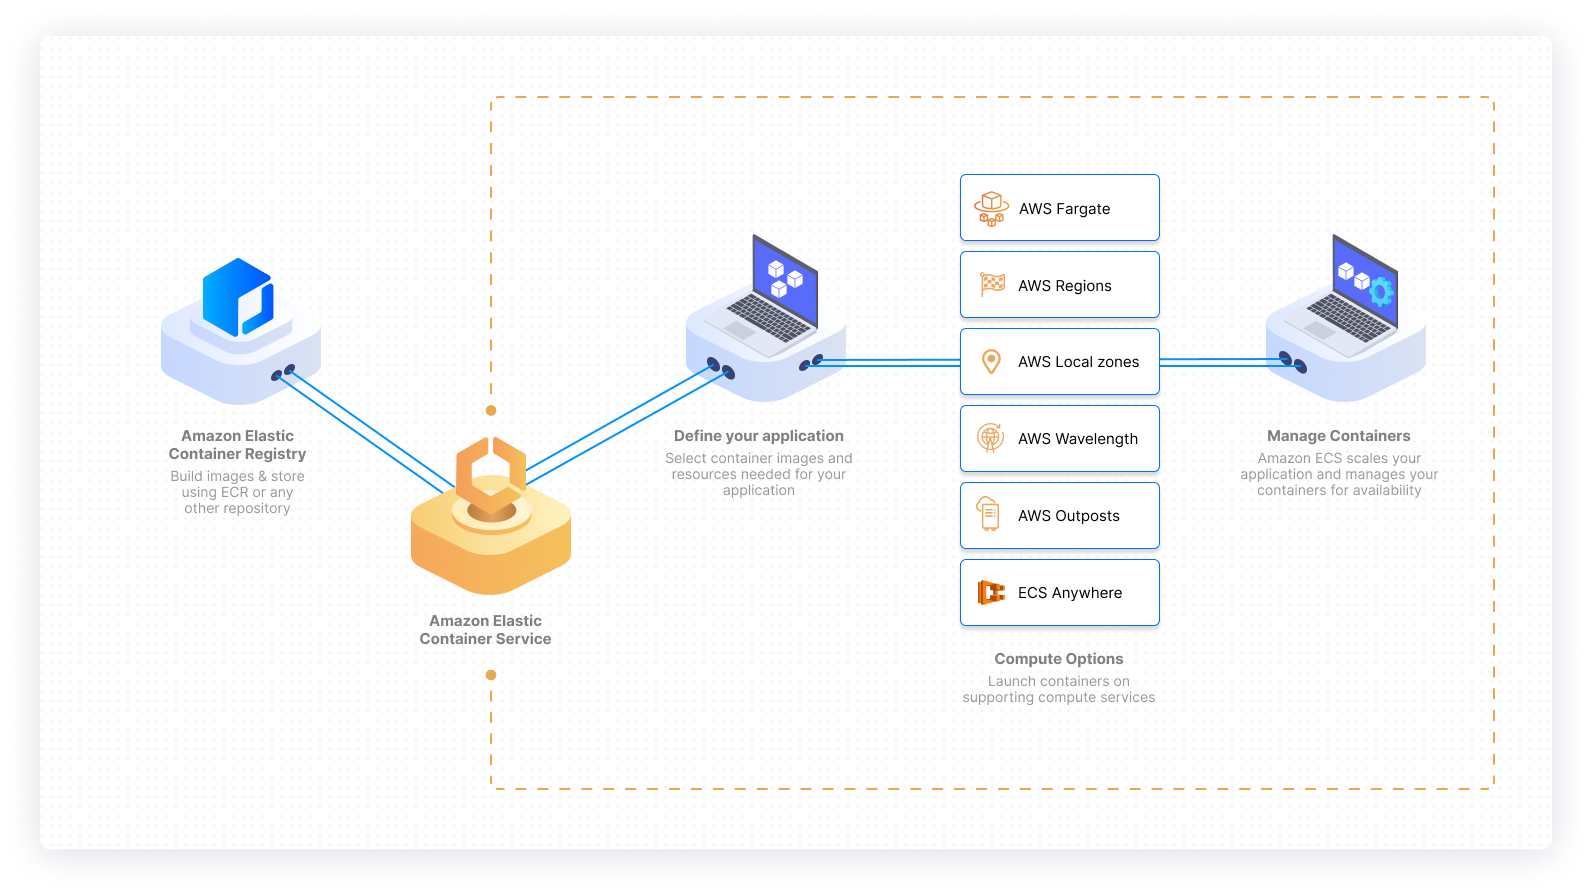
When Fargate was released, cloud providers and open-source communities were all positioning themselves in a fragmented container orchestration market. In 2017, it wasn’t yet clear that Kubernetes would become the default container orchestration system for most organizations. Fargate was originally launched to make Amazon ECS, or Amazon Elastic Container Service, easier to deploy, manage, and scale by removing the need for users to manage individual EC2 instances, and to use containers as a basic compute building block.
In 2022, AWS customers can use both ECS and Amazon Elastic Kubernetes Service (EKS), with Fargate. While running ECS and/or EKS with Fargate has a number of benefits, monitoring and observability is still a challenge.
In this article, we’ll explain the concept of Fargate in a little more detail, and then we’ll focus on best practices and tools you can use to effectively monitor your workloads running with Fargate. In addition, we will briefly explore the toolset provided by Amazon by default.
What is Fargate?
AWS Fargate is a serverless, pay-as-you-go, compute engine for containers that rely on either ECS or EKS for container orchestration.
Companies use Fargate with ECS or EKS because it reduces the operational difficulty of managing workloads on containers at scale. And for many companies, using Fargate might lead to cost savings and resource efficiency, compared with using EC2 instances.
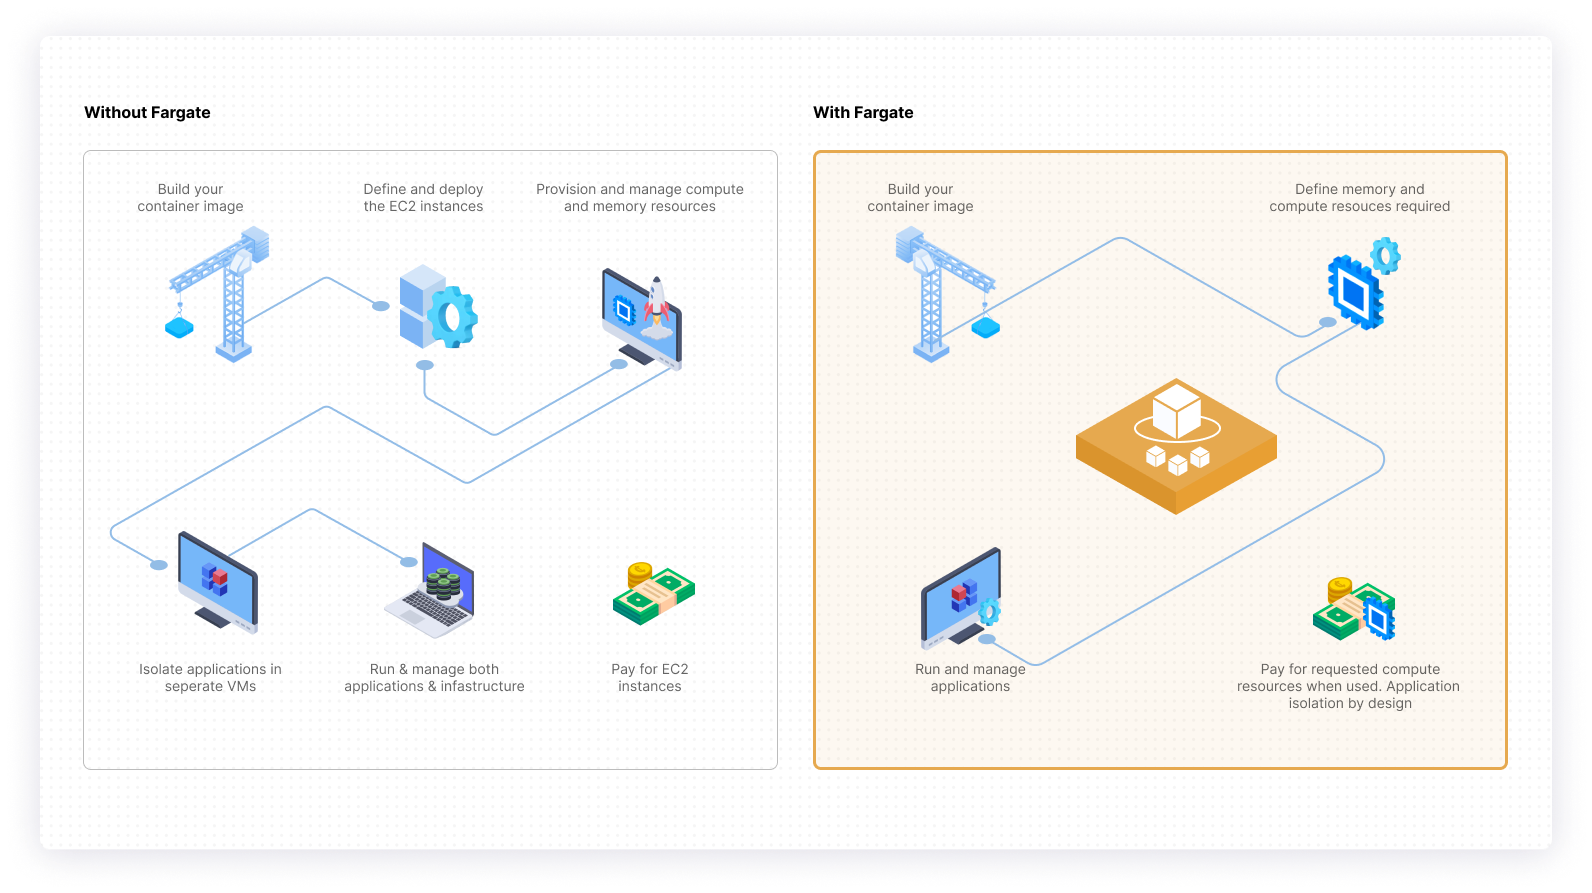
Fargate makes the process simpler for the user by reducing the amount of time spent configuring the infrastructure that hosts their containers. With Fargate, users simply need to define which images they would like to run, along with some basic specifications for compute and memory, and then Fargate will automatically provision the host servers.
Running Fargate with ECS
There are many reasons that organizations choose to use ECS for their workloads. And when ECS is paired with Fargate, many of the challenges of running containers are reduced.
According to the AWS Fargate documentation, users are able to choose from the following operating systems:
- Amazon Linux 2
- Windows Server 2019 Full
- Windows Server 2019 Core
Users are able to pick one of two architectures: ARM64 or X86_64. Companies using Windows containers must use the X86_64 CPU architecture. And those using Linux containers have the choice of using the X86_64 CPU or the ARM64 architecture.
When using ECS with Fargate, you must select CPU and memory values at the task level. And you are able to set these values at the container level, too, if necessary. This table shows the different combinations of task-level CPU and memory:
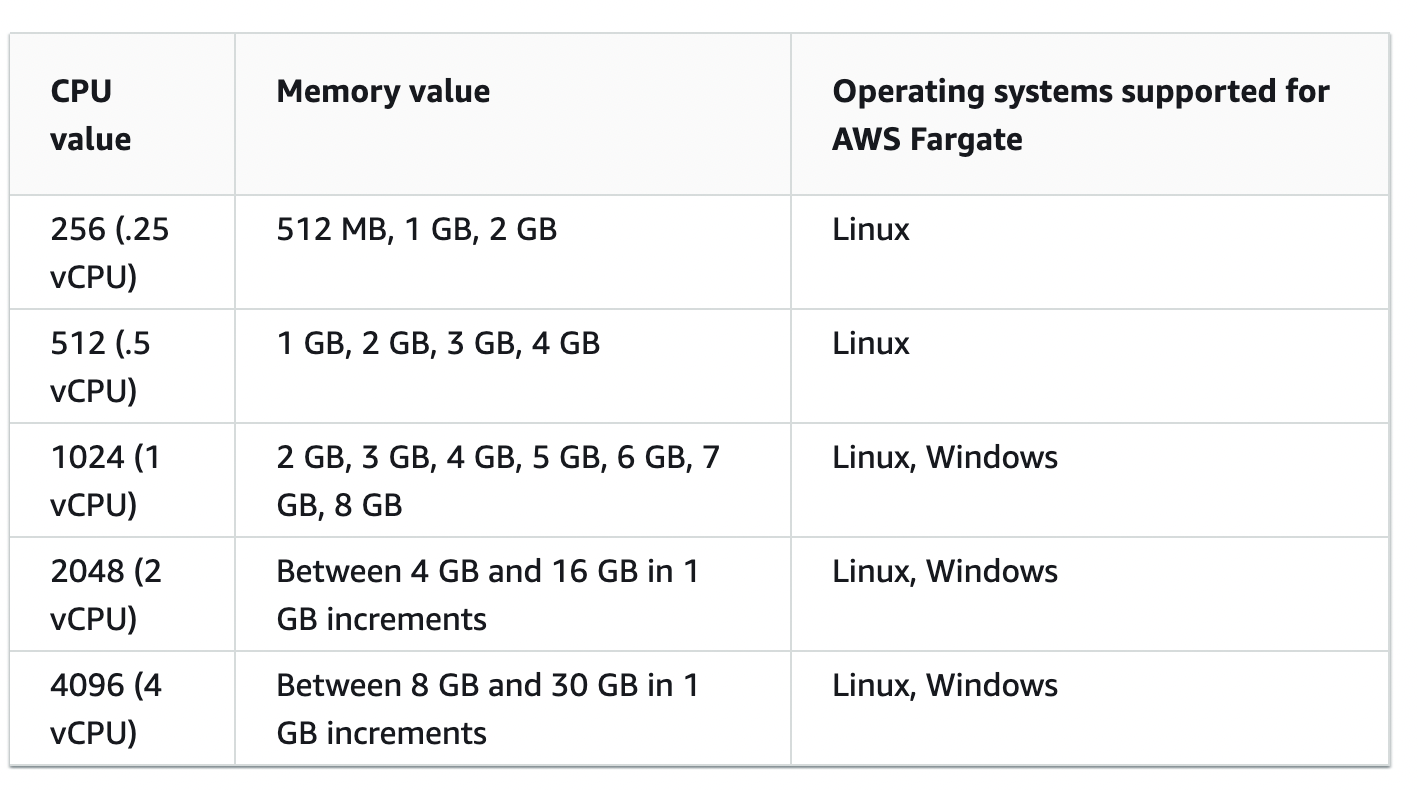
And with Amazon ECS, users are able to choose between using regular AWS Fargate and using Fargate Spot for running their tasks. If tasks are interruption tolerant, using Fargate Spot to run them may lead to cost savings because they are running on excess compute capacity.
Running Fargate with EKS
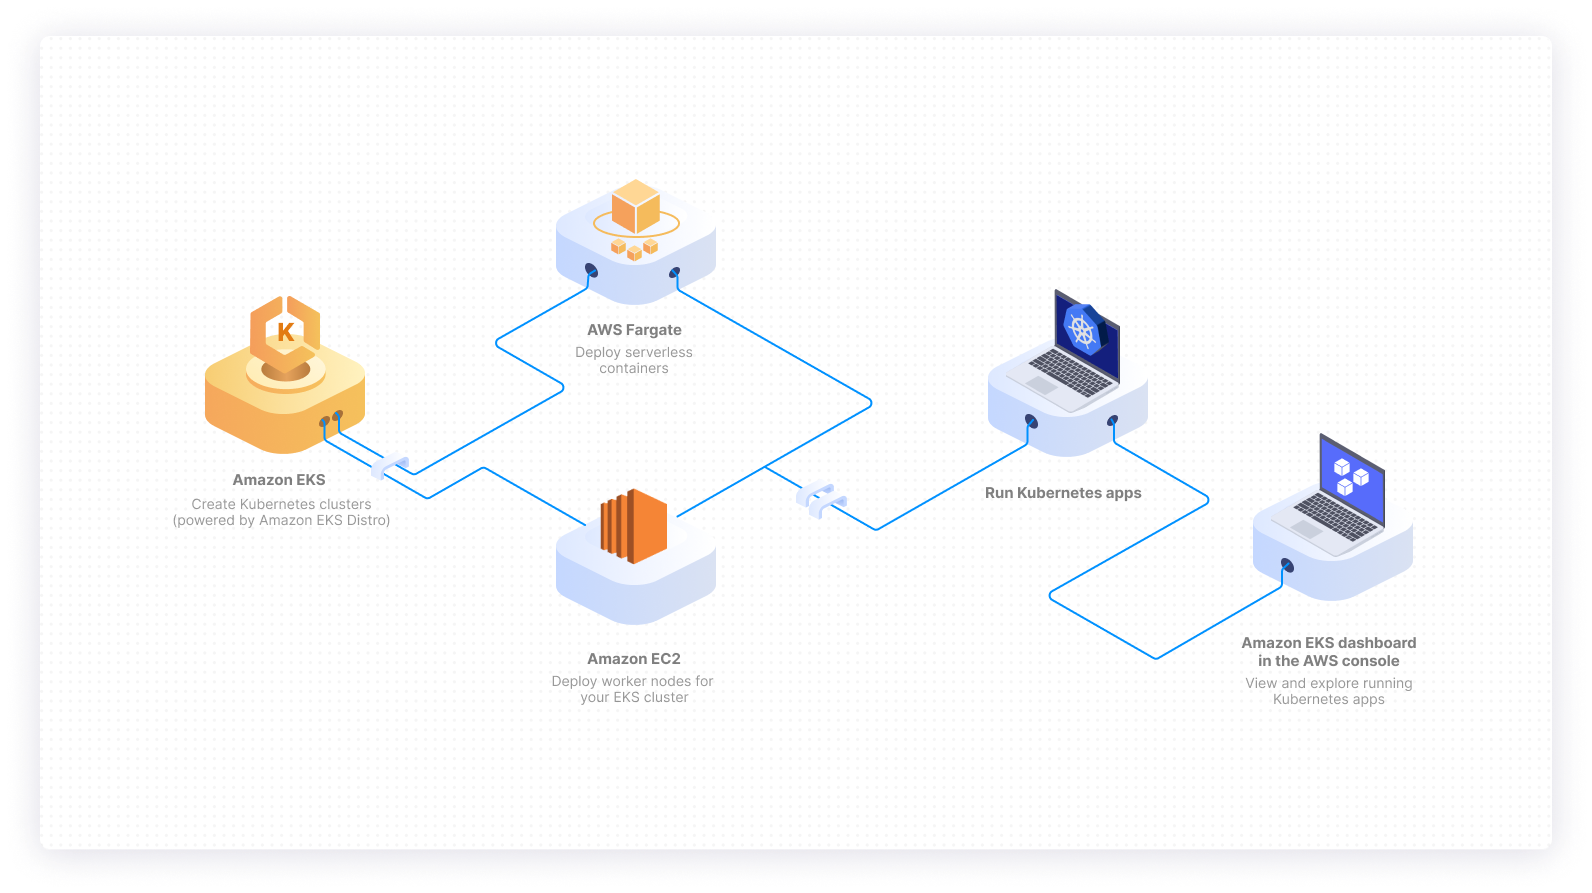
Amazon Elastic Kubernetes Service, or EKS, is a great option for companies looking to leverage Kubernetes while reducing the operational overhead of doing so. Similar to when you’re using tasks with ECS, when you’re using EKS on Fargate, each pod that runs on Fargate has its own isolated boundary for resources.
Fortunately, AWS Fargate offers EKS in all Amazon EKS regions except China (Beijing), China (Ningxia), AWS GovCloud (US-East), and AWS GovCloud (US-West).
There are, however, a few differences between running EKS with Fargate and running EKS without Fargate. And many of these differences can impact how teams think about monitoring and observability. Here are a few important differences that impact observability:
- Users are unable to use Daemonset with Fargate; instead, Daemons must be run as a sidecar container to pods.
- Fargate does not support privileged containers.
- Because Fargate uses a one-to-one ratio of pods to nodes, tools that charge per host or per node may be more expensive.
- Less control over the exact amount of resources used by each Fargate task.
- Exporting logs to external services is more cumbersome than in traditional environments. The ability to export logs from stdout is a relatively new addition to Fargate and not without the occasional bug.
The basic AWS Fargate pricing applies here. And unfortunately, unlike with ECS, users do not have the ability to use spot instances.
What should you monitor?
Knowing what to monitor and log, and which pieces of data to collect, are as important as the tooling you are using. It’s important to monitor underlying usage metrics (like CPU and memory), logs, individual requests via tracing, latency, status codes, events, and more.
- Metrics: CPU and memory
- Logs: Application and cluster level logs
- Traces: Individual requests, status codes, and payloads
- Latency: p95, p99, and average latency for microservices, individual paths, and requests
- Status Codes: Track problematic or abnormal status codes, like 500 errors
- Events: Status Changes, Backoffs, Evictions
- Custom Metrics: Metrics that drive business performance, or end-user experience
Using Amazon CloudWatch to monitor Fargate
Amazon CloudWatch is the monitoring and observability toolset offered by Amazon by default. CloudWatch is a popular starting point with logs, metrics, events, and alerts. For companies running workloads on Fargate, CloudWatch provides core features for monitoring both ECS and EKS with Fargate. Pricing is based on usage, and depending on the volume of metrics, logs, and traces, it can be highly variable.
CloudWatch offerings for ECS with Fargate
Using CloudWatch is a great starting point for making sure that your tasks are running properly. CloudWatch is a paid service, and pricing is based on usage.
- CloudWatch ECS Metrics: When ECS is used with Fargate, CloudWatch CPU and memory metrics are enabled by default. Metrics are recorded and delivered in near real-time and are stored for a period of two weeks. Data is collected and aggregated on a minute-by-minute basis for each task and can be viewed by using the navigation panel metrics in CloudWatch.
- CloudWatch Container Insights: Enabling Container Insights is relatively straightforward via the ECS console or through the AWS CLI. Container Insight provides supplementary data, including diagnostic information like container restarts, which can be helpful when debugging. Container Insights are charged as custom metrics.
- CloudWatch + AWS Distro for OpenTelemetry: Setup is simple with one-click integration. By instrumenting their application, users are able to use OpenTelemetry to collect metrics and trace information, using Amazon ECR as a sidecar container. It is common to use an additional tool, like Grafana, for visualization.
- Cloudwatch logs: Users are able to use the awslogs log driver to send logs to CloudWatch logs. With this service, users are able to aggregate and store all types of logs from applications, services, and AWS. Users are able to search and filter easily. And logs are retained indefinitely by default, but storage can be customized to any time period, ranging from 24 hours to 10 years.
CloudWatch offerings for EKS with Fargate
By using CloudWatch, users are able to make sure that their pods and workloads are running properly.
- CloudWatch Fargate Metrics: Unfortunately, when EKS is used with Fargate, CloudWatch is unable to display workload metrics. Instead, users must opt for a third-party collection tool like Prometheus, a popular open-source solution, or a tool like Datadog, a Kubernetes native solution.
- CloudWatch Container Insights: Note that by default AWS Container Insights does not support data collection for EKS clusters running on Fargate. Instead, users must use ADOT, the AWS-supported distribution of the OpenTelemetry project, to collect and ship metrics as a sidecar container. Users are then able to view container metrics like CPU, memory, and disk space.
- AWS Distro for OpenTelemetry: As of this writing, users are able to use ADOT to collect and correlate traces. Metrics support is currently in preview, and logging support is currently in alpha.
- Fargate Logging: Based on Fluent Bit, the built-in log router allows you to collect and ship logs wherever you’d like including CloudWatch. Using CloudWatch, users are able to collect and store large volumes of logs.
CloudWatch pricing table
Below is a summary of CloudWatch’s metrics and log pricing (US East, Ohio).
CloudWatch metrics
| Tier | Cost (metric/month) |
|---|---|
| First 10,000 metrics | $0.30 |
| Next 240,000 metrics | $0.10 |
| Next 750,000 metrics | $0.05 |
| Over 1,000,000 metrics | $0.02 |
CloudWatch logs
| Service | Cost (metric/month) |
|---|---|
| Collect (Data Ingestion) | $0.50 per GB |
| Store (Archival) | $0.03 per GB |
| Analyze (Log Insights queries) | $0.005 per GB of data scanned |
Alternative tools for monitoring ECS with Fargate
While Amazon Cloudwatch offers some functionality for organizations monitoring workloads running on ECS with Fargate, it often makes sense to implement additional tooling for deeper insight. In this section of the article, we will quickly highlight five popular tools that companies are using to monitor ECS with Fargate.
- Datadog: Offers a toolset for collecting metrics and ECS logs, and provides visualization.
- Dynatrace: Users can monitor metrics, create alerts, and view data visually.
- Elastic: Visualize metrics, logs, and more, using the popular Elastic console.
- Grafana Cloud: A cloud version of the popular open-source data visualization tool.
- New Relic: A legacy provider of application performance monitoring, New Relic is able to support organizations both large and small.
Final thoughts
Fargate makes it easy for teams to manage and scale. And whether you’re using ECS or EKS with Fargate, it is important to have the right tools in place. Monitoring core infrastructure metrics, application metrics, as well as logs, and individual requests are important for avoiding business disruption and providing end-users the service they expect. And by using traces alongside metrics and logs, engineering teams are able to debug issues faster without having to jump between multiple tools.
CloudWatch, the AWS default monitoring toolset, provides a number of features for users using ECS and for those using Fargate. And in 2022, AWS’s support of OpenTelemetry through ADOT has allowed teams to do even more without leaving AWS CloudWatch.
If you're looking to build a dashboard that makes it easy to monitor your application metrics in real-time, then consider using Airplane. Airplane is the developer platform for building internal tools. The basic building blocks of Airplane are Tasks, which are functions that anyone on your team can use. Airplane Views allows users to quickly build React-based UIs. Airplane also offers a template library and pre-built component library, making it easy to get started.
To test it out and build your first Task or View, sign up for a free account or book a demo.