


Just last year, 91% of organizations polled by the Cloud Native Computing Foundation (CNCF) said they were using Kubernetes in some form, according to our Kubernetes statistics. Today’s microservices depend upon capable management layers for effective deployment and scaling. Accordingly, DevOps teams are weaving quite the tangled web—commonly maintaining hundreds of containers within their environments. Teams can’t simply cross their fingers and fly blindly with such complex setups. Observability has always been critical in understanding how containerized applications tick.
Thankfully, Kubernetes events help paint a performative picture of your clusters. These objects allow you to see how Kubernetes resource decisions are made. Teams seeking greater transparency should leverage these in an analytical manner. In this guide, I’ll share the ins and outs of Kubernetes events and explain their importance in container orchestration and observability.
Provisioning and state in Kubernetes
To understand events, you have to have a bit of context about how Kubernetes allocates resources and spins up containers in a running application.
As you might imagine, applications don’t always run in a steady state. User activity fluctuates based on day, time, or specific events. CPU demands vary, as do memory and networking requirements during runtime. It’s up to the Kubernetes scheduler to divvy up compute or memory resources depending on your application’s changing needs. This is why Kubernetes might terminate a node or kill individual pods associated with specific applications. These runtime resources will then be allocated to other applications or suspended until they’re needed.
This reallocation can happen purposefully or unexpectedly. Sudden performance fluctuations can lead to node failures (or disappearances) within a cluster—or other disruptions stemming from pod evictions, kernel panics, or VM deletions.
Responding effectively to these events is critical. However, understanding how and why specific applications are exhibiting such behaviors is equally important. K8s event objects can help offer some context, so let’s explore how they come into play.
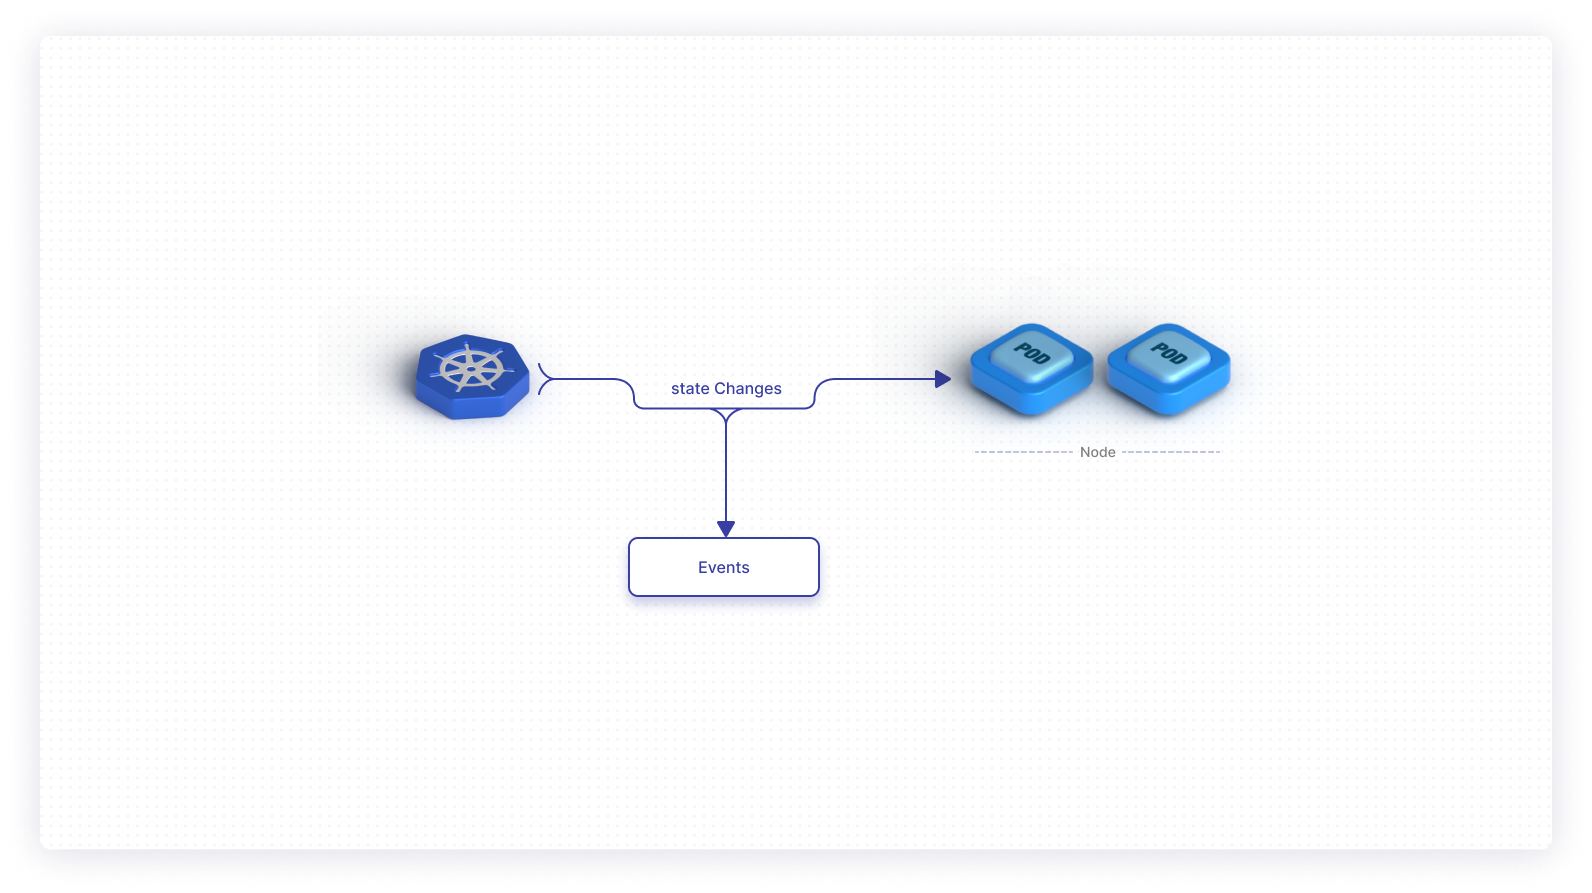
The basics of Kubernetes events
An event in Kubernetes is an object in the framework that is automatically generated in response to changes with other resources—like nodes, pods, or containers.
State changes lie at the center of this. For example, phases across a pod’s lifecycle—like a transition from pending to running, or statuses like successful or failed may trigger a K8s event. The same goes for reallocations and scheduling, as I previously touched on.
Events are effectively the breadcrumbs of the K8s realm. They give you valuable insight into how your infrastructure is running while providing context for any troubling behaviors. This is why events are often useful for debugging.
Unfortunately, event logging in Kubernetes isn’t perfect.
Since event objects aren’t considered regular log events, they’re not included by default within the Kubernetes logs. Additionally, events might not show up as anticipated in response to certain behaviors—like container start failures stemming from faulty images (ex. ImagePullBackoff). You might expect an event to be visible on certain resources (ReplicaSet, StatefulSet, etc.), yet they’ll be vaguely visible on the pod itself, instead. Administrators must therefore work a little harder to view them. Team members can manually pull this data when needed to perform debugging.
Kubernetes event classifications
Naturally, there are numerous kinds of events that may have relevance within your Kubernetes deployment. A number of snags can occur when Kubernetes or your cloud platform perform core operations. Let’s jump into each major event type.
Failed events
While containers are created fairly often, that operation can often fail; accordingly, Kubernetes does not successfully create that container. This is commonly tied to image retrieval errors. After all, It’s impossible to form a container without its required software packages and dependencies. Docker is the most common container runtime paired with K8s. Typos, insufficient permissions, and upstream build failures may cause these failures. Because a fail is show-stopping—meaning your container won’t run before it’s resolved—you’ll want to pay special attention to this event type. Live applications depending on these faulty containers will run into lots of problems.
Furthermore, nodes themselves can fail. Applications should fall back to functional, remaining nodes when these failures occur, but it’s necessary to understand why the failure happened by polling the system.
Evicted events
Evicted events are fairly common because Kubernetes can dive into a working node and terminate its various pods. Certain pods can hog computing-and-memory resources or may consume a disproportionate amount relative to their respective runtimes. Kubernetes solves this problem by evicting pods and allocating disk, memory, or CPU space elsewhere.
That’s not always a problem, but you should understand why it’s happening. Many DevOps teams fail to place proper limitations on their pods—and therefore fail to restrict resource consumption at the container level. Without defined requests or limits parameters, consumption can spiral out of control.
Evicted events can shine a light on these suboptimal configurations, which can easily be lost in the shuffle while hundreds of containers run concurrently. Eviction events can also tell you when pods are misallocated to new nodes.
Storage-specific events
Applications and workloads commonly rely on cloud storage within pods. As with anything network-related, K8s pods can fail to connect with resources supplied by the likes of Docker, AWS, or GCP. Volumes provided via awsElasticBlockStore, azureDisk, or cephfs (to name a few) store critical contents which support application runtimes. Pods mount these volumes upon creation—paving the way for successful operation.
Unfortunately, you might encounter two common errors: FailedMount and FailedAttachVolume. It’s not unusual for a given host to be unavailable or for a volume to be attached exclusively to one node. These events can tell you when EBS volumes are acting up. Additionally, a node might not be healthy enough to mount a volume.
These errors are tricky though, as they might seem like a pod is just starting slowly. However, uncovering these two events can help you solve the underlying issues stemming from faulty volume mounting.
Kubernetes scheduling events
I’ve discussed how subpar resource management can wreak havoc on a containerized system. Prolonged neglect can lead to provisioning lockup—thus preventing new pods from popping up as needed.
Dubbed a FailedScheduling event, this occurs when the Kubernetes scheduler cannot locate a suitable node. Thankfully, this event is pretty descriptive in its presentation. Logged messages explain exactly why new nodes aren’t given their requisite resources. Insufficient memory or CPU can also trigger this event. You can solve these problems by using the scale command.
Node-specific events
Finally, events at the node can point to erratic or unhealthy behavior somewhere within the system. First, the NodeNotReady event signifies a node that’s unprepared for pod scheduling. Conversely, a healthy node would be described as “ready,” whereas an “unknown” node cannot be polled for status or response time.
Meanwhile, a Rebooted event is straightforward in its meaning. Due to specific actions or unforeseen crashes, a node may have to be restarted. It’s worth noting the Rebooted event and investigating why the restart took place.
Finally, the HostPortConflict event is triggered when a cluster becomes unreachable. This might mean that the selected nodePort is incorrect. Additionally, DaemonSets might conflict with hostPorts and cause this issue.
Filtering and monitoring events
While Kubernetes events are useful, it’s important to remember that not all events are mission-critical. Like a confirmation message, many of these can simply apply to systems that are functioning as designed or anticipated. K8s will denote these as Normal.
Accordingly, all events are assigned a type—Normal, Information, or Warning. For typical clusters, Normal events are just noise; they don’t reveal anything inherently valuable during troubleshooting. Events are also assigned a brief Reason (why this event was triggered), an Age, a From (or origin), and a Message providing greater context. These are essentially the “attributes” or fields relevant to all events. They also provide a means for filtering certain events from a larger set.
Filtering is pretty simple. Within kubectl, you can enter the following to filter out normal events:
Since you’re using kubectl, these events can be pulled from Kubernetes component logs or from an integrated, third-party logging tool. The latter is common since K8s events aren’t typically stored in the default Kubernetes log. Teams often use a helper pod to facilitate access. This outlet allows for event monitoring over prolonged periods of time.
You can also use third-party tools to help with tracking and visualizing Kubernetes events. Some tools also offer Kubernetes event-driven alerting—adding real-time remediation benefits. Don’t forget to be choosy about your alerts. Superfluous alerting can crowd out emergency events when they do occur.
Accessing events in Kubernetes
You can use the kubectl get events command, which leverages the resources API to display recent events across the entire system. You can output this data in JSON by using the following command:
This overview is interesting, though it likely doesn’t offer a ton of value in a troubleshooting scenario. Many of those component events won’t have relevance to you depending on what you’re looking for.
This is where using --field-selector to filter your events will help immensely—with the involvedObject.kind string tacked on, followed by something like node or pod. Additionally, you may pull events for a specific object via the involvedObject.name command.
What if you want to summon events for a specific pod? Simply enter the following command:
This command will pull up recent events for a single pod so you can troubleshoot any issues or see when it was last provisioned. Here’s an example of this command on a single pod deployment running on minikube:
Final thoughts
In this piece, you’ve learned why Kubernetes events are vital for troubleshooting within your application. Whether gathered in retrospect or real-time, both third-party tools and kubectl can help you find and sort events. Events aren’t something to be ignored, and because they’re so easy to harness, you shouldn’t hesitate to incorporate them into your cluster maintenance routines.
If you'd like to build a custom dashboard to help monitor your Kubernetes events and make troubleshooting easier, you should use Airplane. Airplane is the developer platform for building custom internal tools. Users can transform scripts, queries, APIs, and more into powerful UIs and workflows using code.
The basic building blocks of Airplane are Tasks, which are functions that anyone on your team can use. Airplane also offers Views, a React-based platform that allows users to quickly build custom UIs. You can create robust internal tools quickly and can use Airplane to support your engineering workflows.
You can get started for free or book a demo to see just how quickly you can build a monitoring dashboard to help you streamline your troubleshooting process.


