
Monitoring is a crucial part of software development, as it helps you keep an eye on performance and resources. Without active monitoring, you’re in the dark, and your apps could go down anytime without your knowledge. This is where tools like Prometheus help. Prometheus is an open-source observability solution that tracks key metrics and gives you visibility into your apps.
However, Prometheus can not automatically connect with all types of apps and resources. In some cases, you need an adapter to translate the metrics that a resource generates into a format that Prometheus can easily understand. Prometheus exporters do just this.
This guide will show you how you can use the prometheus-nginx-exporter tool to connect an NGINX server to Prometheus.
What is the NGINX Prometheus exporter?
NGINX is one of the most popular web servers used today, and the NGINX Promtheus exporter is a tool you can use to export metrics from your NGINX server and capture them in your Prometheus instance. While NGINX exposes a basic set of metrics via its stub status module, those metrics are not in a form that Prometheus can scrape. This is where prometheus-nginx-exporter helps. It listens to the stub_status endpoint and generates a feed of Prometheus-friendly metrics on an endpoint. You can then configure your Prometheus instance to scrape data from this endpoint and use it to track and analyze the performance of your NGINX server.
How to use the NGINX Prometheus exporter
To set up NGINX monitoring using Prometheus, you’ll need the following:
- An NGINX server
- A Prometheus instance
- The prometheus-nginx-exporter
To start, update your NGINX server’s config file to enable the /metrics endpoint by adding the following to your nginx.conf file:
Visit the /metrics route on your NGINX server to see whether metrics have been exposed. You should see a result like this:
Next, install the exporter in a Docker container by running the following command:
Once the exporter is up, you’ll be able to access the following page: http:<your machine ip>:9113/metrics, and see a page with detailed metrics from your NGINX server.
Next, set up your Prometheus instance to scrape data from the exporter. You can do this by updating your prometheus.yaml file to include the following:
Once everything is set up correctly, you’ll be able to see the NGINX-related metrics in your PromQL autofill suggestions:
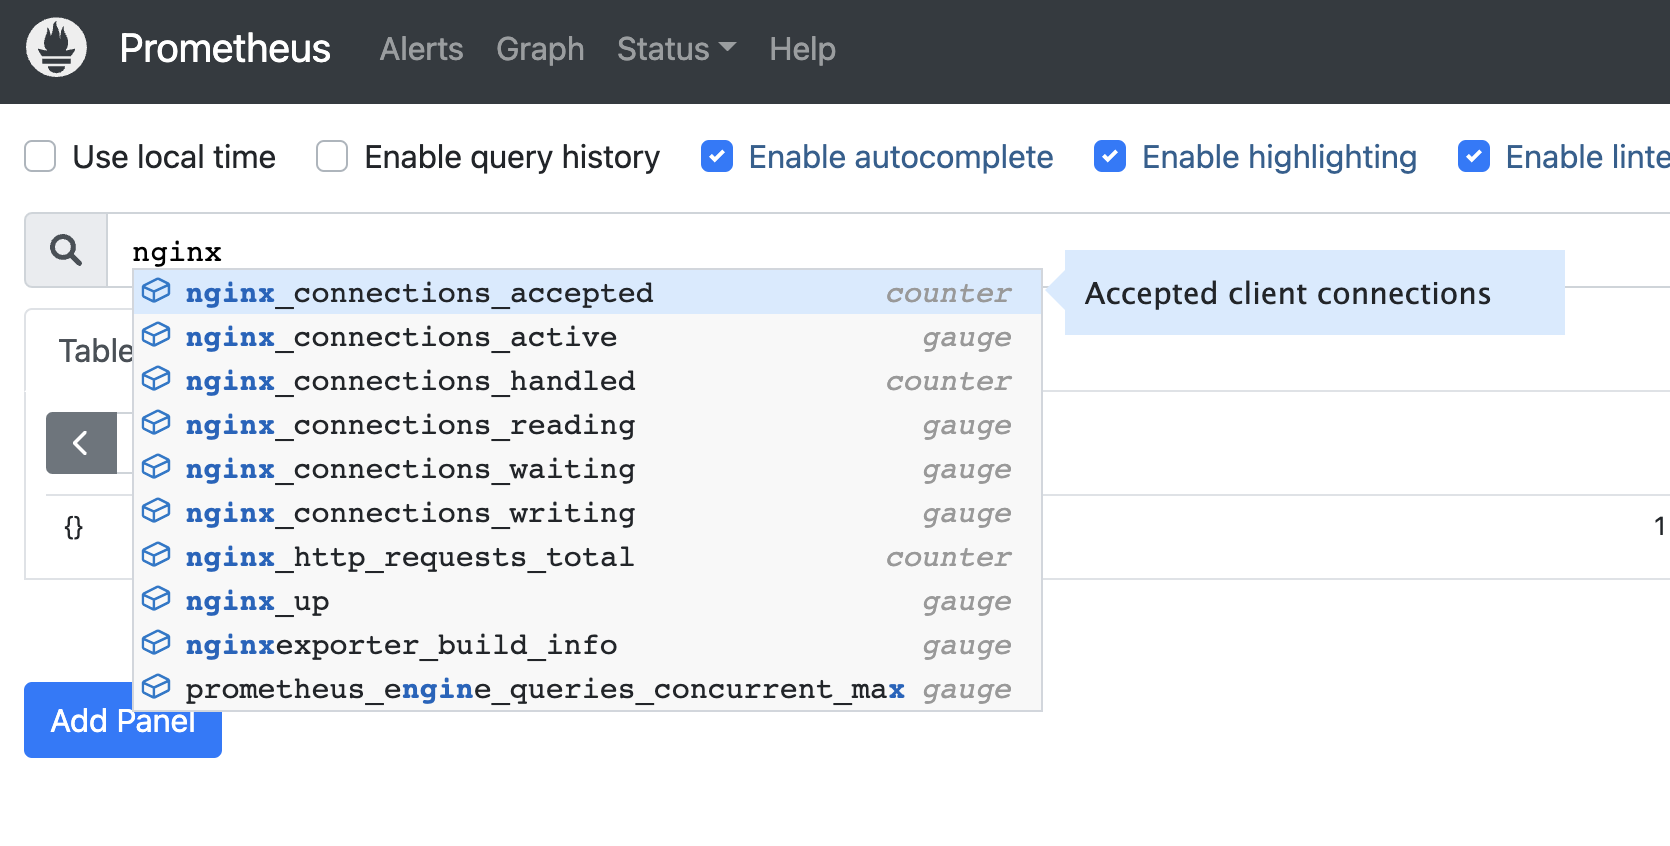
You can now use these metrics in PromQL queries to monitor your NGINX server and draw visualizations using other tools, such as Grafana.
Final thoughts
Prometheus is an all-around, open-source monitoring solution. However, it needs some extra configuration to work with external tools and services. In this guide, you saw how you can export metrics from your NGINX server and capture them in Prometheus using NGINX Prometheus exporter.
If you're looking for a platform to help you with your internal tooling needs, check out Airplane. With Airplane, you can transform scripts, queries, APIs, and more into production-grade workflows and UIs within minutes. Use Airplane to build admin panels, incident command centers, deployment pipelines, and more.
To check it out, sign up for a free account or book a demo.