


Prometheus, a popular open-source project, is used by thousands of organizations as a time-series database and monitoring system. Prometheus has a number of benefits including a large number of integrations, efficient storage, powerful alerting with Alertmanager, as well as the ability to run queries using PromQL.
While Prometheus does have some visualization capabilities, it is most often paired with another tool for visualization, like Grafana. Grafana, originally launched as an open-source project, is a popular visualization toolset and a popular integration with Prometheus.
Both of these tools have their own set of benefits, use cases, and capabilities. And for companies using Kubernetes, the leading container orchestration system, it makes a lot of sense to use these tools together.
In this article, we highlight both Prometheus and Grafana as tools to monitor workloads running on Kubernetes. We start by highlighting the setup and implementation process for each tool and then finish by discussing best practices for using these tools together.

Getting started with Grafana
Grafana is an open-source data visualization tool that helps users understand complex data through some great visualization. It comes with capabilities to query, visualize, and alert on metrics from different data sources, such as Prometheus (which I’ll discuss more in-depth later in this article), MySQL, MSSQL, PostgreSQL, InfluxDB, Graphite, and Elasticsearch. Grafana can also pull data from cloud-hosted services like AWS CloudWatch, Google Cloud Monitoring, and Azure Monitor.
Running Grafana on your local machine is as easy as executing a docker run command or running the helm install grafana bitnami/grafana Helm command. For example, you can use the following docker run command to start Grafana on your local:
Verify that the Grafana container image is running using the docker ps command.
$ docker ps
| Container ID | Image | Command | Created | Status | Ports | Name |
|---|---|---|---|---|---|---|
| fcbd1815b4a4 | grafana/grafana | "/run.sh" | 3 minutes ago | Up 3 minutes | 0.0.0.0:3000->3000/tcp | dreamy_brattain |
Now browse the URL http://localhost:3000 and you will be redirected to the Grafana login page.

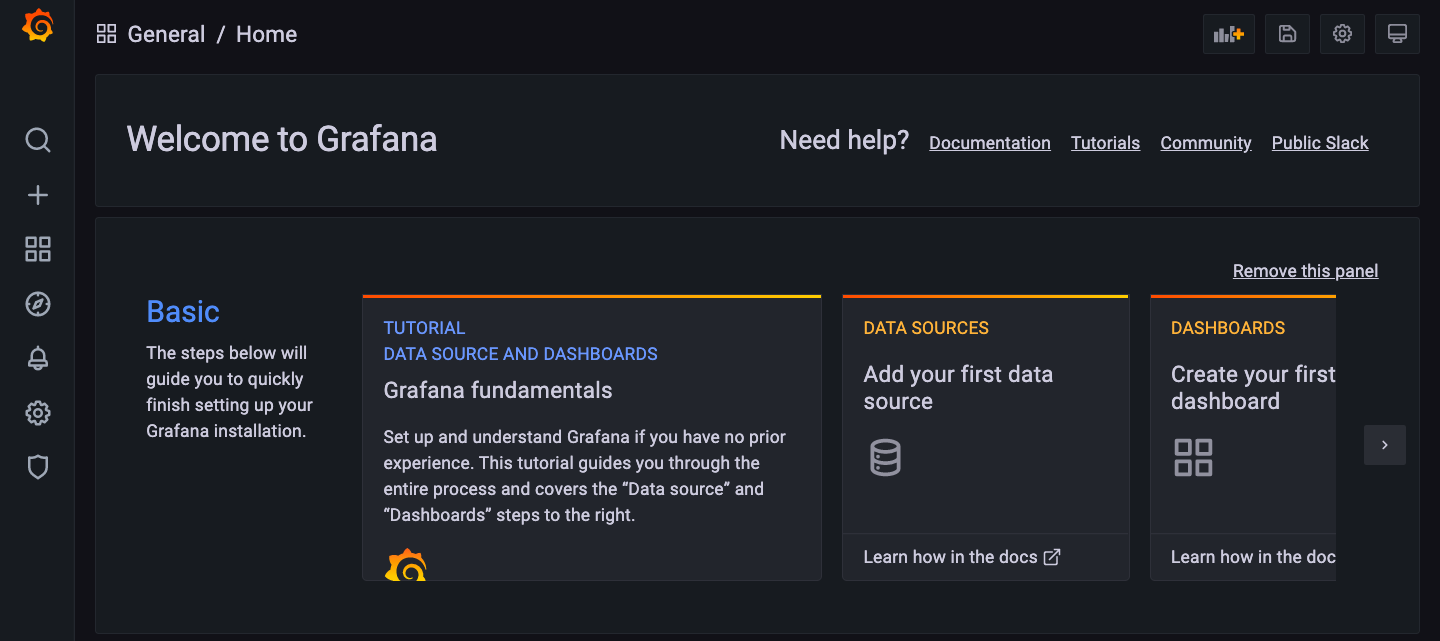
Enter default credentials admin/admin, and you will see the following screen with options given to create dashboard and data sources.
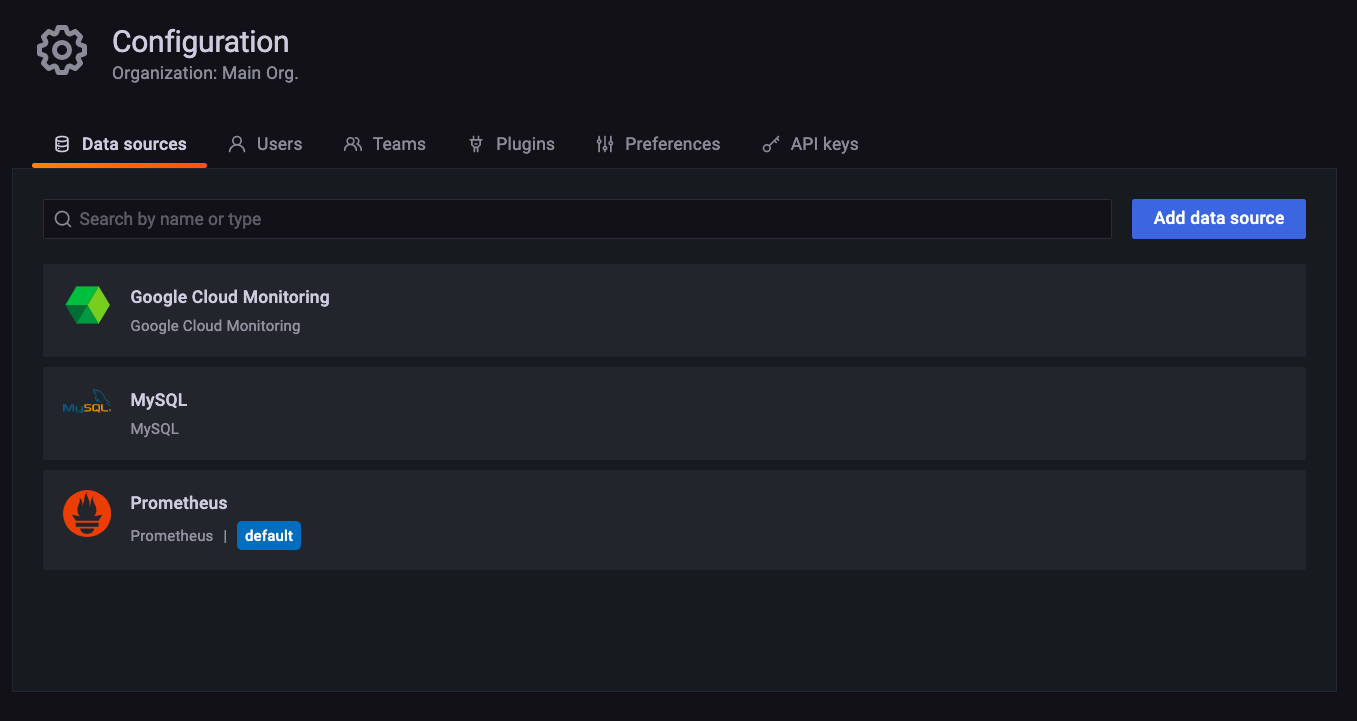
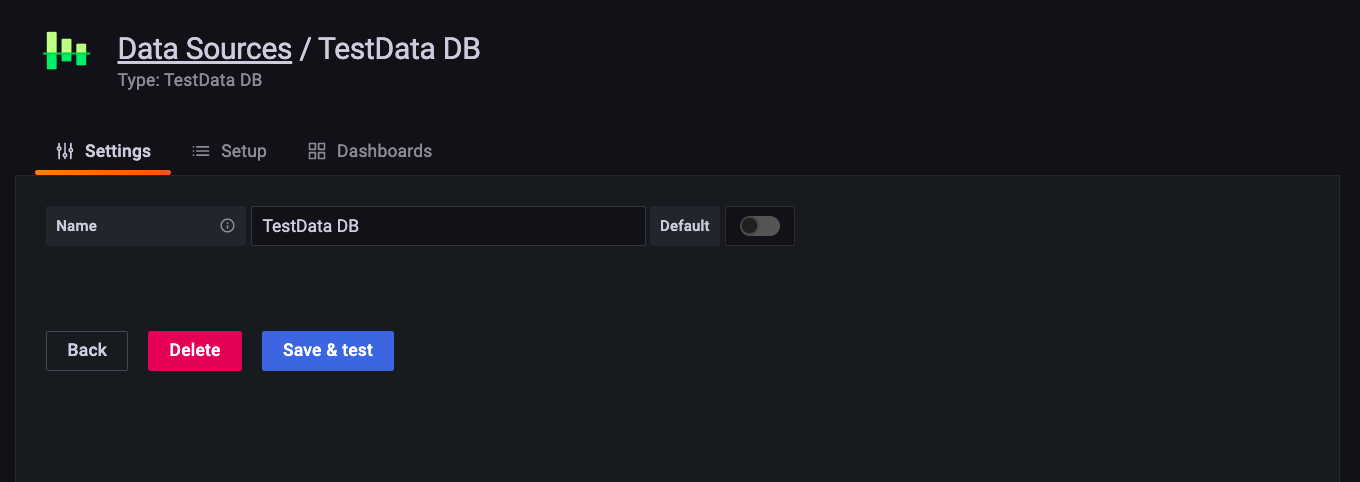
To verify further, you can even add a data source named as TestData DB which is a fake data source that comes with Grafana. On the sidebar, click Configuration, then click Add data source to add TestData DB as a data source.
Click Save & test. Under the Dashboards tab, you can import the Simple Streaming Example.
Navigate to your dashboard home and choose the Simple Streaming Example dashboard. You will see the following dashboard.

Grafana features
Some of Grafana’s highlighted features include:
- Data analytics through dashboards
- Application monitoring
- Integration with variety of data sources, ie, Prometheus, MySQL
- Visualize system resources such as CPU and memory
- Create, edit, and share dashboards
- Alerting capabilities
- Query your metrics
Grafana support and pricing
Grafana currently comes with three different support models:
- Grafana Open Source: The open-source and self-managed offering of Grafana. You have to manage your instances yourself, and if you run into any issues, you have to raise the problem with the Grafana community. However, if you want to contribute to the community, you can raise issues and fix them.
- Grafana Cloud: This is the fully managed service offered by Grafana. With Grafana Cloud, you don’t have to worry about managing infrastructure for the Grafana instances. Grafana Cloud comes in three flavors: Free ($0), Pro ($49 +usage), and Advanced (custom pricing).
- Grafana Enterprise: This offering caters to company-specific needs around data and privacy. It comes with features such as advanced security and compliance, 24/7 hands-on support teams, and access to enterprise plugins like New Relic, AppDynamics, Oracle, Dynatrace, ServiceNow, and Datadog.
Getting started with Prometheus
Prometheus is an open-source metrics-based monitoring and alerting solution, and the de facto standard when it comes to monitoring Kubernetes. You can install Prometheus to your Kubernetes cluster with one command: helm install Prometheus bitnami/kube-prometheus using Helm. Prometheus is often self-hosted, but it has become increasingly popular to used a managed service.
In Prometheus terminology, the process to gather data from the cluster or application is called scraping. It scrapes the metrics by using an HTTP connection on a predefined port to get metrics from your applications and stores the data in time-series format in its database.
You can run query data using its PromQL query language. The Prometheus server uses a pull-based approach to collect metrics data from applications.
Prometheus has the following core components:
- Server: Collects and stores metrics.
- Alertmanager: Receives alerts from various data sources and processes them. Alerts are typically sent using Slack or email.
- Client libraries: Supports client libraries for different languages that can be used to instrument your applications.
Prometheus and Grafana feature comparison
| Prometheus | Grafana |
|---|---|
| Some options to view metrics and basic trends. | Maximum data visualization options using charts and graphs. |
| Provides storage for time-series data. | Doesn't have its own storage. |
| Pull-based, scrapping HTTP endpoints. | Provides plugins to get data from different data sources. |
Grafana and Prometheus: Match made in heaven
However, capable as Grafana and Prometheus are on their own, a common use case for each is to work in tandem. Prometheus collects and stores data, and Grafana offers developers an elegant way to visualize that data, making it easier to analyze and act on.
In this section, you’ll be installing Prometheus and Grafana on an existing Kubernetes cluster for monitoring the cluster. You’ll use a minikube local Kubernetes cluster for this setup.
First, install Prometheus on your local Kubernetes cluster using Helm. You’ll use the helm repo add bitnami https://charts.bitnami.com/bitnami command to add a Bitnami Helm repository.
For this demo, you’ll install Prometheus with its default configuration using the helm install prometheus bitnami/kube-prometheus command. It takes a while for all the pods to come into RUNNING status. After the install, you should see the following pods in the output of kubectl get all command:
$ docker ps
| Name | Ready | Status |
|---|---|---|
| pod/alertmanager-prometheus-kube-prometheus-alertmanager-0 | 2/2 | Running |
| pod/prometheus-kube-prometheus-operator-86bbf564b8-rzx2h | 1/1 | Running |
| pod/prometheus-kube-state-metrics-78667fbf77-wj4w4 | 1/1 | Running |
| pod/prometheus-node-exporter-8zpd4 | 1/1 | Running |
| pod/prometheus-prometheus-kube-prometheus-prometheus-0 | 2/2 | Running |
In this default setup, you cannot access Prometheus outside the cluster as the service type is ClusterIP. To access Prometheus from outside the cluster, execute the following commands:
After that you can access it via http://127.0.0.1:9090/.
Next install Grafana using the helm install grafana bitnami/grafana command. You should see the following output on your terminal:
After the Grafana pod is created, you can run the kubectl port-forward command as mentioned in the output and navigate to http://127.0.0.1:8080.
In this setup, default admin/admin credentials don’t work, as the Helm chart generates a random password stored in Kubernetes secret. You can retrieve it using the kubectl get secret command as mentioned in the output. Log in using this password. At this point, both Grafana and Prometheus are up and running inside your Kubernetes cluster.
Prometheus has already started collecting metrics from your Kubernetes cluster, but you haven’t added it as a data source in Grafana. Let’s do that.
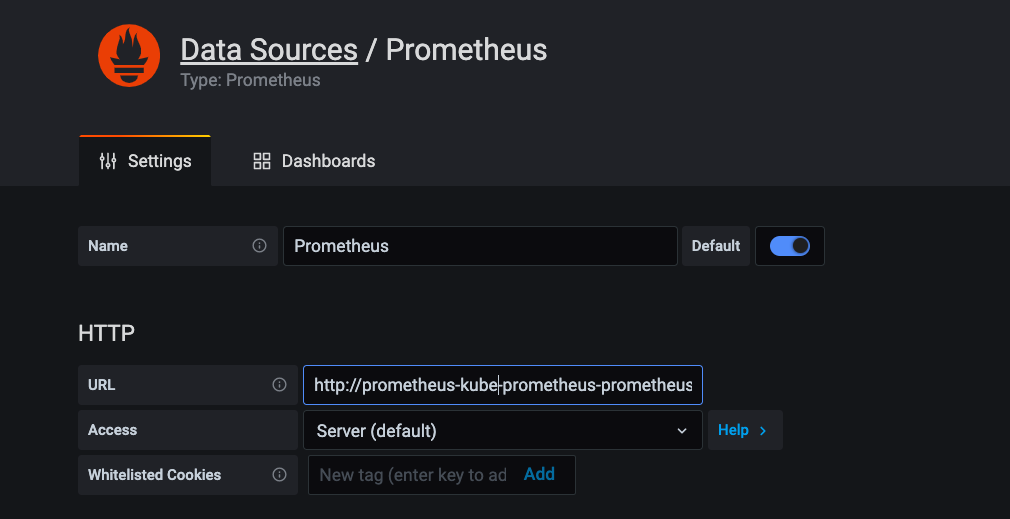
The previous section about Grafana already covered how to add a data source in Grafana, so the process is not much different for Prometheus. However, while adding Prometheus as a data source, you have to provide its server URL. Both Prometheus and Grafana are running in the same cluster, so use the prometheus-kube-prometheus-prometheus.default.svc.cluster.local DNS name mentioned in the following screenshot as server URL and port 9090.
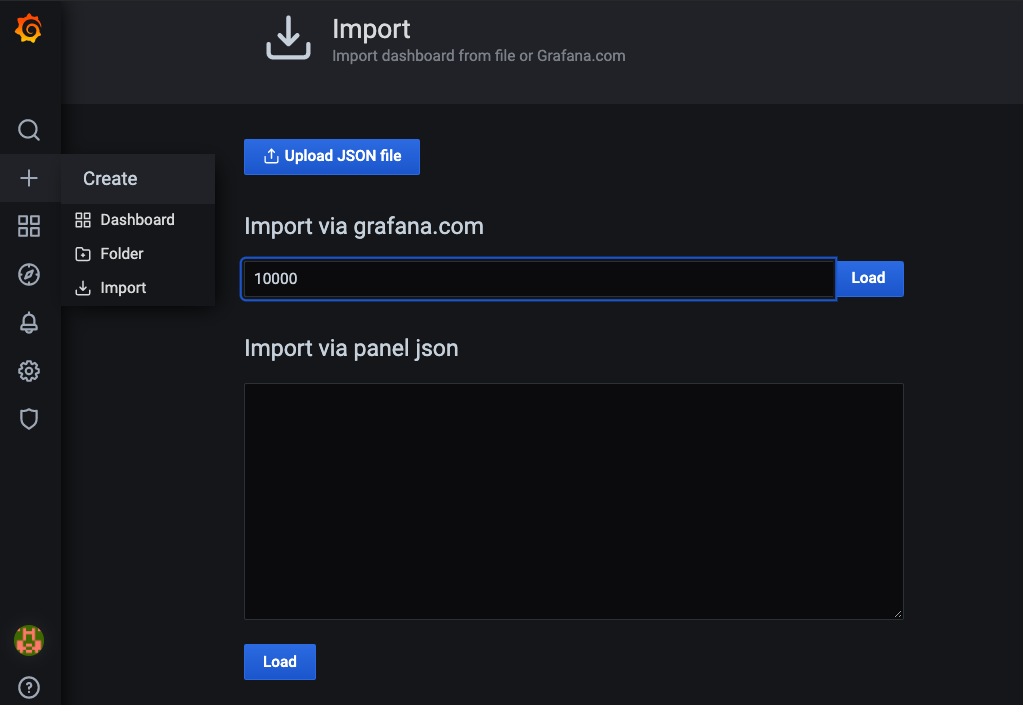
For visualization, you can also import ready-made Grafana dashboards from its vast repository of dashboards. Use a dashboard named Cluster Monitoring for Kubernetes and have ID 10000 for this demo.
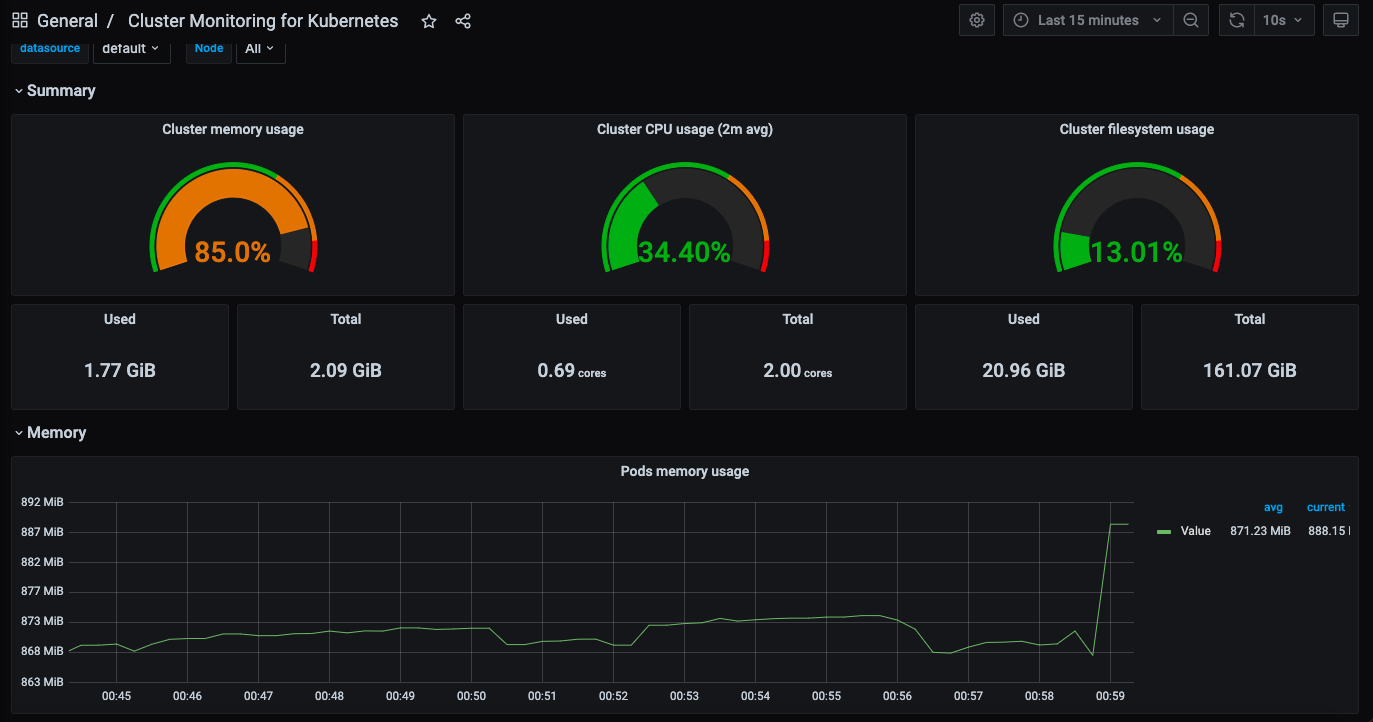
After the successful import, you should see the following dashboard:
Conclusion
While Prometheus is good at scraping metrics and storing time-series data, Grafana scores in visualization using charts and graphs. Together, they’re a strong combo for your team’s ability to access and work from data that’s relevant and thorough. At this point, you should feel armed with some practical examples for combining these tools to monitor your Kubernetes clusters.
Observability and application monitoring are essential components of the DevOps philosophy. We tend to interchange these terms when used together, but in reality, they have different meanings. While observability helps you understand why your application/system is not working, monitoring tells how it is working. When we talk about monitoring distributed systems like Kubernetes, it’s hard to know if something is up or down through traditional monitoring.
If you're looking to build a dashboard to make monitoring your Kubernetes clusters more streamlined, then check out Airplane. Airplane is the developer platform for building internal tools. The basic blocks of Airplane are Tasks, which are single or multi-step operations that anyone can use. Airplane also offers Views, a React-based platform for building internal UIs quickly.
To try it out and build your first monitoring dashboard using Views, sign up for a free account or book a demo.


