
Prometheus continues to be one of the most popular cloud-native monitoring tools for collecting and aggregating metric statistics as time series data. Unsurprisingly, Prometheus event monitoring and alerting is built on the accuracy and comprehensiveness of metric data. While Prometheus uses instrumented jobs to scrape metrics from non-Prometheus target endpoints, an exporter acts as an emissary push-gateway between a third-party application and the Prometheus server, to expose data as native metrics.
In this guide, we’ll discuss how Prometheus exporters work, practical steps for implementing exporters in a deployment, and recommended practices for using them.
What is a Prometheus exporter?
A Prometheus exporter aggregates and imports data from a non-Prometheus to a Prometheus system. An exporter is considered essential in any cloud-native ecosystem that includes applications that don’t expose Prometheus-supported metrics by default. A Prometheus exporter acts as a proxy between such an applications and the Prometheus server. Exporters use a simple, text-based, key-value format to scrape and expose metrics over time, via HTTP, for aggregation and decision-making.
How Prometheus exporters work
Prometheus implements the HTTP pull model to gather metrics from client components. For event-based monitoring, the Prometheus client relies on an exporter that acts as an abstraction layer between the application and the Prometheus server.
A Prometheus exporter’s working mechanism typically involves the following:
- Providing a target endpoint that the Prometheus server periodically queries for metrics.
- Extracting metrics data from a non-Prometheus application.
- Transforming captured data into a Prometheus ingestible format by leveraging client libraries.
- Initiating a web server to display metrics through a URL.
Prometheus exporter implementation types
In a complex ecosystem of multiple stateful and stateless applications, there are two approaches to implementing Prometheus exporters for comprehensive metrics collection. These include:
Application built-in exporters
Built-in exporters are used when the client system natively exposes key metrics, including request rates, errors, and duration. Common use cases include:
- Used to develop an application from scratch: developers assess and integrate Prometheus client requirements from the initial phases of application design.
- Integrated into existing applications: teams modify code to add specific Prometheus client capabilities.
Third-party/standalone exporters
Standalone exporters are used to expose metrics so they can be collected and processed externally. In such instances, applications typically expose metrics through a metric API or logs. Standalone exporters are also provisioned in setups where the exposed data relies on transformation and aggregation by an external service.
Examples of Prometheus exporters
Some popular open-source Prometheus exporters include:
Node/system metrics exporter
Node Exporter is the official exporter for hardware and kernel metrics exposed by *nix systems, such as Linux, OpenBSD, FreeBSD, and Darwin. The exporter reports metrics that are useful in monitoring node (host and server) performance, such as:
node_cpu_seconds_total{mode="system"}- Captures the amount of CPU time spent in system mode per second within the past 60 seconds.node_filesystem_avail_bytes- Returns the storage capacity (in bytes) available to non-root users.node_network_receive_bytes_total- Returns the average incoming network traffic per second over the past 60 seconds.
Windows exporter
This exporter collects metrics from Windows hosts (both PCs and servers) and exposes them to the Prometheus server. The exporter collects and exposes host metrics such as:
cpu- Exposes multiple metrics about CPU usage, including time spent in idle states, time spent in different modes, number of hardware interrupts received or serviced, and total number of deferred procedure calls received.memory- Used to export memory usage metrics, including amount of physical memory available for allocation, number of bytes used by the file system cache, amount of committed virtual memory, and number of page table entries in use by the system.logical disk- Captures metric data about logical disks, such as rate of byte transfer during read operations, rate of write operations, time spent servicing requests, and total and unused disk size.
The exporter also exposes data on foundational Windows services, including:
Blackbox exporter
The Blackbox exporter allows monitoring teams to collect metrics about endpoints over common transport protocols, including DNS, TCP, HTTP(S), gRPC, and ICMP. The exporter collects such metrics as:
probe_ssl_earliest_cert_expiry- Shows the duration (in seconds) during which a certificate remains valid.probe_success- Detects when probes are failing.probe_http_content_length- Shows the size of an entity body.
SQL exporter
This database-agnostic exporter collects and exposes metrics for SQL-based database management systems. SQL metrics exposed include:
mssql_deadlocks- Identifies deadlocks in the database.mssql_disk_space_used_bytes_total- Identifies utilized disk space.mssql_disk_space_available_bytes_total- Identifies available disk space.
ElasticSearch exporter
The ElasticSearch exporter fetches various metrics about ElasticSearch clusters. Some exposed metrics include:
elasticsearch_indices_index_current- Shows the number of documents currently in the index.elasticsearch_indices_mappings_stats_json_parse_failures_total- Captures the total number of errors encountered when parsing JSON.elasticsearch_indices_query_cache_total- Shows the size of memory cached by indexed queries.elasticsearch_thread_pool_active_count- Shows the total number of active threads within the thread pool.
Other Prometheus exporters
Other popular Prometheus exporters include:
- MongoDB query exporter
- Jenkins exporter
- Apache exporter
- HAProxy exporter
- AWS ECS exporter
- Azure Health exporter
- JSON exporter
How to set up a Prometheus exporter for monitoring and alerts
Although there are multiple ways of building exporters, Prometheus ships with a Python library to support the development of metric collectors and exporters in a few simple steps. In this section, we’ll discuss how to build a basic exporter for a Kubernetes cluster using a Python script. The demo workflow essentially includes the steps for building the exporter using Python, building a Docker image, and using the image in a cluster deployment object for exposing metrics.
Prerequisites
An existing Kubernetes cluster.
Docker service installed with the CLI logged into Docker Hub…
Creating the exporter using Python script
First, create the working directory using a command in this format:
Navigate to the directory:
Create the directory for Python scripts and navigate to it:
Create the Python script that defines the exporter with related dependencies and objects:
The exporter script is divided into three parts. The first part imports all the dependencies required to implement a metrics exporter. To perform this step, add the following code to collector.py:
The second part defines the custom exporter class to be built and implements the exporter object for each desired metric. Add the following code to collector.py to build the custom exporter class:
To define objects for metric exporters, first add the following code to declare the exporter objects:
Once that’s done, you add two objects for the metric exporters. To add a gauge metric for memory usage, add the following code to collector.py:
The second object is a counter metric that enumerates the number of HTTP requests made to the cluster. To add the counter metric object, add the following code to collector.py:
Once the metric objects are added to the script, the third and final section of the script defines the initiation of the Prometheus server and provides an endpoint for scraping metrics.
To build exporters when being deployed, this code will rely on Prometheus client libraries and modules. To store this data within the image, create a pip-requirements.txt file that references Prometheus client libraries:
Building the Docker image
Navigate back to the Project directory:
Create the Dockerfile to be used in building container images:
Add details of the working directory and environment to the Dockerfile, as shown below:
Once the Dockerfile is saved, run the following command to build the container image:
Confirm the creation of the image by running the command:
Which should return a response similar to:
| REPOSITORY | TAG | IMAGE ID | CREATED | SIZE |
|---|---|---|---|---|
| <docker-hub-user>/custom-explorer | latest | 4de8857db072 | 38 seconds ago | 908MB |
| python | 3.6 | 54260638d07c | 8 months ago | 902MB |
Push the image to Docker Hub by running the command:
Which returns the details similar to:
Building a Prometheus deployment
Once the Docker image is successfully deployed, the next step is to build a service and deployment object that uses the Docker image to create a working operator.
Create and navigate to the folder to host the templates:
Create the deployment manifest:
Create the service manifest:
Apply both the configurations:
To verify if the configurations are correctly applied, run the command:
Which returns the response:
| NAME | READY | STATUS | RESTARTS | AGE |
|---|---|---|---|---|
| darwin-custom-collector-75cff7d89f-r8nml | 1/1 | Running | 0 | 32s |
To access Prometheus from the localhost over port 8080, run a command similar to the one below (make sure to replace the pod name shown below with the one in your cluster):
Which shows the response:
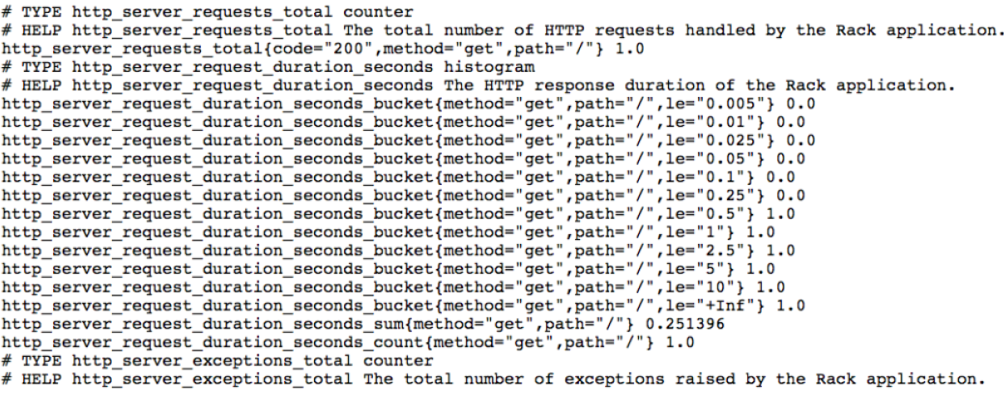
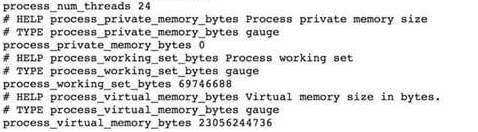
The configured metrics can be accessed from the following URL:
Accessing this URL on a web browser gives access to memory and request metrics, as shown:
Best practices when using Prometheus exporters
Some best practices to adopt when using Prometheus exporters include:
Utilize an existing Prometheus exporter
Developers should leverage default Prometheus exporters built for collecting third-party metrics from different application types. Building a custom exporter not only adds to effort overhead but also introduces regressions into an application’s core functions. To find the right Prometheus exporter, developers should evaluate the maturity of the exporter as an open-source project and the type of metrics it can expose. The Prometheus website provides a comprehensive exporters and integrations list that can help you identify the best choice for a deployment. Other third-party sites, such as PromCat.io, also provide curated exporter lists that are useful in choosing the right exporter for a complex cluster of different applications.
Use labels and annotations to help understand metrics
Each exporter collects and exposes a unique set of metrics. While the metric name is always verbose, comprehending the information it presents is often difficult at first glance. Some exporters use the OpenMetrics format to provide additional context about a metric out-of-the-box. In the absence of such information, attaching metadata through labels and annotations is recommended to offer context and meaning. Attaching metadata for Kubernetes object can be done with:
- Labels are key-value pairs that help with grouping and querying objects. These can further be classified into:
– Instrumentation labels for analyzing the information exported from inside an application.
– Target labels for analyzing metrics aggregated from disparate sources in a full-scale deployment. - Annotations store information about objects that can be further used by internal tools and libraries.
Configure actionable alerts
Apart from capturing the right set of metrics, monitoring teams should set up alerts for events such as a metric drifting away from desired values. On a distributed cluster of numerous applications and continuous events, defining an alert strategy is a complex undertaking. If the metrics threshold is too low, the monitoring team gets overburdened with unnecessary alarms. But if the threshold is too high, the monitoring team may miss crucial events, leading to system failure or an undesirable user experience. As a recommended practice, monitoring teams should configure notifications to ensure the perfect balance between an optimum user experience and timely responses to deployment issues.
Adopt an appropriate scaling mechanism
As deployments grow, leveraging numerous exporters and metrics introduces storage and visibility bottlenecks. Avoiding such bottlenecks often relies on comprehensive observability that conforms to the gradual growth of a cluster environment. Considering Prometheus’ innate inefficiency of horizontal scaling, administrators should adopt an appropriate scaling mechanism while proactively accounting for the rising number of services, metric cardinality, and memory usage. Although manual scaling using federation is one option, the approach typically introduces manual overhead in configuration and maintenance. As a recommended approach, organizations should adopt cloud-native, long-term storage (LTS) for automatic persistence of metric data.
Administer robust metric access privileges
As exporters expose sensitive information about applications, services, and hosts, determining who has access to these metrics and how they can use it is critical. HTTP endpoints and logs of Prometheus are also susceptible to vector attacks since they expose a cluster’s operating information and debugging patterns. Organizations should leverage role-based access controls and implement security filters to ensure that only authorized users can access metrics and execute reports. Another recommended practice is to make use of Prometheus’ default authorization and TLS encryption features to prevent API endpoints from exposing sensitive metric data.
Final thoughts
Prometheus is a cloud-native observability solution that collects real-time application metrics for monitoring modern deployments. Exporters are crucial components of a Prometheus monitoring framework that help enable observability of deployed applications and host environments. Understandably, choosing the right exporter or building one is just one step toward comprehensive monitoring, which eventually relies on integration with other visualization platforms such as Grafana.
If you're looking for a comprehensive monitoring solution that is easy to set up and deploy, try using Airplane. Airplane makes it easy for developers to build complex internal workflows and UIs using code within minutes. With Airplane, you can create internal tools that support your engineering workflows: build an incident command center, deployment pipelines, database backups, and more.
To build your first workflow for your most important engineering use cases, sign up for a free account or book a demo.