


Kubernetes is a complex system with many moving parts. Effective monitoring of such a dynamic system requires tools with advanced capabilities. Prometheus is one such application.
Prometheus is an open-source monitoring solution that can collect metrics from a number of target systems. It collects and stores the metrics as time-series data. It also features an excellent alerting mechanism that can integrate with popular team collaboration and incident management tools.
In this article, you will learn why monitoring your Kubernetes cluster is important, what features good monitoring tools must have, and how Prometheus can help. You will also learn about some alternatives to Prometheus for monitoring Kubernetes.
Why is Kubernetes monitoring important?
Kubernetes abstracts a lot of functionalities under the hood. Monitoring each component in the system (physical nodes, pods, containers, proxy, schedulers, etc.) is a big task involving many interdependencies between these components. That’s why, without a proper monitoring strategy, it can be fairly difficult to manage a Kubernetes cluster in a busy production environment.
One of the main areas to monitor is the physical Kubernetes infrastructure, which includes the Node resources—CPU, RAM, network latency, or disk I/O. Another area is the Pods (for example, the number of currently running Pods against the configured value or the number of Pods per Node Group, and so on). Containers have their own metrics—like the ones you get by running docker stats. Finally, applications running within the containers will have their own metrics. Continuously monitoring metrics from all layers of the cluster will also help you find the best possible configurations for different components.
Metrics aside, a proper monitoring solution can also trap anomalies and unusual events from the cluster and notify operations teams in real-time. This allows the team to proactively investigate the root cause and provide a timely resolution.
Application usage history and trend analysis are other benefits of proactive monitoring. For example, if the monitoring history shows the cluster spawning up new Nodes for Pods only during weekends, you can further investigate. Perhaps there are spikes in client connections hitting the load balancer during that time. Equipped with such knowledge, you can add some extra headroom in the cluster to ensure Nodes are readily available for Pods.
Most monitoring solutions in the market today will offer some degree of visibility into Kubernetes. When considering a monitoring solution, the following are some basic factors you should consider:
- Native integration with Kubernetes
- Wide range of available metrics from all layers of Kubernetes
- Log management facilities
- Ease of querying metrics and logs
- Advanced dashboarding and visualization capabilities
- Integration with a wide range of alerting and incident management tools
- Wide range of plug-ins
- Ease of use and manageability
- Licensing costs
- Availability of vendor or community support
Introducing Prometheus
Prometheus is one of the projects managed by the Cloud Native Computing Foundation (CNCF). Many organizations use it to monitor their Kubernetes clusters. Prometheus is often used with Grafana, which is a data visualization tool.
The image below shows a typical Prometheus monitoring setup.
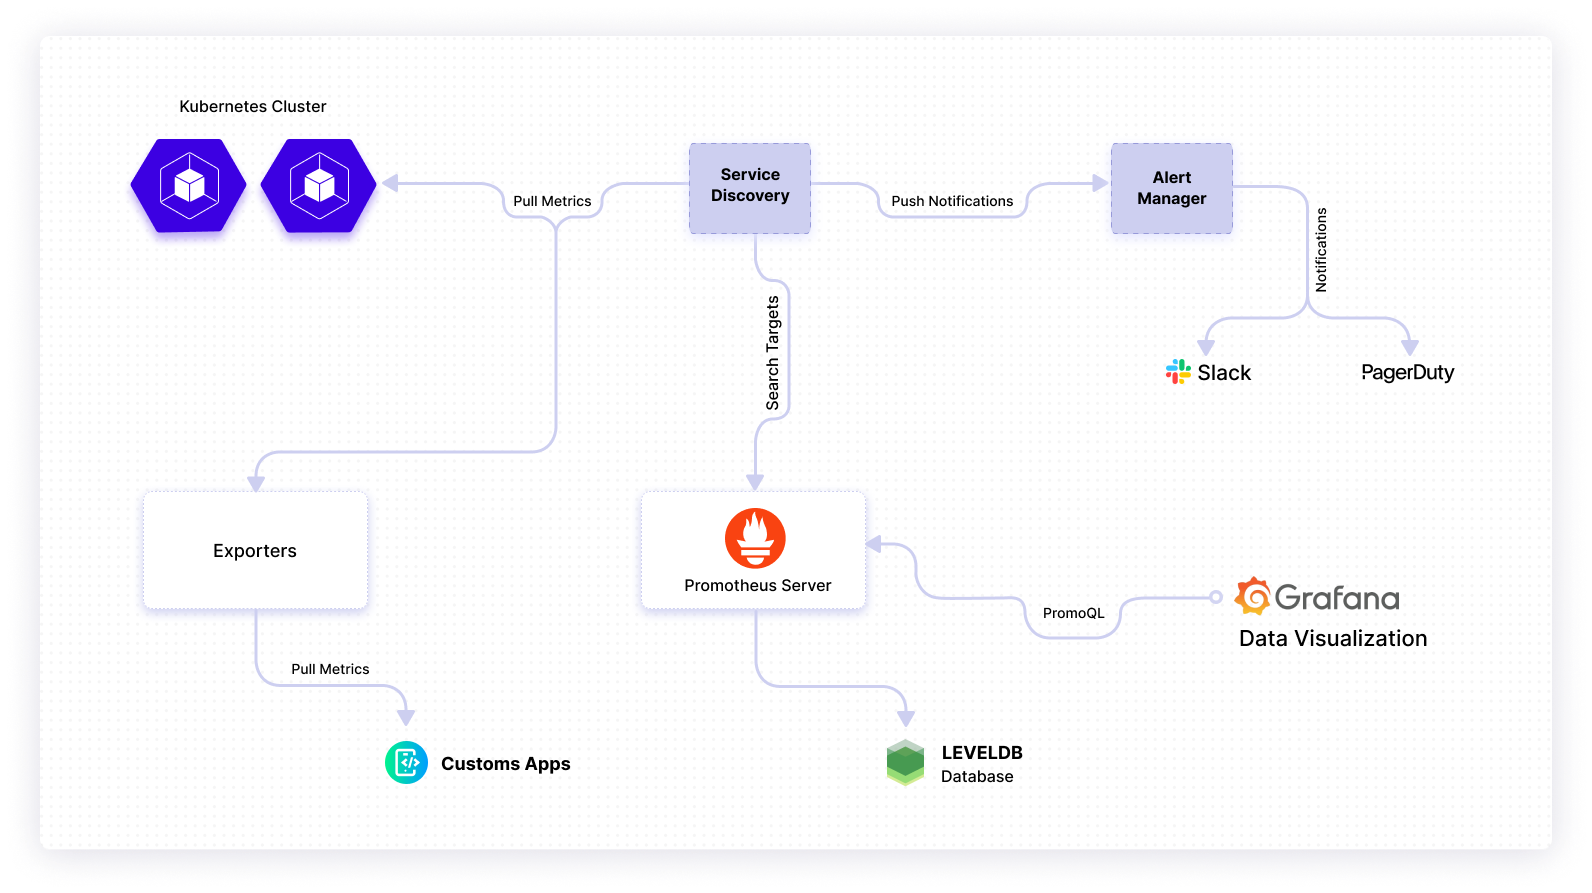
Prometheus usually works by scrapping metrics produced by jobs/exporters in the target system. The Prometheus server pulls these metrics and stores them in the server. The metric data are transformed with rules and categorization for use with a visualization dashboard. You can query the collected metrics using PromQL — which is similar to SQL.
Setting up Prometheus
The easiest way to set up Prometheus is to use Helm charts to install it in a Kubernetes cluster. For our purposes, we are using an Azure Kubernetes Service (AKS) cluster and using Helm charts to install and configure Prometheus along with Grafana. As a prerequisite, you need to have Helm installed on the machine.
Add the Helm repo for Prometheus and Grafana.
Create a namespace for monitoring.
Install the Prometheus chart in the monitoring namespace.
Specify the data source and values in the YAML because when Grafana starts up, it needs to automatically find the data source, which, in this case, is the Prometheus endpoint. It looks like this:
Elements in the URL are the following:
<prometheus-server>is the service name<monitoring_namespace>is the namespace we just created<svc.cluster.local >points to the cluster IP
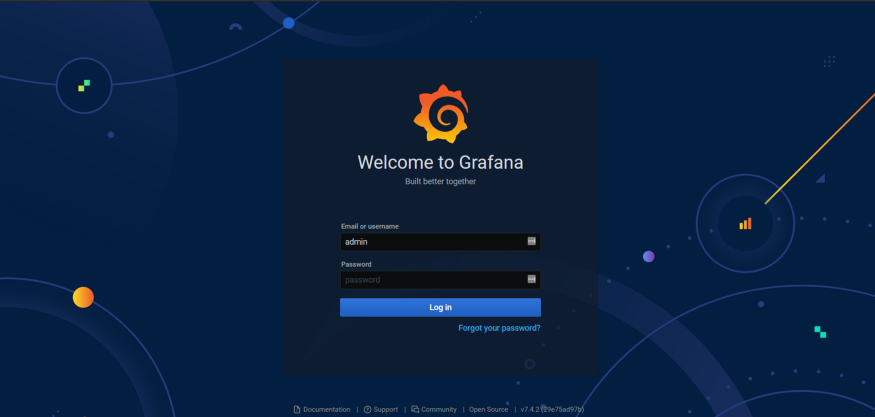
Install the Grafana chart with the arguments below. Change the admin password for the login.
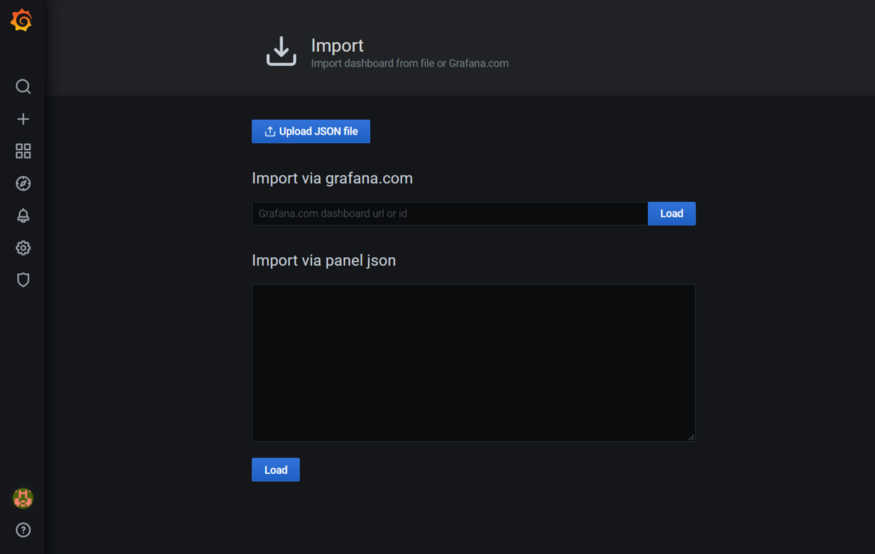
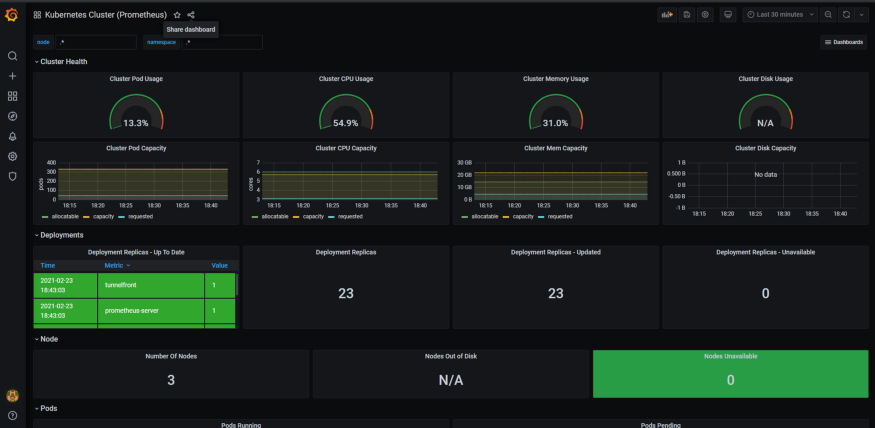
Once the configuration is applied, Grafana will be up and running. You can import a template for the Kubernetes monitoring dashboard to help you get started quickly.
Is Prometheus sufficient?
Prometheus is especially suitable for monitoring containerized environments. Here are some of the pros and cons of using Prometheus for Kubernetes monitoring:
Pros
- Prometheus is free. Unlike many other monitoring tools, it doesn’t have a “free tier” stipulating what you can monitor and how much data your systems can generate.
- It has an active community that can answer (or has already answered) your questions related to Prometheus or its use for monitoring Kubernetes.
- PromQL, a query language, is offered out of the box. You can use this to search and retrieve metric data from the time-series database (TSDB).
- Prometheus uses a pull mechanism. Unlike other monitoring solutions, it doesn’t require agent installation, which can put unnecessary load on target systems.
- Prometheus can be easily configured for service discovery in the network. With service discovery, Prometheus can find endpoints to scrape for metrics. This can be efficient when you have multiple Kubernetes clusters in your network and don’t want to manually add each environment.
- Federation can be used. Sometimes your computing environment can span across public and private clouds with hundreds of networks and, perhaps, even more Kubernetes clusters. Using Prometheus federation, you can create a hierarchically scaled monitoring environment. Federation allows Prometheus to pull aggregates up the hierarchy to a global Prometheus server.
- Managed solutions can be used if you don’t want to set up your own Prometheus environment. You can use managed solutions from public cloud providers, like AWS or Google Cloud.
Cons
- Prometheus has a very basic data visualization capability. You have to use something like Grafana (or other visualization tools) to create complex charts and dashboards. With Grafana, you can add custom widgets to the dashboards and also can import open-source templates.
- Log management is another area where it could add a lot of value since both logs and metrics can provide a full picture of incidents and bottlenecks.
- It doesn’t offer advanced features, like automatic anomaly detection.
- Prometheus has no provision for role-based user access and permissions.
- Prometheus wasn’t designed to retain large volumes of data for a long time. This can be an issue for large networks with many Kubernetes clusters where time-based trend analysis may be critical.
Alternatives to Prometheus, & additional tools
While Prometheus offers a number of powerful features, it does not cover all use cases and it might not be the best fit for every engineering team. Here we quickly explore a couple of Prometheus alternatives worth considering.
Datadog
Datadog is a SaaS-based monitoring tool that is well-optimized for cloud platforms. Apart from collecting thousands of metrics from the network, infrastructure, databases, message queues, cloud platforms, and containers, it offers a monitoring agent for Kubernetes and allows you to create intuitive and powerful dashboards from the collected metrics. Datadog also integrates with the most common communication tools, like Slack or PagerDuty, and offers advanced alert configuration features.
It’s not free, of course, and the minimum price starts at $15 per month per host. Other features, like application performance monitoring (APM) or log aggregation, come with an extra price tag. Also, being a SaaS solution, all your metric data will have to reside in Datadog’s own cloud tenancy.
Conclusion
So now, you have seen why it’s important to monitor your Kubernetes cluster and how Prometheus can help. You’ve seen how to install Prometheus with Grafana and get started quickly. Lastly, you’ve seen a few pros and cons of using Prometheus, and you’ve learned about alternative SaaS-based solutions, including Datadog.
SaaS solutions are easy to set up and configure. Install an agent in your Kubernetes cluster and analyzes the collected data entirely based on eBPF—which also doesn’t require any changes in the Linux kernel. With this approach, you don’t have to configure latency on every service or install app-specific packages or configure middleware. New services automatically populate the dashboard with metrics and events. Users can search and filter the events; observe them over different time windows; set alerts for important events, like crashloops or failed jobs; and get notified through Slack.
Another strong solution to consider is Airplane. With Airplane, you can quickly transform scripts, queries, APIs, and more into powerful workflows and UIs. Airplane Views allows you to build a monitoring dashboard to help you manage and troubleshoot your Kubernetes cluster. With Airplane, you also get strong out-of-the-box features, such as audit logs, job scheduling, and more.
To try it out and build your first internal tools within minutes, sign up for a free account or book a demo.


