
Monitoring and alerting are crucial for modern application delivery, as they allow organizations to continuously analyze the state of systems and resources. With the right metric-monitoring and -alerting platform, software operators can identify the causes of suboptimal performance, security incidents, and system outages.
In the current cloud-native landscape, Prometheus is one of the most popular open-source metric gathering and alerting platforms for microservices architectures.
In this article, we’ll delve into Prometheus metrics and explain how the platform discovers metric endpoints and stores metrics for production monitoring.
How Prometheus works: components and eatures
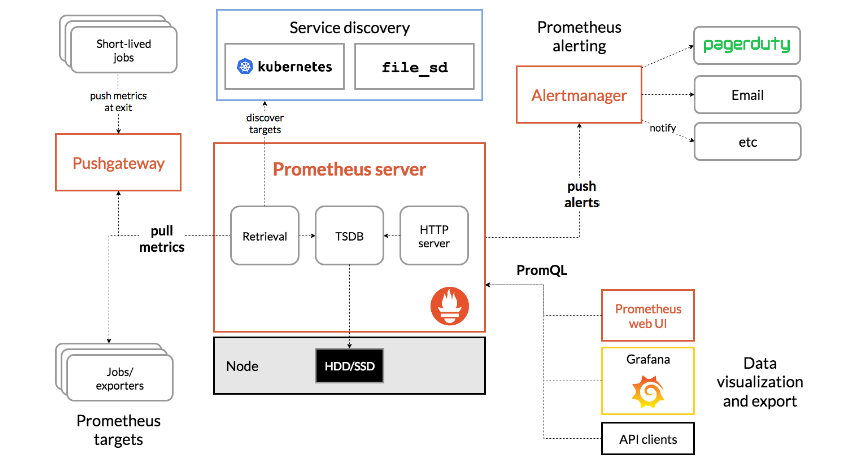
Prometheus primarily utilizes an HTTP endpoint to scrape metric data from instrumented services and applications. These endpoints present their respective metrics in plaintext HTTP format — the metrics are either scraped by the Prometheus server directly or extracted through a push gateway for short-lived, instrumented jobs.
These scraped metrics are stored locally as aggregated time-series data for capturing events and historical representation. Prometheus exposes these aggregated metrics further through an API for consuming services, such as Grafana, for real-time and historical visualization of metric data.
Prometheus architecture and key components
Prometheus relies on a loosely coupled set of components to enable service or machine discovery, metrics scraping, and storage. Prometheus servers are non-distributed and are independent of network storage and remote connections for monitoring services.
Key components
Prometheus server
The Prometheus server represents the standalone machine instance that schedules the querying of metric endpoints at a predefined sampling frequency along with the scraping and storing of metrics data. The server uses monitoring jobs that are specified in a YAML file as “scrape config” directives to determine the sampling frequency and other scraping specifications.
Based on the sampling frequency, the Prometheus server uses the exposed endpoints to pull metrics from the target servers, relieving clients of the tedious task of manually pushing metrics for data aggregation and analysis.
Client libraries
Client libraries enable developers to add Prometheus instrumentation to their code; this instrumentation helps define and expose application metrics for each application language. Prometheus offers official libraries that are compatible with Ruby, Go, Python, and Java/JVM. Additional unofficial third-party client libraries include Haskell, Common Lisp, Dart, Erlang, C#/.NET, PHP, Perl, and Rust.
Pushgateway
In systems that are not compatible with pull-based metric scraping, Prometheus provides an additional Pushgateway component for gathering metrics from external services and applications. Pushgateway is particularly useful for ephemeral, short-lived jobs that may initiate and terminate before the Prometheus server can identify and scrape metrics from them. The gateway essentially collects these metrics before they are lost and retains them to be pushed to the server when it is ready to scrape metric data.
Exporters
Exporters are a collection of components, servers, and libraries that enable Prometheus to scrape metrics from third-party systems when the target endpoint or service can’t expose them directly in Prometheus’s required format. Exporters are categorized by the target endpoint, with common types including issue trackers, hardware-related exporters, miscellaneous alert managers, and database exporters.
Alertmanager
The Prometheus Alertmanager orchestrates alerts generated by the Prometheus server when a user-defined rule meets an alert condition. An alerting rule is typically a PromQL expression that is configured in the Prometheus server, which evaluates them regularly for grouping and deduplication. The Alertmanager can also be configured to send notifications via in-built notification receivers such as Slack, OpsGenie, and PagerDuty, or via email notifications.
Prometheus features
Multidimensional data model
Prometheus stores all metric data in a time-series format while implementing a multidimensional data model with metric names and key-value pairs as identifiers.
Flexible query language
Prometheus leverages the PromQL flexible query language for real-time aggregation and selection of time-series data into a multidimensional model.
HTTP pull model
The platform collects time-series data over HTTP endpoints using a pull model for efficient data scraping.
Intermediary gateway
For systems that do not inherently support pull-based scraping, Prometheus uses Pushgateway to collect metrics from external services.
Non-reliance on distributed storage
Each Prometheus server is autonomous and does not rely on distributed storage or remote services to scrape, store, and analyze metric data.
Multiple graphing and dashboards
Prometheus offers multiple ways to visualize data using an expression browser, a console template language, and in-built Grafana integration.
Target discovery via static configuration or service discovery
For dynamic discovery and scraping, developers can either configure targets in a configuration file using the static_config parameter or specify targets using service discovery techniques.
What are Prometheus metrics? Here are some metric types
A metric is a quantitative measure that helps in the assessment, comparison, and tracking of operational statistics. Prometheus collects metrics as a timestamped set of changes recorded successively in fixed intervals. This metric data is then exposed by Prometheus using a combination of the metric name and labels (consisting of timestamps and float values). The exposition format is an efficient approach to associating metrics with their respective metadata, defining the metric type and tag description.
Metric types collected by Prometheus
Prometheus metrics are primarily categorized into four categories, or types:
Gauge
A gauge represents a snapshot of a metric at any given point, where the value of the metric can rise or drop arbitrarily over time. Gauge metrics are mostly used for measuring a value without factoring in the rate at which the value changes.
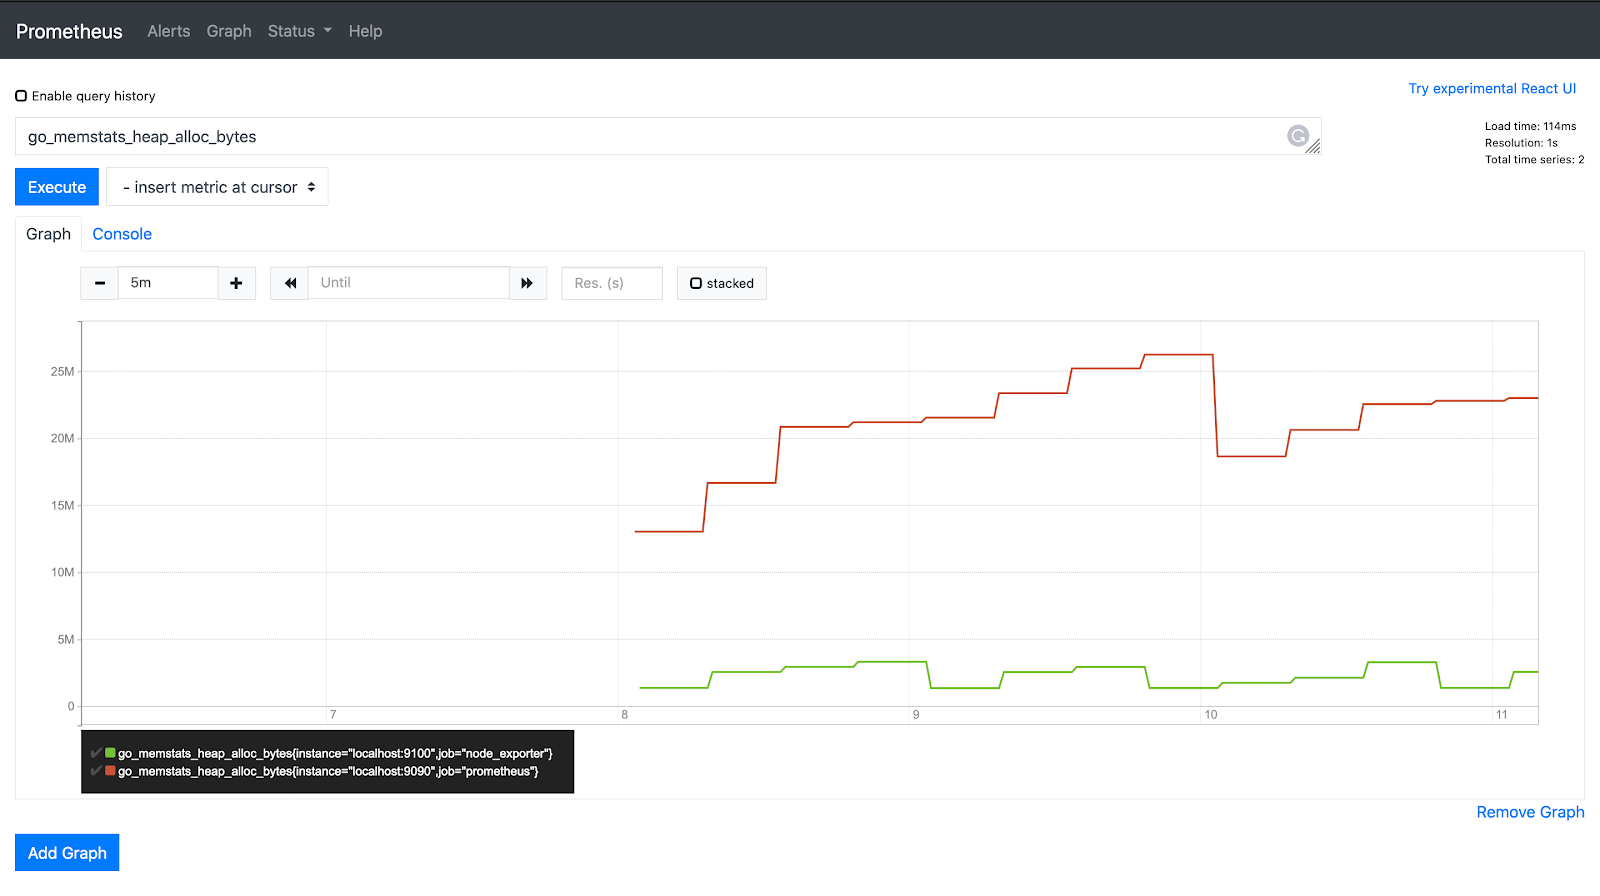
Use cases: Used to analyze the current state of a metric that may remain constant or change with time. Examples of gauge metrics include CPU and memory utilization, size of a queue, temperature, and number of pods.
Counter
Counter metrics are cumulative counts that quantify units that only increase. The only time a counter metric goes down is when the sensor restarts, resetting the value to zero. Using the rate() function, these metrics are derived by the rate of change over time or by computing the difference between two timestamps.
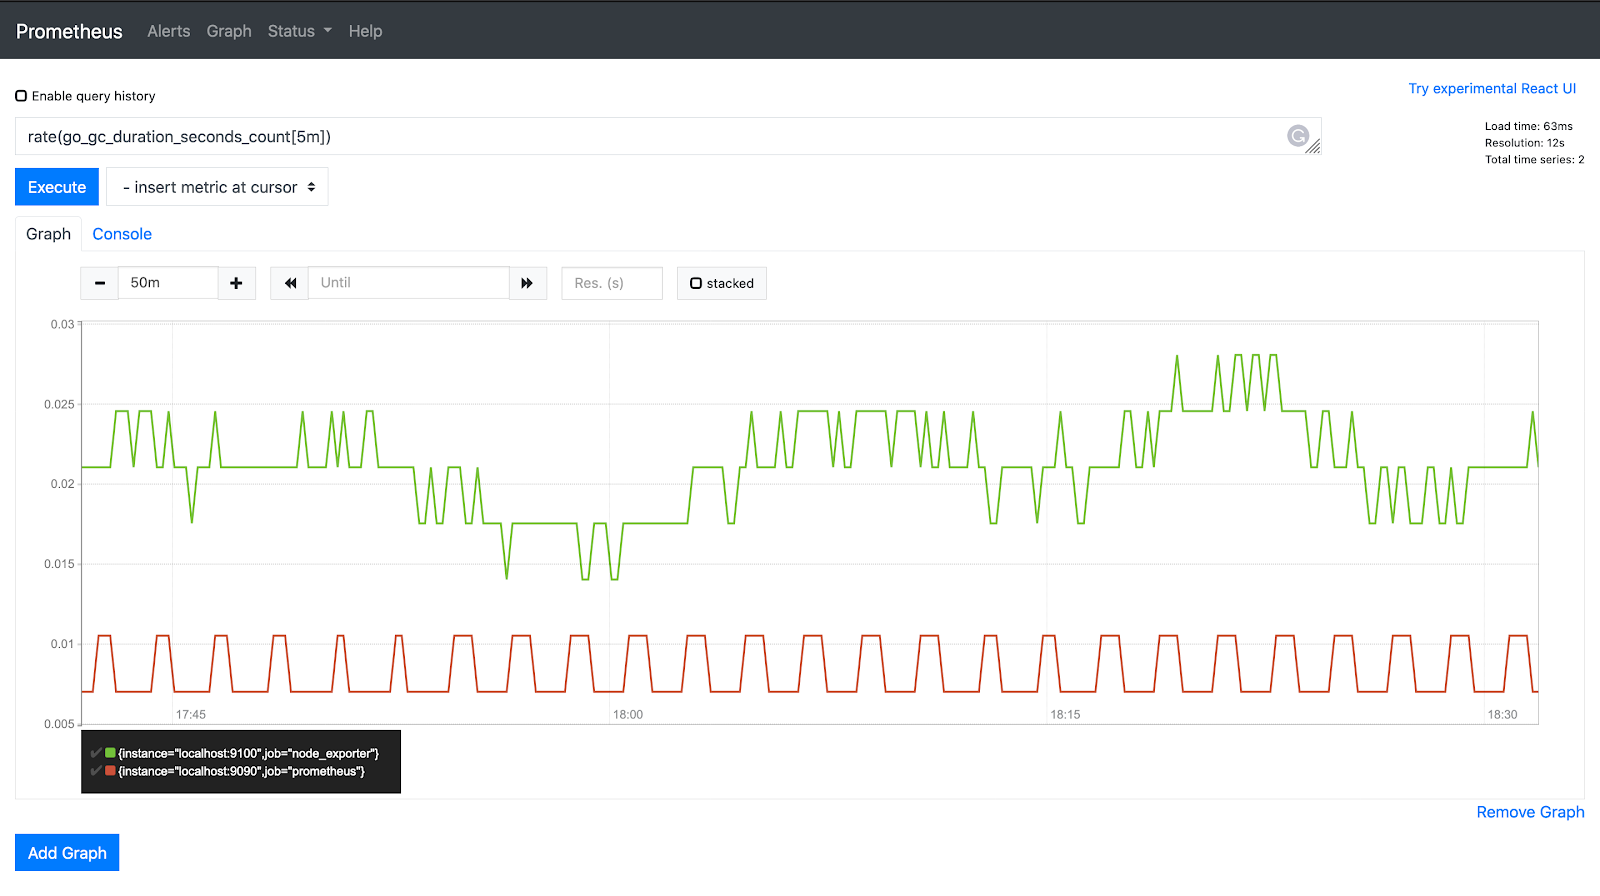
Use cases: Used for analyzing increasing values of an event. Usually queried with the rate() function for identifying the occurrence rate of an event per second. Examples of counter metrics include API call requests and error counts.
Histogram
With histograms, the Prometheus server samples metrics by their count or frequency. Histogram metrics are derived by grouping the frequency of metric observations into specific, predefined buckets. Prometheus uses these buckets to record the distribution of a metric value over a number of events.
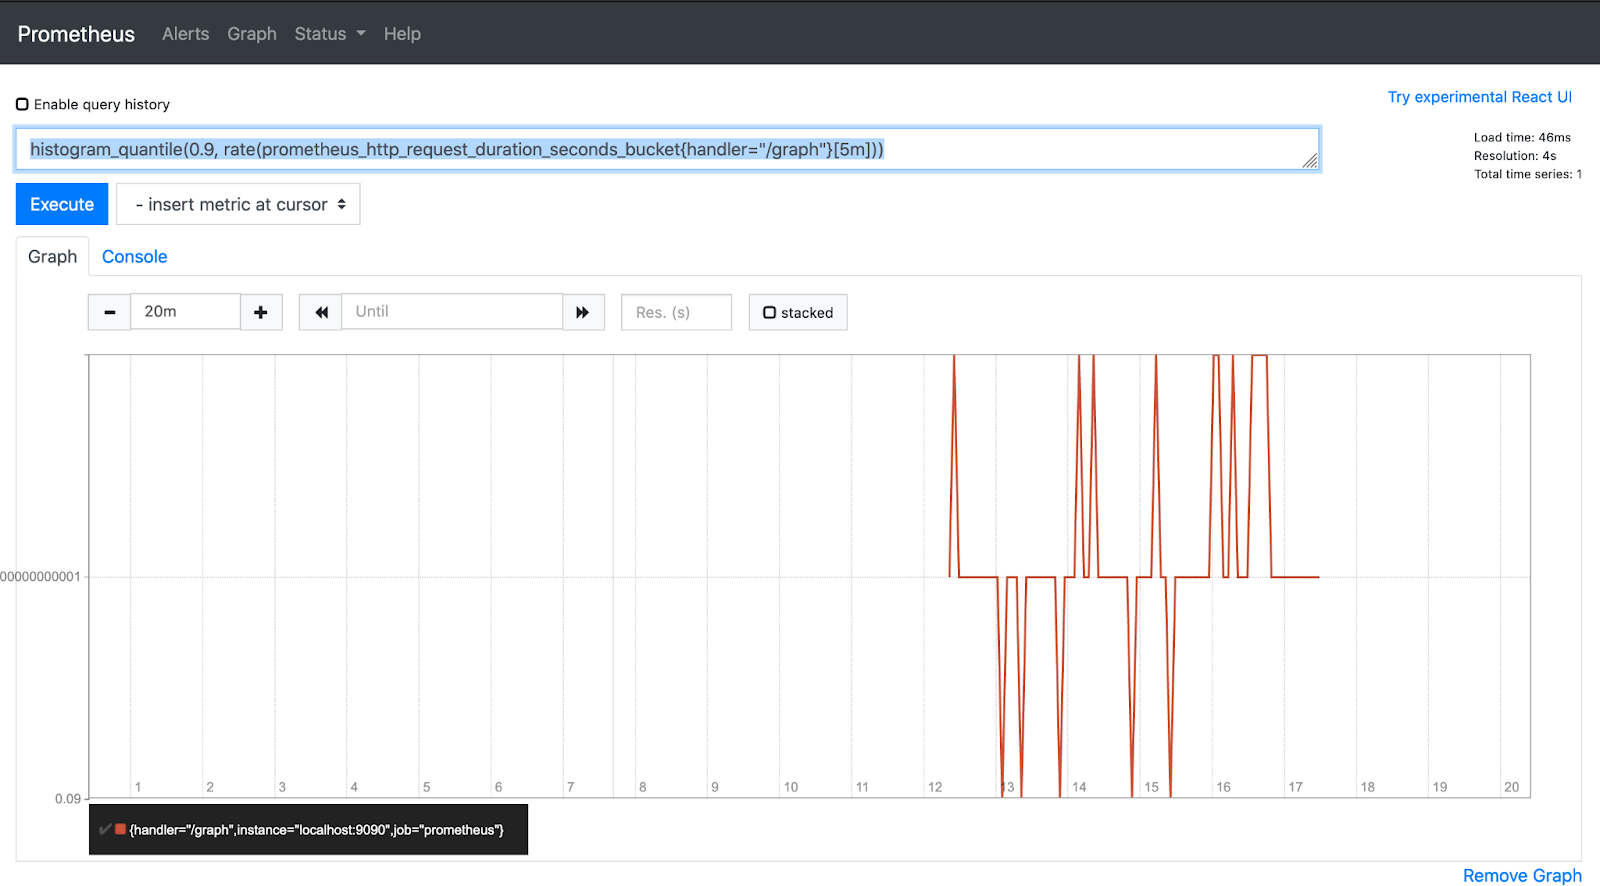
Use cases: Histogram can record values that are to be used to compute percentiles and averages, and they are useful in instances where exact values are not necessary. Example metrics represented by histograms include response size and request duration.
Summaries
Summaries track metric distributions over time; however, unlike with histograms, the periodic values are exposed directly on the application server. Because of this, summaries can’t be used to aggregate metric data from multiple sources, making them an inefficient option for deducing the time frame covered by different samples.
Use cases: For calculating accurate quantiles where the range of values is unknown. Example metrics include request duration, latency, and response size.
How Prometheus stores metrics
The Prometheus server stores data locally in a time-series database, where the storage subsystem treats indexes and bulk data differently. While indexes are stored in a LevelDB database, metric data is stored on a disk and is organized into 1024-byte chunks, with one file for each time series.
All active and recently used chunks are kept in memory, while the metric data is stored with a retention duration of 15 days by default. For long-term storage, Prometheus supports multiple storage extensions, which allow the server to read and write data onto remote endpoints.
Supported remote storage endpoints include AppOptics, Azure Event Hubs, Cortex, Elasticsearch, Google BigQuery, InfluxDB, Kafka, and OpenTDSB. Prometheus also supports the Prom-Migrator tool for sharing and migrating metric data between different remote storage systems.
Using custom metrics on Prometheus
Prometheus’s custom metrics adapter guides the Prometheus server in discovering, associating, naming, and querying custom metrics. The adapter is deployed through a ConfigMap, with custom metrics and alerting rules being defined within the `data:config.yaml` spec.
Prometheus also leverages the OpenMetrics standard for metric exposition through various client libraries. The OpenMetrics API specification offers a unified format that enables teams to build custom exporters, integrations, and ingestors. OpenMetrics telemetry data is built both for repetitive consumption and to provide meaningful data over successive expositions. The Prometheus server scrapes the exposed custom metrics using an HTTP GET request to a URL assigned to a particular service or application.
In addition to the standard Prometheus metrics, the Prometheus OpenMetrics integration also offers the following metrics:
- Info metrics for monitoring event changes along with labels and time data
- Gauge histograms metrics to obtain histogram data of metrics that can change overtime
- State sets for exhibiting boolean values, enumerations, and bitmasks
- Untyped for representing metrics that are generally classified as ‘unknown’ by Prometheus
When to use Prometheus metrics
Prometheus is built to collect and aggregate metrics, with a powerful query language that allows the slicing and dicing of data for operational insights and alerts. And the platform’s integration with several official and third-party client libraries helps simplify the instrumentation of a wide range of applications and services. While storing data locally makes the time-series database efficient, Prometheus deployments can also be scaled using functional sharding and federation.
Although Prometheus continues to be a preferred choice in modern service-based deployments, the platform falls short in a few critical areas of production monitoring and alerting, as demonstrated by the following use cases and limitations.
Prometheus metrics use cases
Gathering Kubernetes service metric
Prometheus and Kubernetes complement each other as two of the most popular tools in a cloud-native stack. Prometheus can be deployed into Kubernetes clusters as a binary or using a Docker image. A single binary running on a Kubernetes node is mostly considered for development and test environments. On the other hand, for production-grade deployments and statefulsets, Prometheus can be deployed as a raw Docker container through configuration manifests.
The Prometheus metrics server leverages the Kubernetes API to discover changing state of various cluster components, such as cluster nodes, endpoints, services, pods, and ingress.
By default, Kubernetes service metrics are allowed to be scraped by exposing a web port. In services that don’t expose Prometheus metrics from the ground up, scraping telemetry data is mostly done through exporters. While machine-level metrics are captured by the Node Exporter, microservices running in Kubernetes-orchestrated containers use HTTP for cluster communication and discovery.
OS monitoring
Prometheus supports OS exporters that collect performance metrics from Linux and Windows operating systems. The Linux node_exporter is an official Prometheus exporter that collects Linux metrics, while the community-developed Windows wmi_exporter is used to gather metrics from the Windows operating system. Some OS metrics ingested by the Prometheus server include memory usage, CPU utilization, disk usage, load, and queue size.
Infrastructure and host monitoring
Prometheus can also be used to monitor the performance of host machines (VMs, hypervisors, and local machines) and other infrastructure components (such as containers and networks). While the node exporter is typically used to scrape host machine data, such as temperature and CPU count, the cAdvisor exporter can be installed to expose metrics of cgroups and other infrastructure components used to run modern applications.
Web uptime and availability status monitoring
Prometheus is widely used on web servers to gather core web vitals including CPU utilization, memory utilization, number of requests, and server availability. While assisting with comprehensive website status monitoring, these metrics are considered crucial to determine the cause of response bottlenecks and downtime.
Limitations of Prometheus
Although Prometheus is known for its reliability and performance, the platform does not guarantee 100% accurate collection and analysis of metric data. As a result, the platform is considered suitable for only high-volume metric aggregation and analysis where a few dropped events do not impact the overall result.
Additionally, for efficient visualization of metrics, Prometheus is often integrated with core visualization platforms, such as Grafana. And as Prometheus is open-sourced and community-driven, there are also concerns around platform security and the lack of enterprise support.
Final thoughts
Prometheus is a powerful tool with a number of important capabilities. Prometheus makes it easy to collect a variety of different metric types across a variety of environments. Prometheus is frequently used with Kubernetes, and users are able to track core performance metrics from Kubernetes components.
While Prometheus offers many benefits, there are some drawbacks, too. Self-hosting Prometheus can be challenging, and many teams opt for a managed offering.
If you're looking for an easy-to-use and powerful internal tooling platform to build a monitoring dashboard, try Airplane. Airplane is the developer platform for building custom internal workflows and UIs. With Airplane Views, you can build custom UIs quickly that fit your most complex use cases. These UIs can help streamline your ability to track performance metrics and troubleshoot issues immediately after they arise.
To build your first monitoring dashboard using code within minutes, sign up for a free account or book a demo.