


While there are many tools you can use for monitoring and alerting, Prometheus has become a default monitoring tool for many companies. Prometheus is a free, open source tool that is commonly used for monitoring containerized applications and Kubernetes clusters. It provides a detailed analysis of your cluster and performs well even under heavy workloads. By integrating it with Grafana, you can visualize your data metrics and gain deep insight into your cluster.
Prometheus provides insight into your Kubernetes cluster and containerized application, but you also want to be notified when any problem occurs. This is where Prometheus Alertmanager comes in. In this article, you’re going to learn about Prometheus Alertmanager, its benefits, how to implement it, and some tips and tricks on how to use it to extract the maximum benefit from your monitoring.
What is Prometheus Alertmanager?
Prometheus alerts allow you to receive automated notifications when certain events occur, triggered by your metric data.
Alertmanager will send notifications to your configured notification channels when your Kubernetes cluster meets pre-configured events and metrics rules in the Prometheus server. These rules can include sending critical messages when an unhealthy node is detected, or sending a warning message when node resource consumption is reaching its limit. You can configure the Alertmanager to send event notifications to a number of channels, including email, Slack, webhook, and other common platforms. Furthermore, Alertmanager offers the ability to group related alerts into a single notification, and to suppress alerts triggered by problems for which notifications have already been sent.
It is easy to install and configure Prometheus Alertmanager into your cluster using the kube-prometheus-stack helm charts. Once installed, the Alertmanager can be configured via command-line/terminal, in conjunction with a configuration file that contains the notification configuration rules.
Use cases for using Prometheus Alertmanager
Prometheus Alertmanager has many use cases. Let’s take a deeper look at a few of them considered to be best practices.
Resource approaching capacity limit
It’s important to know when the resources in your Kubernetes cluster are reaching their limits, since failure to know this can affect the performance of your application on the cluster. For example, if your cluster nodes are reaching their memory limit, the nodes will start evicting pods from their environment until they’ve reduced the number of pods to something their memory can handle. The eviction has a snowball effect on your application because you no longer have sufficient pods in your cluster to handle the traffic being generated by your users, thereby affecting the performance of your application.
You can configure Alertmanager to send notifications if your Kubernetes resources are approaching a limit, allowing you to take quick action to increase your resources or kill unnecessary jobs so as to free up resources.
Processing jobs not running
Jobs in Kubernetes are designed to run to completion, and if a failure occurs during the job processing, Kubernetes re-runs the job until it is successful. However, there are scenarios that cause a job to continually fail—for example, incorrect Docker configurations, or insufficient resources to complete the job. Alertmanager is able to notify you if a job fails repeatedly, indicating a larger problem.
Nodes in a notready state
The status of your worker nodes is very important to the performance and overall cost of your cluster. If one or more of your nodes are in a NotReady state, it has a negative effect on your cluster performance. For instance, when a node is in NotReady, the kube-scheduler won’t be able to schedule pods on it, but the node is still adding to the overall cost of your cluster and consuming resources. Receiving alerts when nodes are in the NotReady state will enable you to take steps to fix the issue.
Implementing Prometheus Alertmanager from scratch
Now that you know a little about how Prometheus Alertmanager can help you, let’s walk through its implementation.
Create a Kubernetes cluster
Before you can use the Prometheus Alertmanager, you need to have a Kubernetes cluster up and running. You can create a local development cluster using Minikube by following this guide. You can also set up a self-managed cluster, or use a managed Kubernetes cluster provided by cloud providers such as Amazon Web Services’ EKS, Azure’s AKS, or Google Cloud Platform’s GKE. Each of the cloud providers explains how to set up a Kubernetes Cluster in their documentation guide.
- Amazon Web Services deployment guide
- Azure deployment guide
- Google Cloud Platform deployment guide
Install helm
Helm is a package manager for Kubernetes, and is an important prerequisite for installing Prometheus into your cluster. Select and run the command for the operating system of your cluster.
Windows
Linux
MacOS
To confirm that you have successfully installed Helm, run the following command to check the version of Helm on your terminal:
Below is the Helm version as at the time of writing this article. You should have a similar response.
Install Prometheus and Alertmanager
Once you have completed the installation of the package manager, you can use it to install Prometheus. Run the following commands:
You will install the Prometheus stack in a new namespace so you don’t clutter your default namespace. Create a monitoring namespace by running the command below:
Then use Helm to install the kube-prometheus-stack
The kube-prometheus-stack automatically creates deployments, pods, and service objects for Prometheus on your cluster. To view them, run kubectl get all.
For this tutorial, you’ll use port forward to access Prometheus and Alertmanager web UI.
The Prometheus server has a web UI that shows simple graphs, current configuration rules, and the state of the monitoring endpoints, but you can’t configure alerting rules. To view the Prometheus web interface, run the following command:
Visit http://localhost:9090 to view Prometheus’s web UI.
Prometheus also has an Alertmanager web UI, which is primarily used for viewing alerts and managing silences. Note that you can’t configure your alert rules there.
Visit http://localhost:9093/#/alerts to view in browser
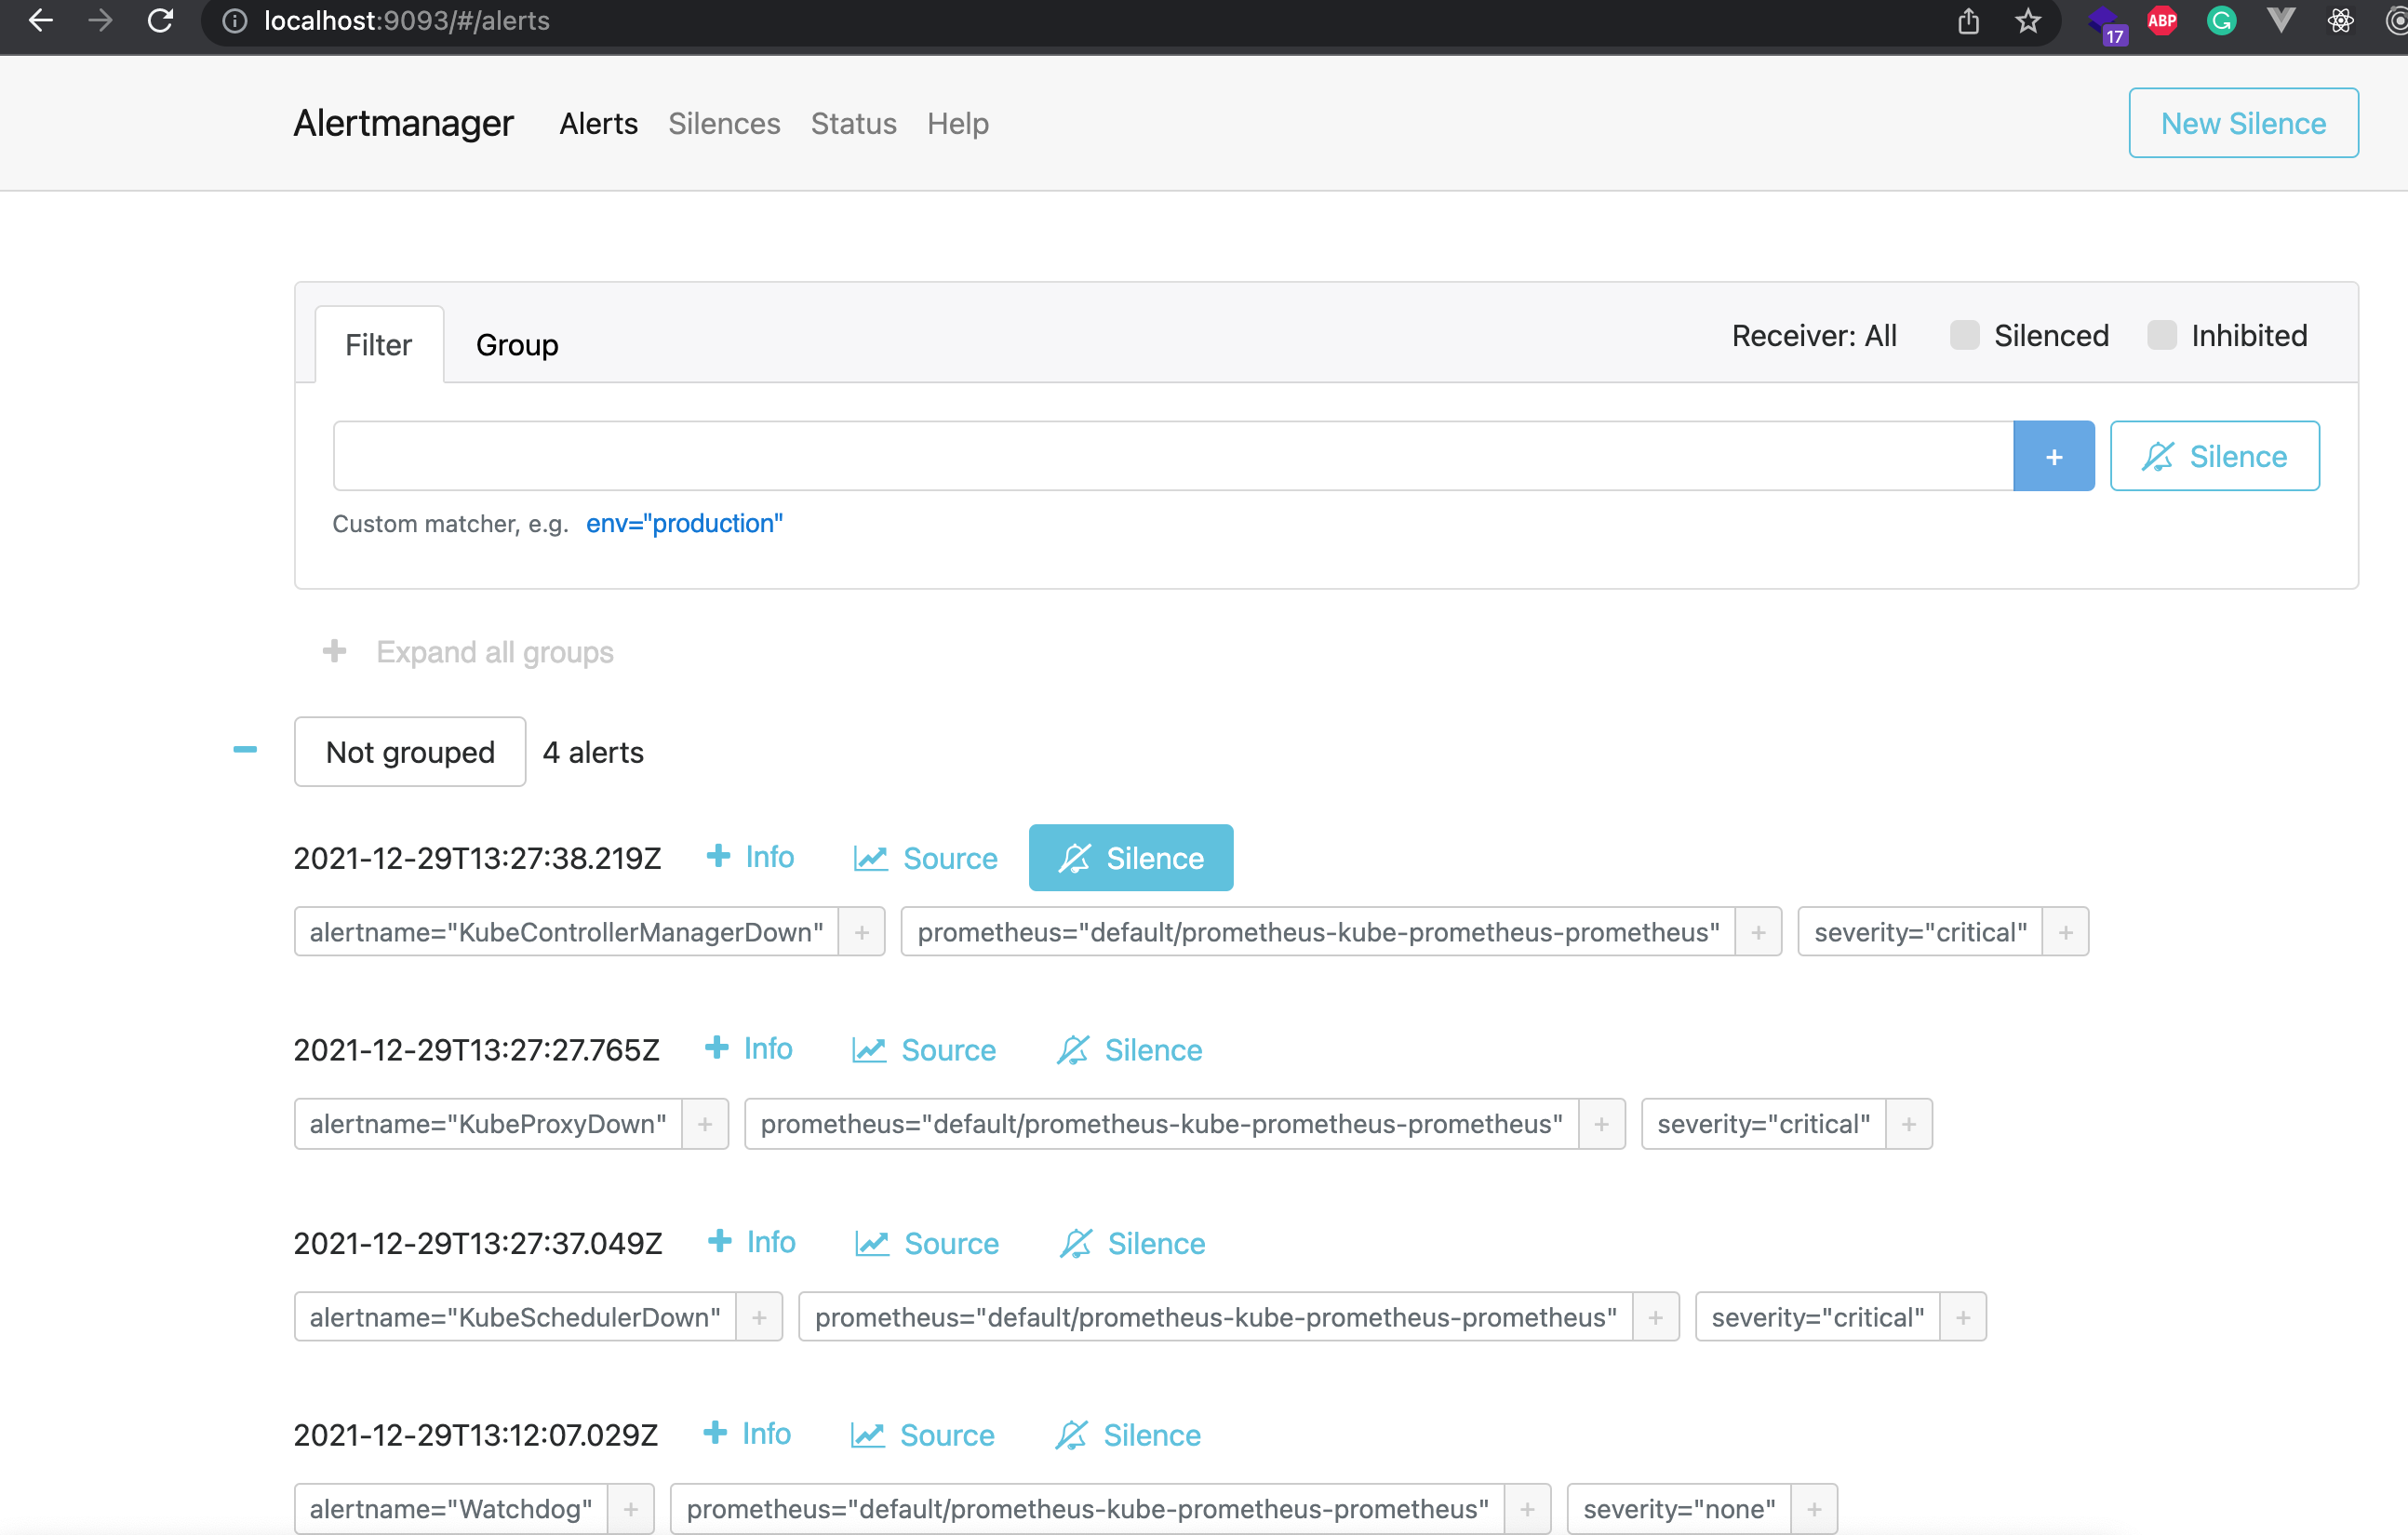
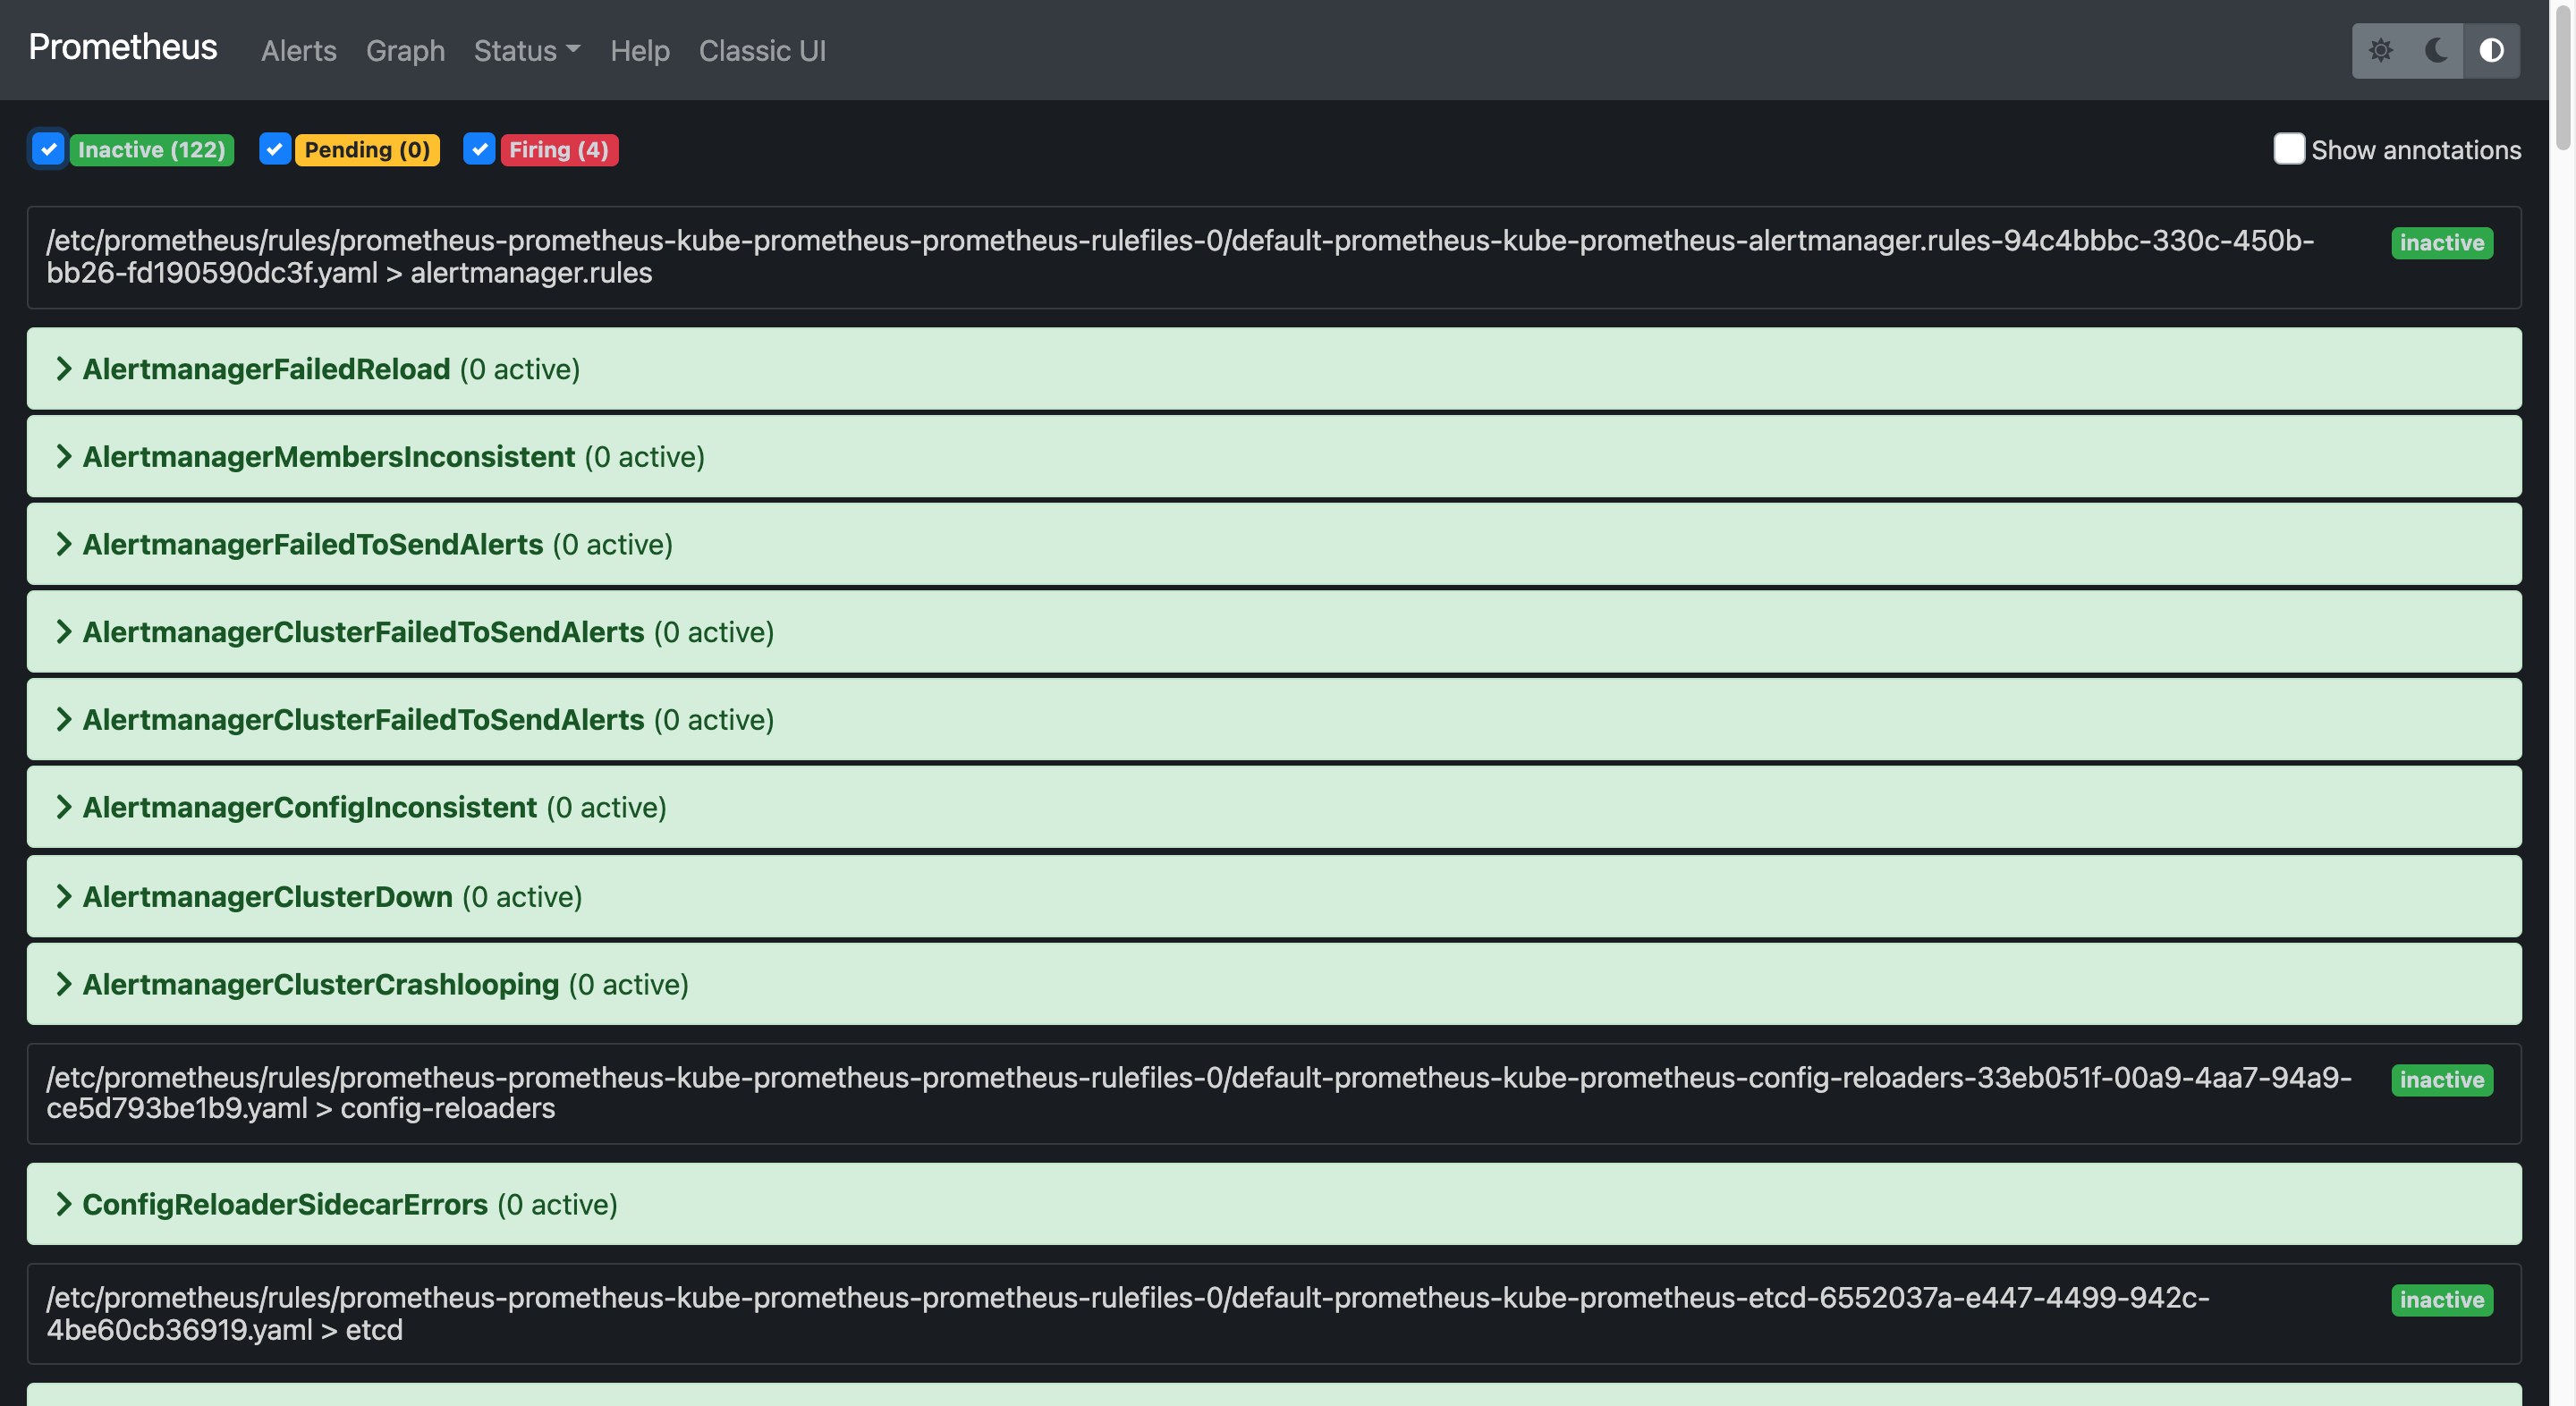
As you can see, Alertmanager comes with numerous alert rules provided out of the box. Prometheus triggers these alerts automatically when the expression rules match the events occurring in the Prometheus server.
To configure your Alertmanager, you have to create a configuration YAML file, then use Helm to apply the configurations.
Configuring Alertmanager to send emails
Create a file called alertmanager-config.yaml with the following contents.
For email testing, you can create a test email on MailTrap to avoid cluttering your default email box with Alertmanager test notifications.
Once you’ve updated the above code with valid SMTP configurations, you’ll use Helm upgrade to deploy the new configurations
Helm will deploy the new configurations for the Alertmanager.
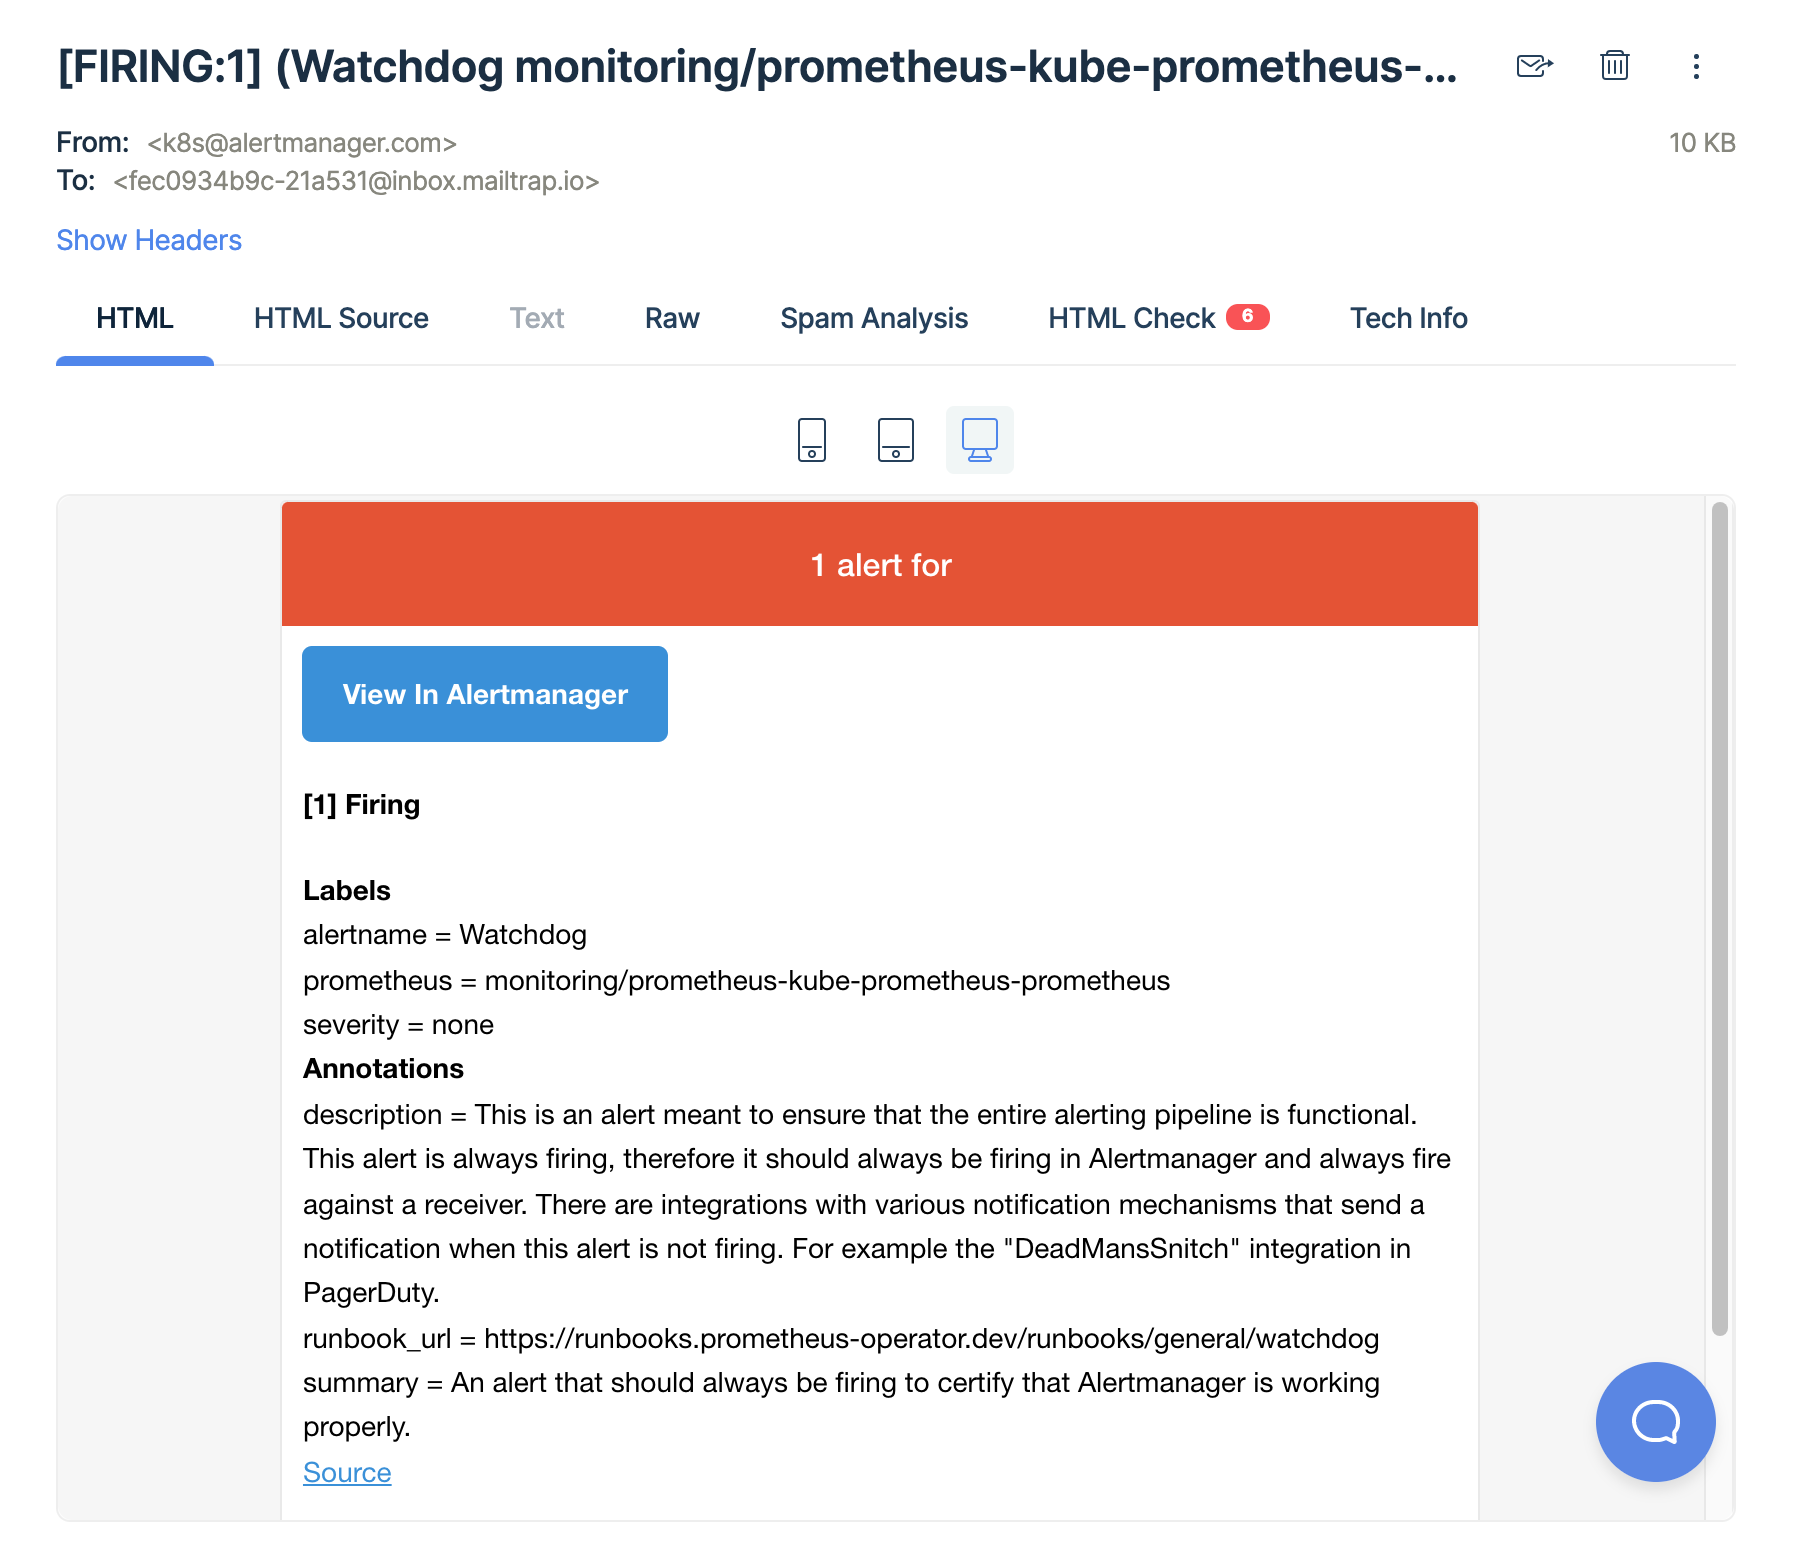
Once the Alertmanager has the updated email configurations, you will receive all alerts that have been pending in the Alertmanager, such as the watchdog alert seen below.
Alert options
In addition to the email option, there are several other options for receiving alerts. You can configure your Alertmanager to send notifications via Slack, WeChat, webhooks, and other services. Here’s an example of a Slack configuration for receiving notifications directly to your Slack account.
You can also configure your Alertmanager to send notifications to multiple channels based on the alert properties, such as severity, alertname, or job. In the example below, Alertmanager sends all alerts with critical severity to the Slack channel, while alerts with warning severity are sent to the email channel
For more configuration information, visit the Prometheus Alert Configuration Page
Triggering alerts
Outside of the default rules provided by Prometheus, Alertmanager will also trigger based on the alert rules you configured. For example, the WatchDog alert we saw earlier is a default rule, and Alertmanager automatically fired an alert because the expression matched the event occurring in the Prometheus server.
To test your Alertmanager configuration, you’ll create some custom rules.
Configuring alert rules
Create a YAML file named alert-rules.yaml and add the following custom rules:
Apply your alert rules:
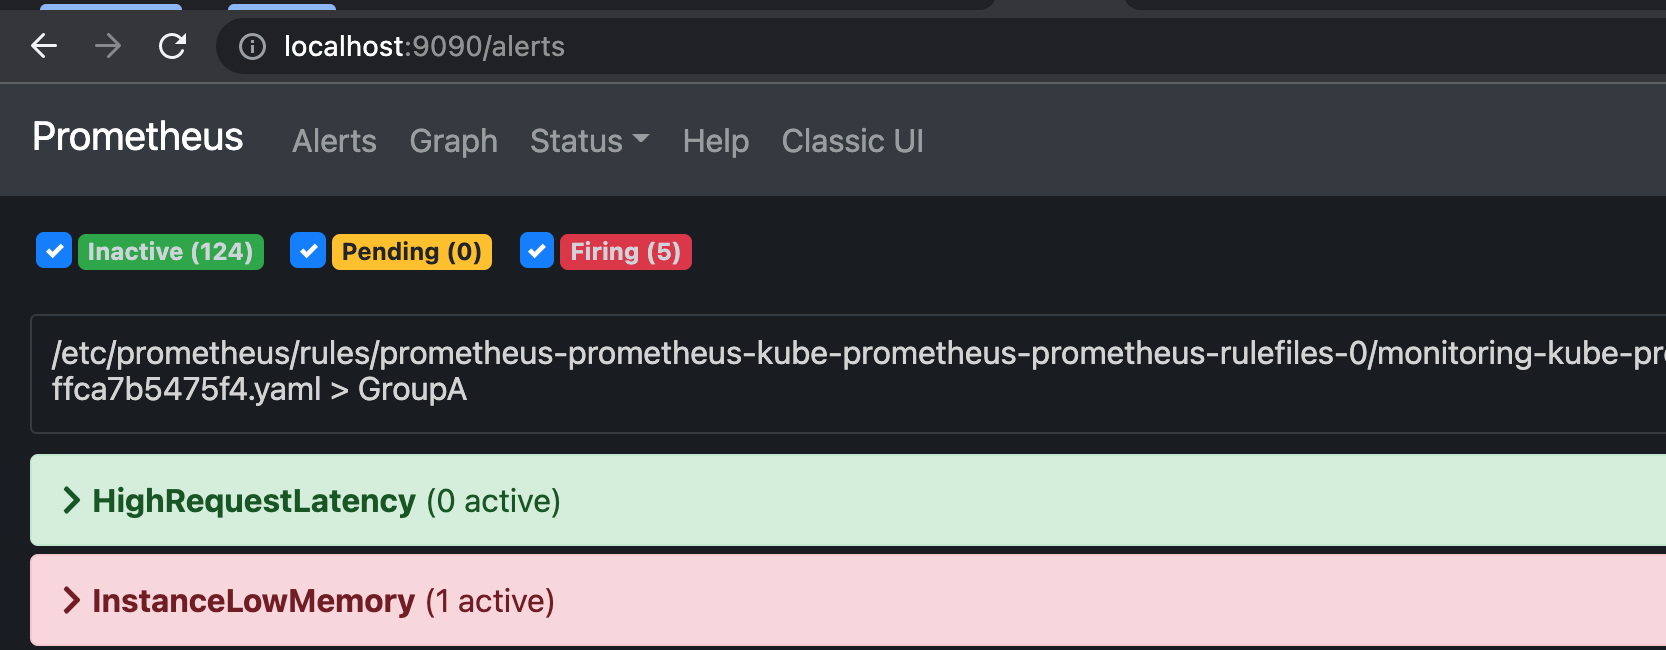
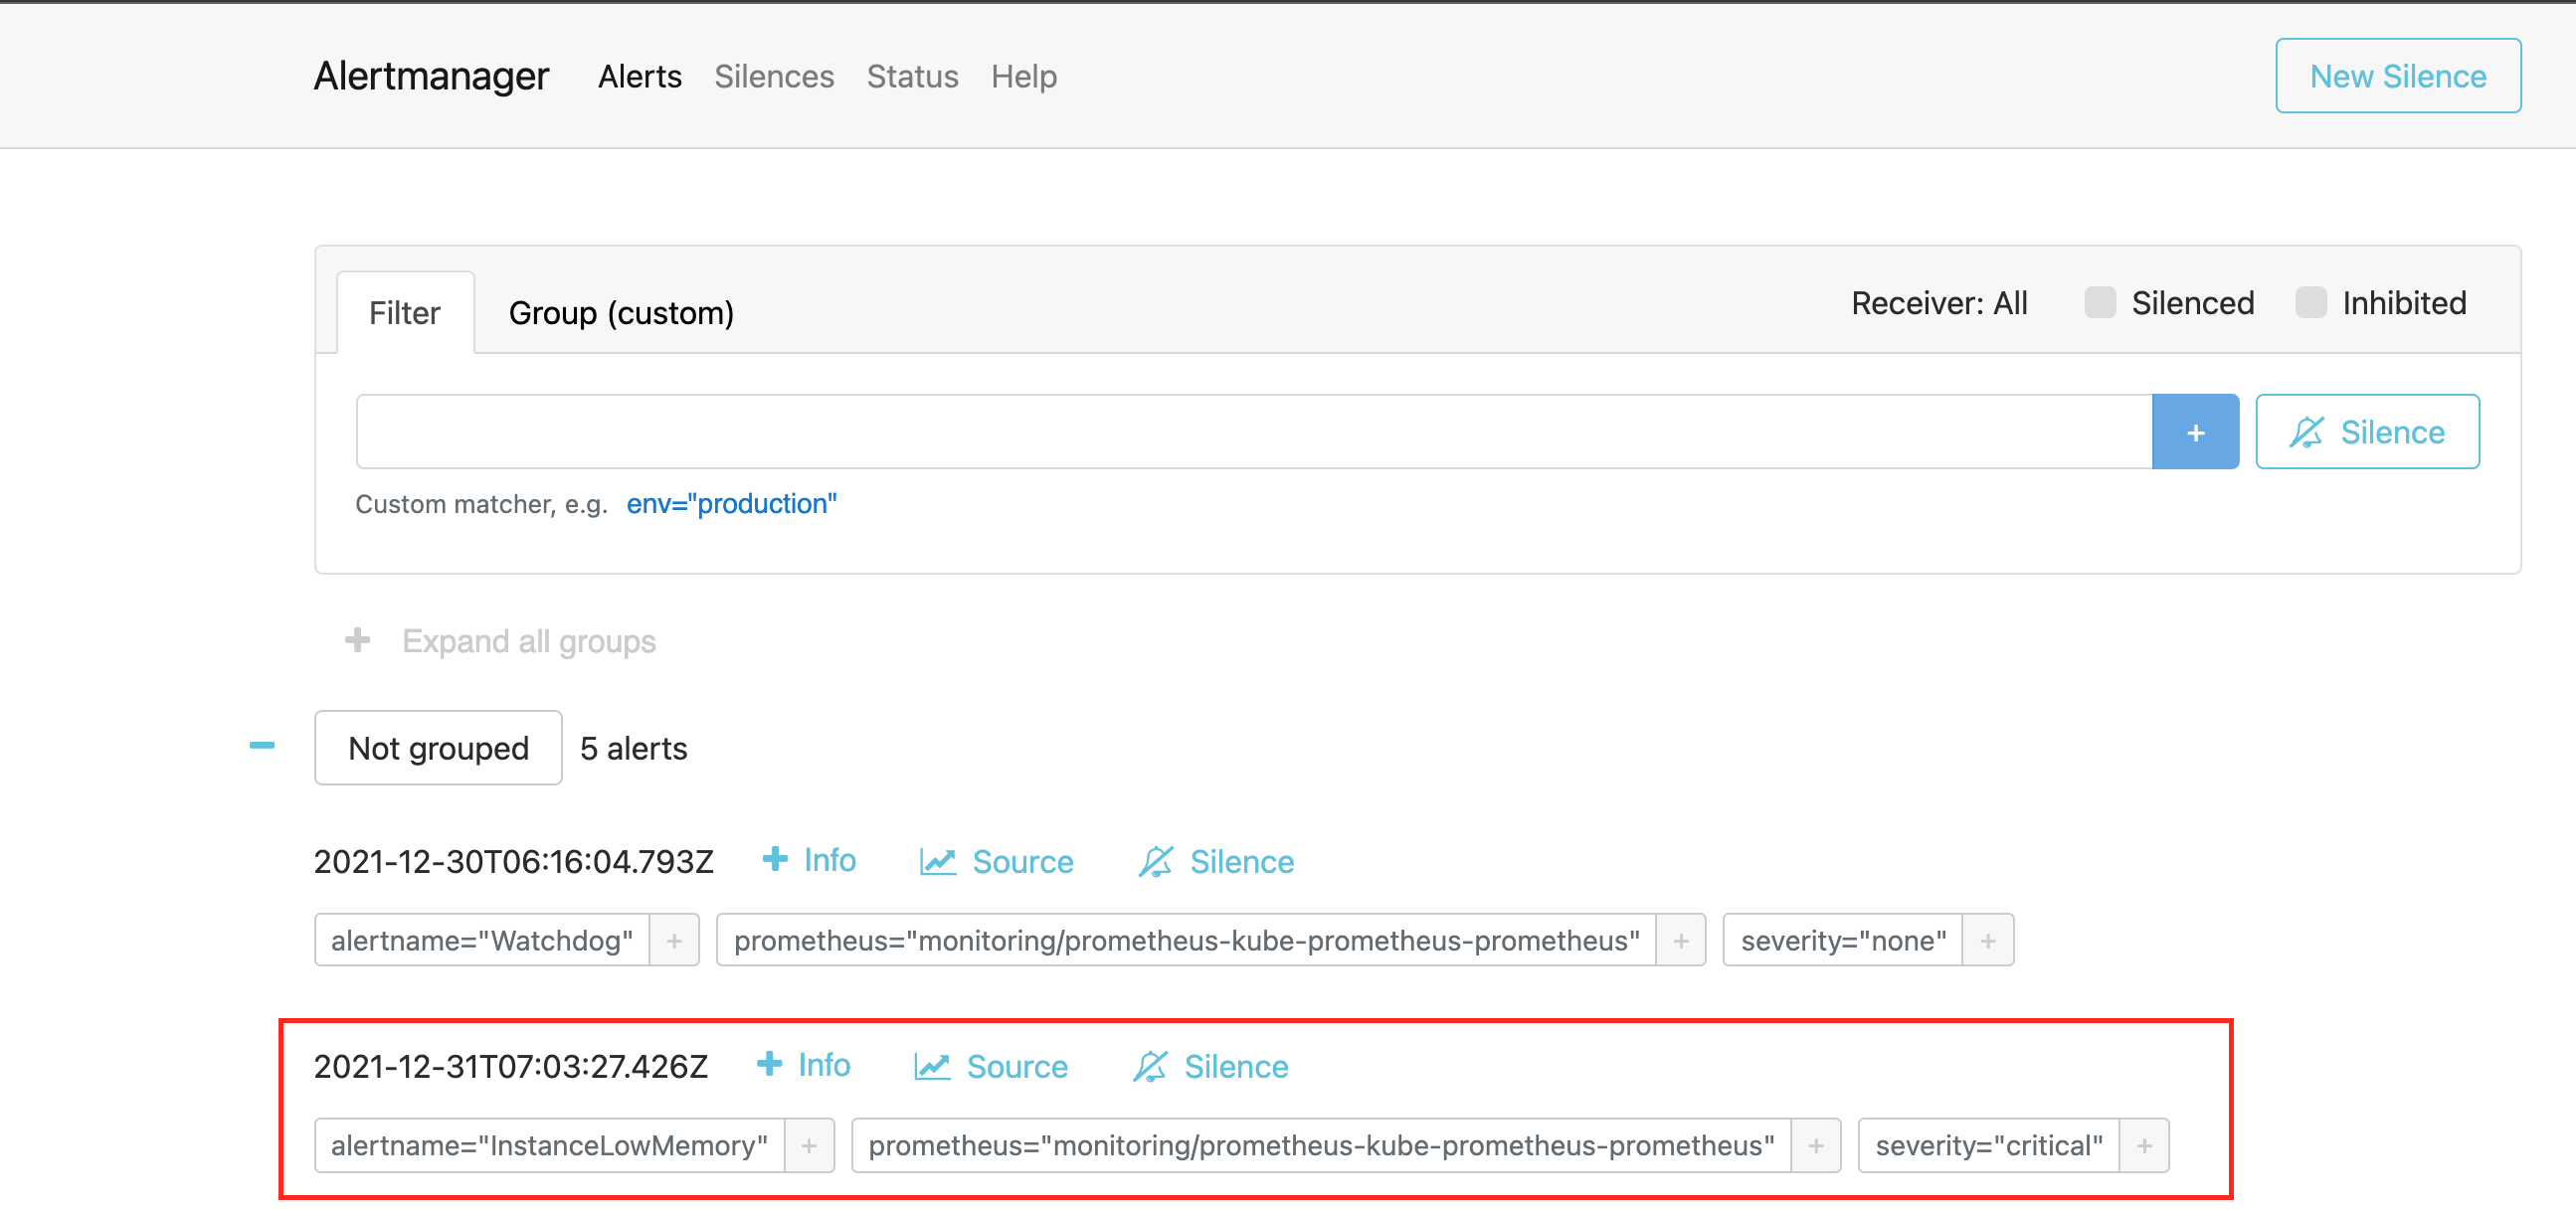
Once you apply your alert rules, the Alertmanager will automatically send a notification of InstanceLowMemory to your notification channels, as seen below.

You can also view the rules in your Prometheus web UI and Alertmanager web UI.
There are custom rules that can be created, such as node out of memory and storage out of space.
Final thoughts
Prometheus Alertmanager is an important tool in your Kubernetes arsenal, and in this article, you’ve learned about some of the benefits of Alertmanager. It notifies you of specific events occurring in your Kubernetes cluster so that you can take action as needed to preserve the integrity of your cluster. Furthermore, you also learned how to install and configure Prometheus Alertmanager in your Kubernetes cluster. Finally, you learned how to configure rules so that Alertmanager notifies you of specific events happening in your cluster.
If you're looking for a maintenance-free platform to monitor your Kubernetes cluster and other applications, then consider using Airplane. With Airplane, you can take existing scripts built in Python, Javascript, bash, and more and turn them into enterprise-grade workflows and UIs that anyone on your team can use. Monitoring Kubernetes clusters in real-time is easy to do with Airplane Views, a React-based platform for building custom internal dashboards. Airplane also offers notifications so issues can be resolved quickly.
To try it out and build your first monitoring dashboard, sign up for a free account or book a demo.


