Kubernetes is a popular open-source container orchestration tool used for monitoring and maintaining cloud-native applications. Kubernetes uses containers to deploy and manage applications rather than virtual machines (VMs) or other hardware.
This creates distinct advantages, especially for applications composed of multiple services or microservices. Kubernetes’ containerized services allow easy, service-level scaling; makes service-by-service deployment easier; and allows individual services to be managed, operated, deployed, and scaled independently from other services.
Kubernetes abstracts the application-server interface, allowing the application’s services to be deployed virtually on a wide variety of hardware systems, without any impact on the deployed image.
These benefits, however, come with disadvantages. Kubernetes-based applications tend to be very dynamic. The exact number, type, and location of individual service containers tends to vary considerably.
Because the servers used to run these services are abstracted from the services, problems in the server layer tend to become distorted in the service layer, and service problems tend to be distorted when observed from the server layer.
This differs from a traditional application running on servers, where the application services run directly on the server operating system, rely on those capabilities, and leverage the operating system to operate in the desired manner.
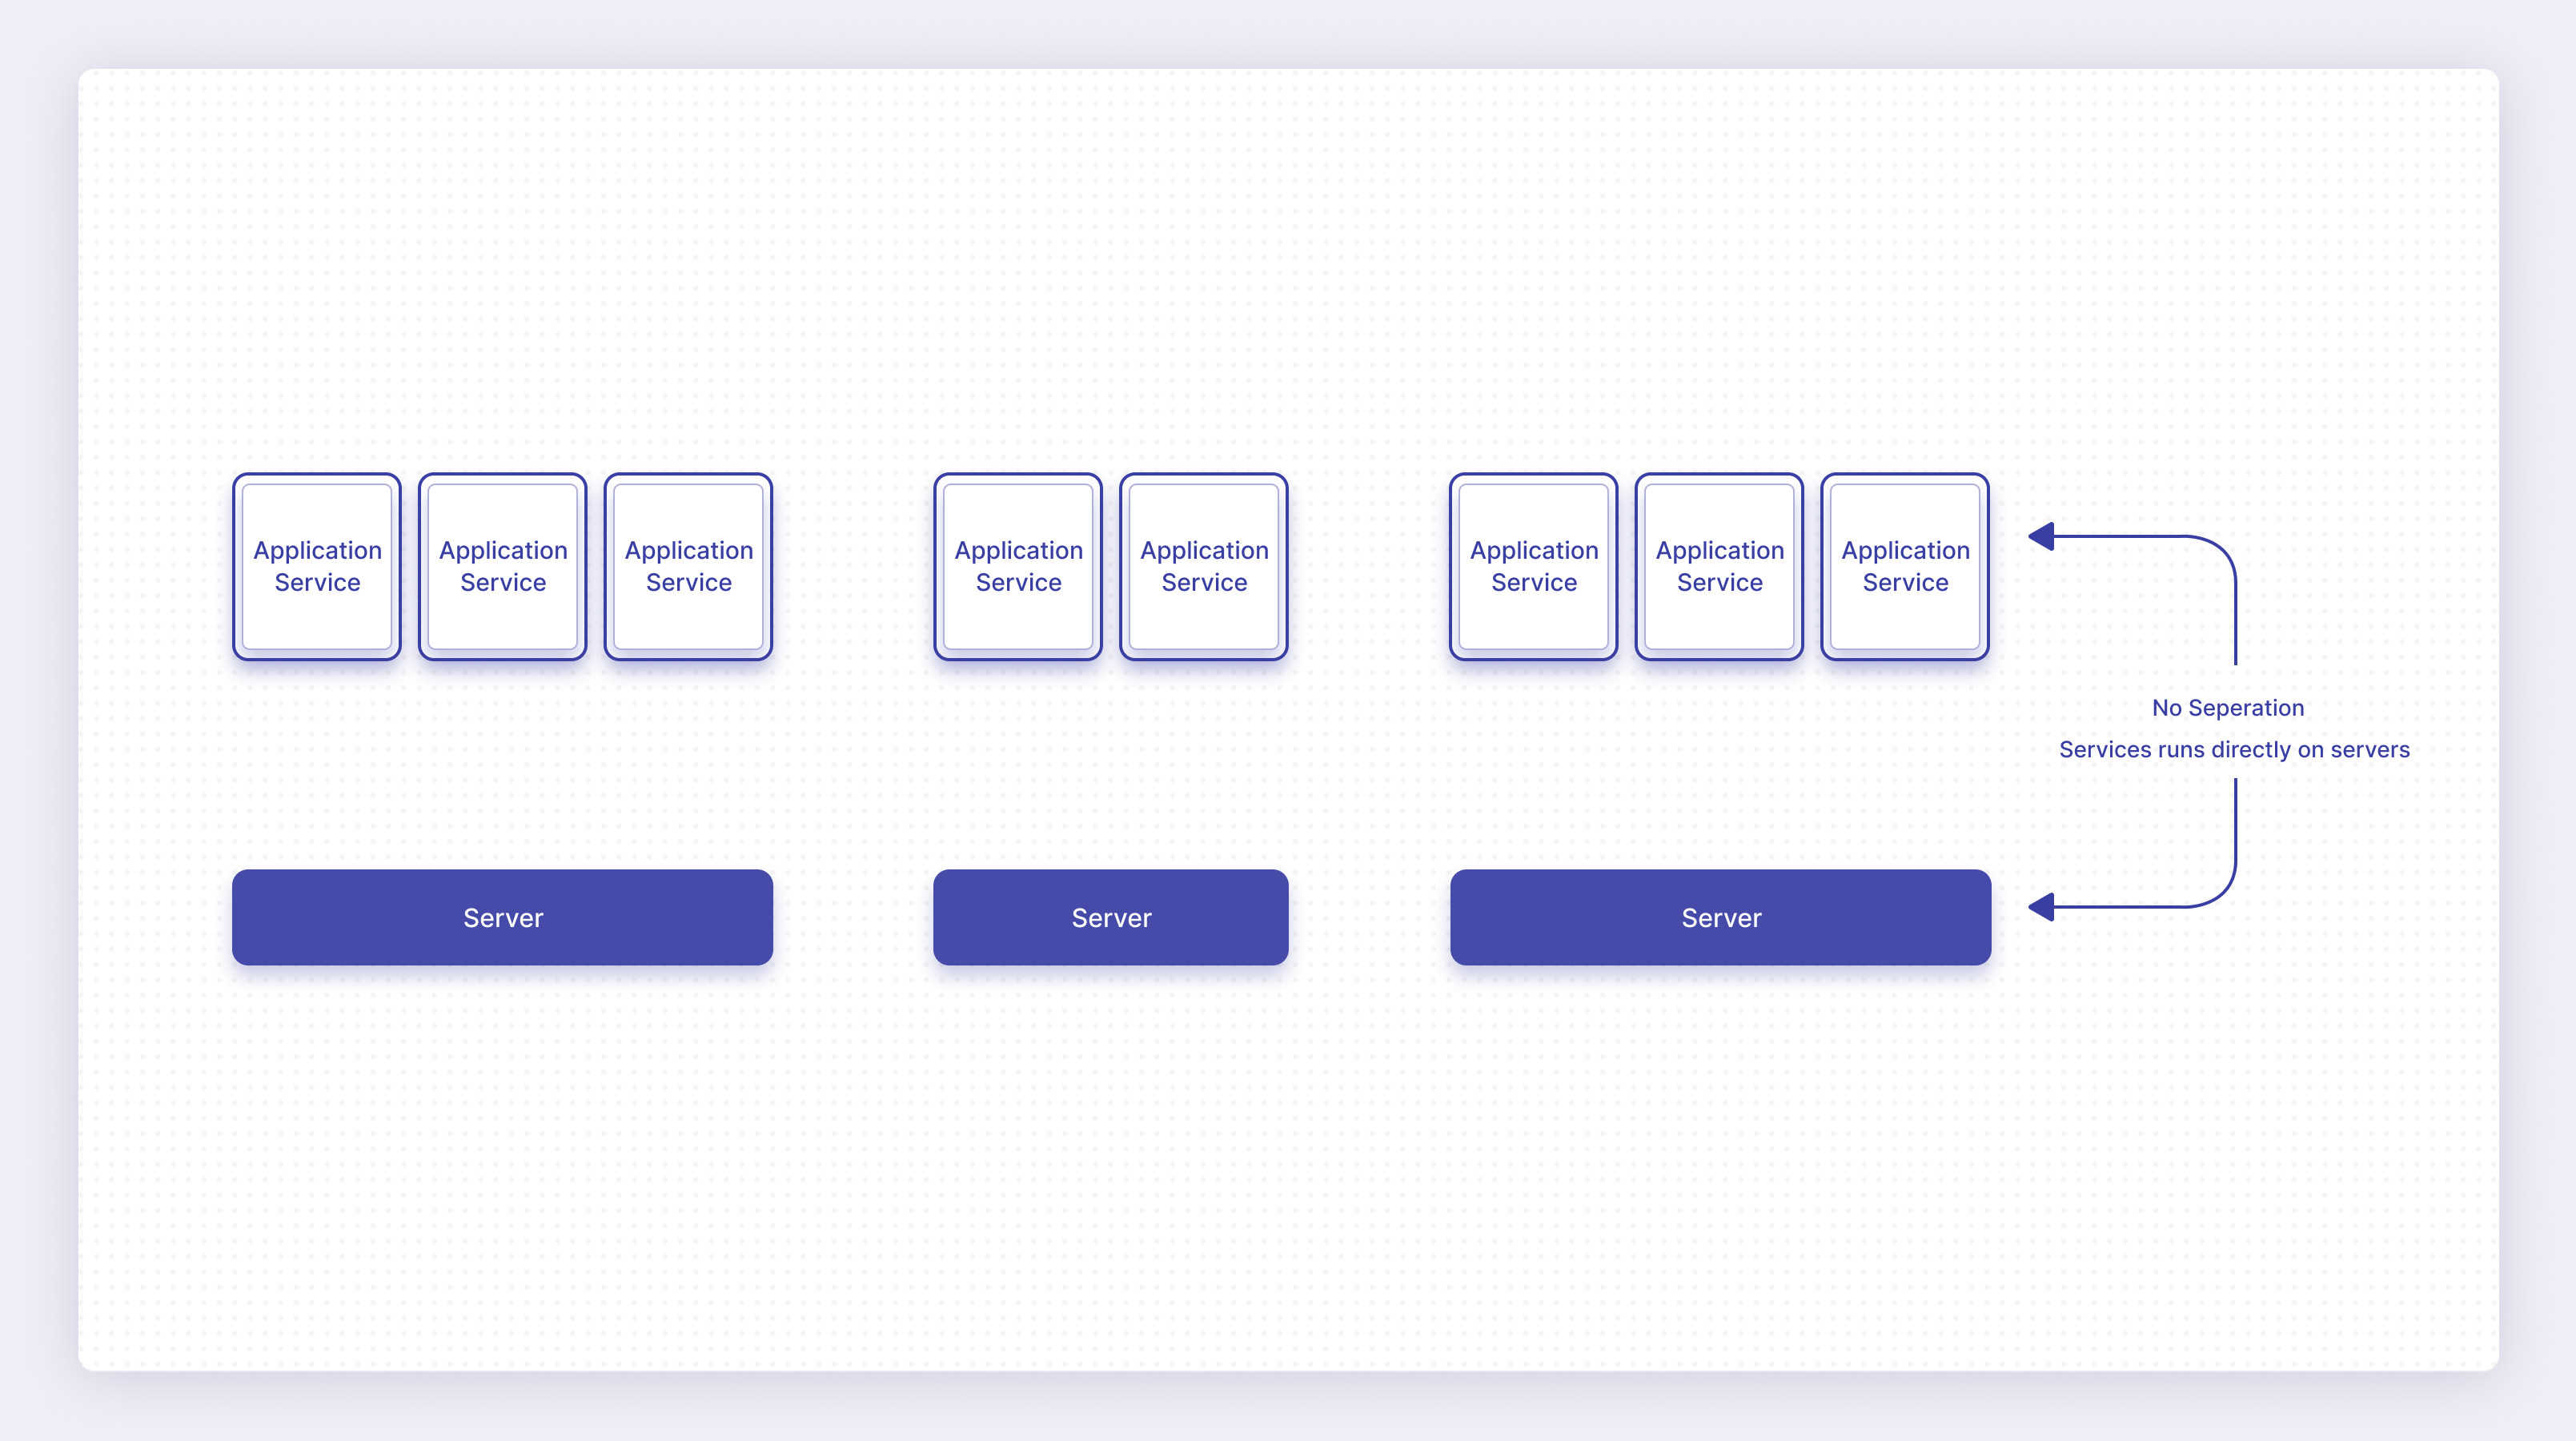
This virtualization distortion makes monitoring the application and its services—and the underlying servers running the application—more complicated than a traditional application-server combination.
While there are other virtualization separation technologies that exist between physical servers and application services, Kubernetes creates a high degree of separation between the two. This separation is one of the advantages of Kubernetes, but can create challenges when it comes to monitoring.
Facing the challenges
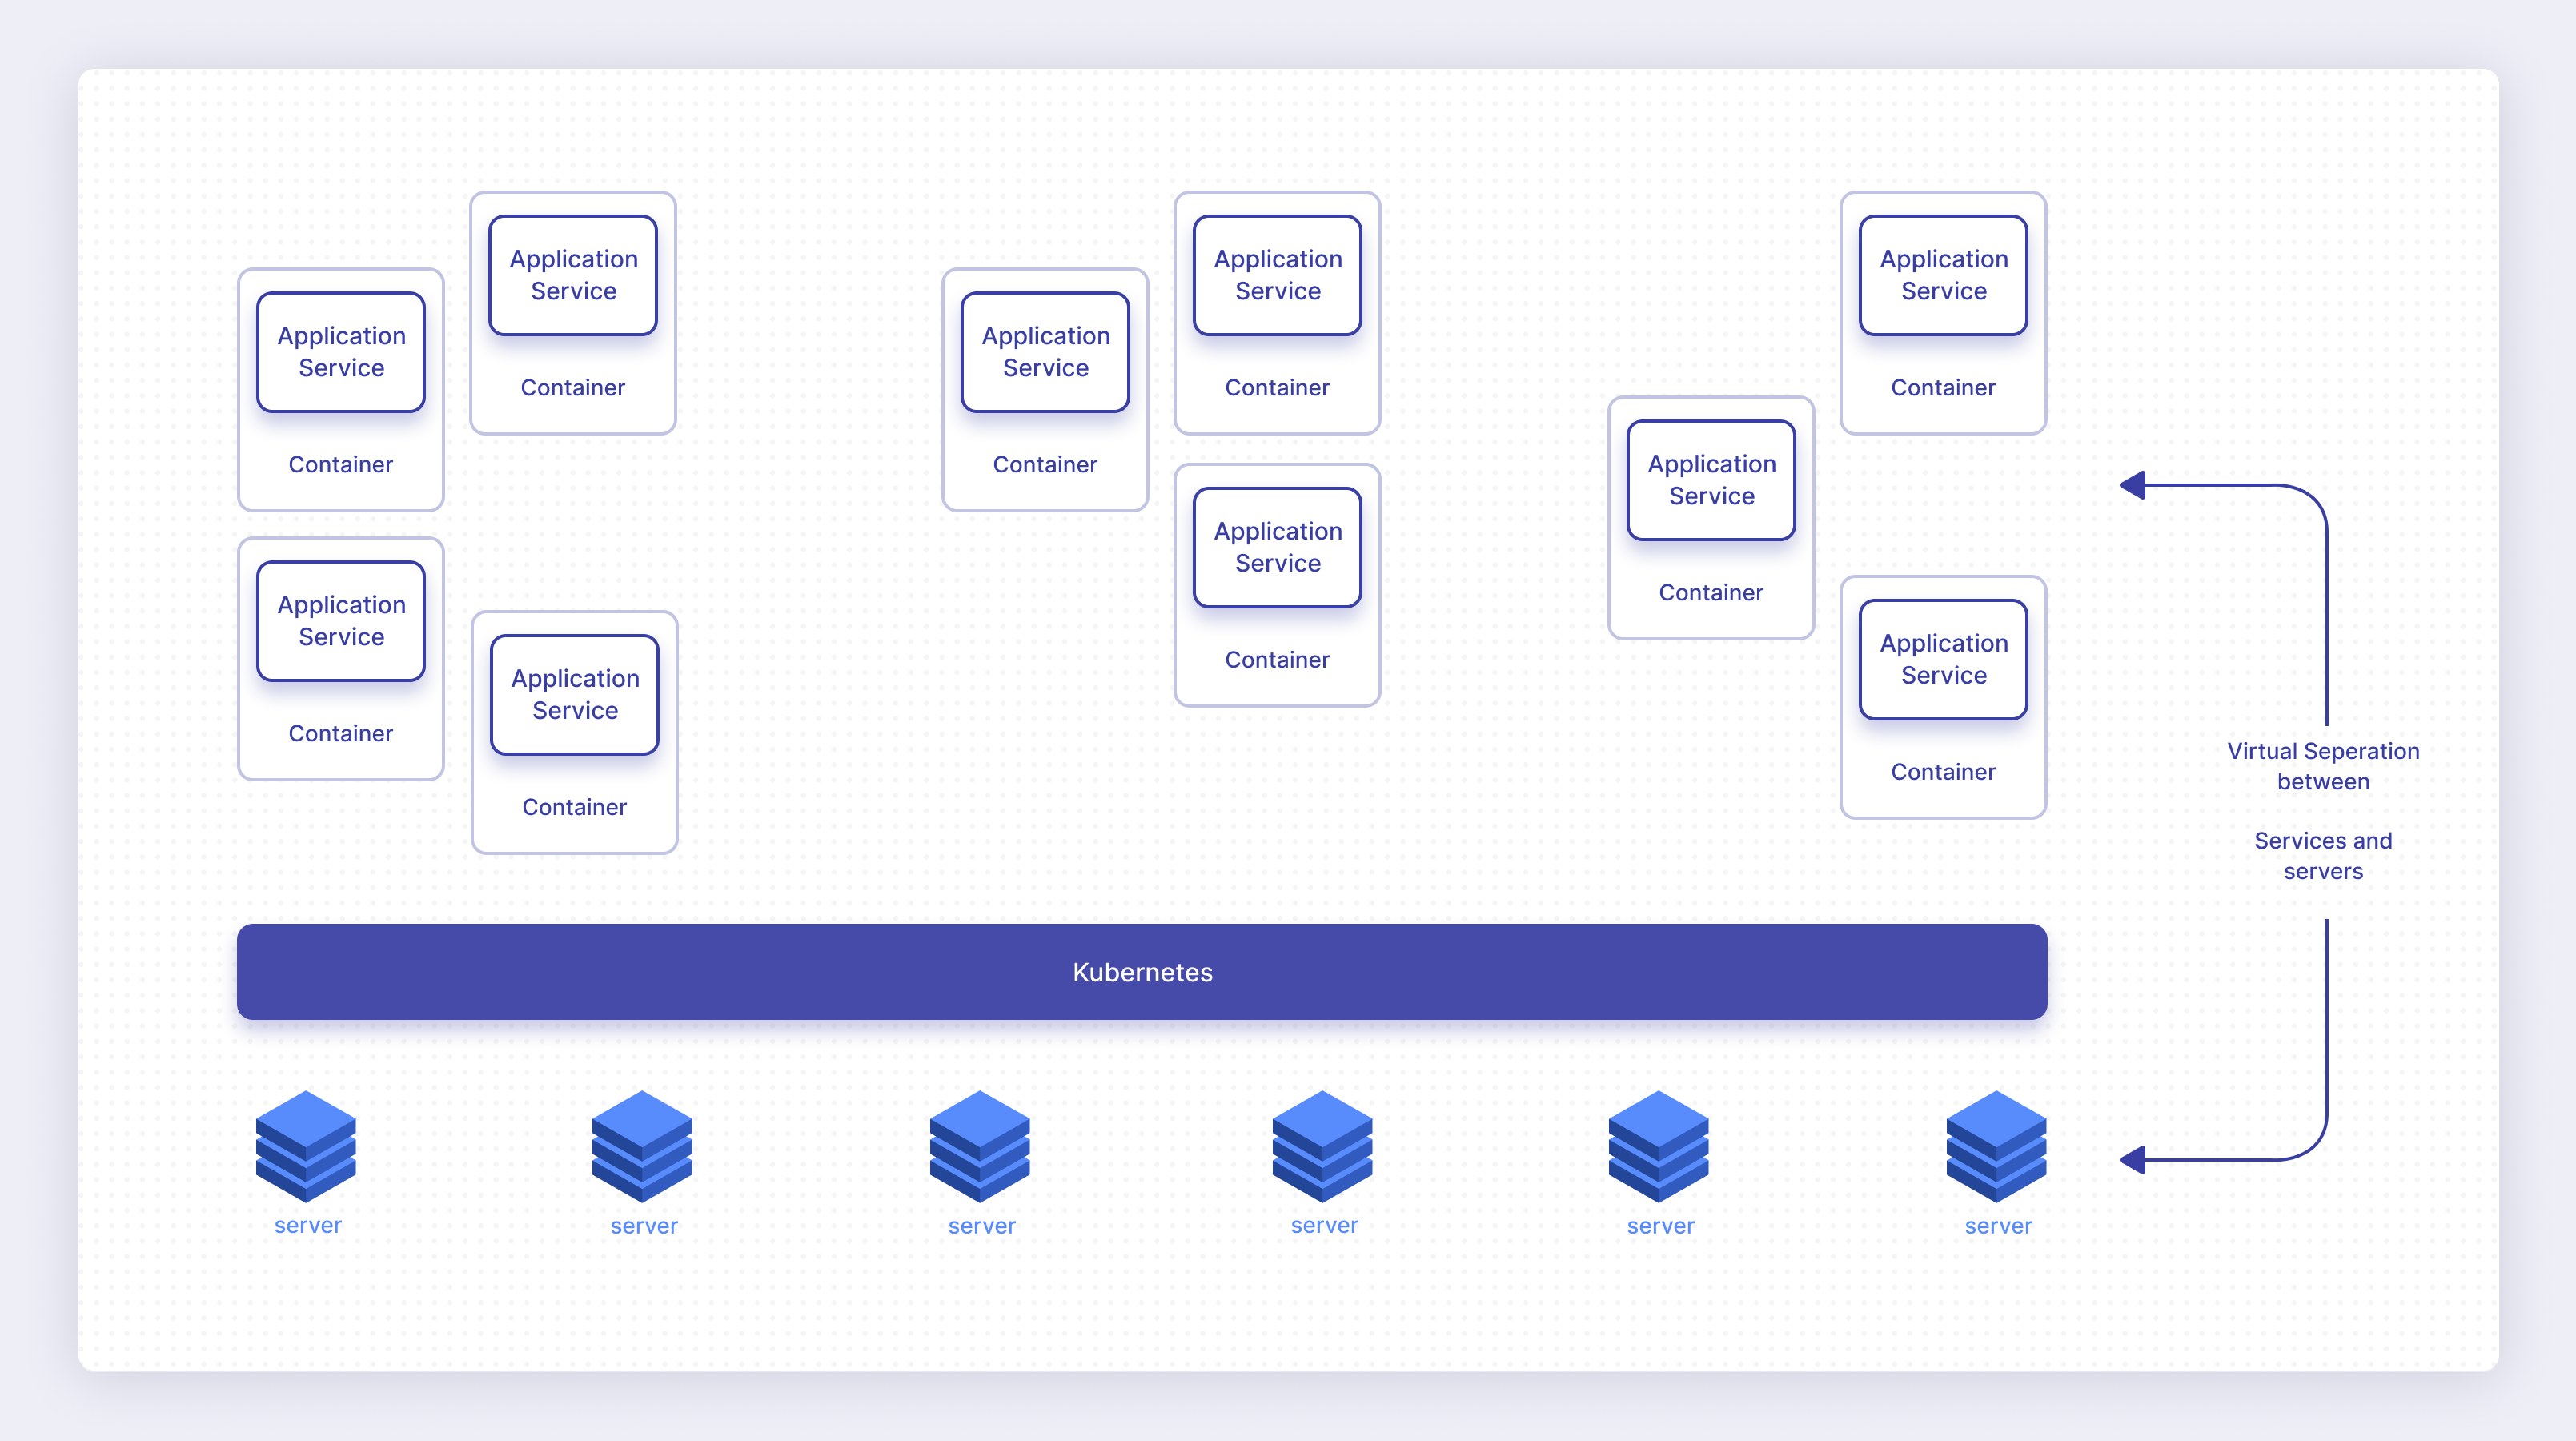
In order to successfully monitor an application running in a Kubernetes cluster, you need the tools to monitor the various levels of Kubernetes involved in operating an application. To do that, you must first understand the layers of Kubernetes. Let’s start by looking at the various layers that make up an application running on Kubernetes, as shown in the following figure.
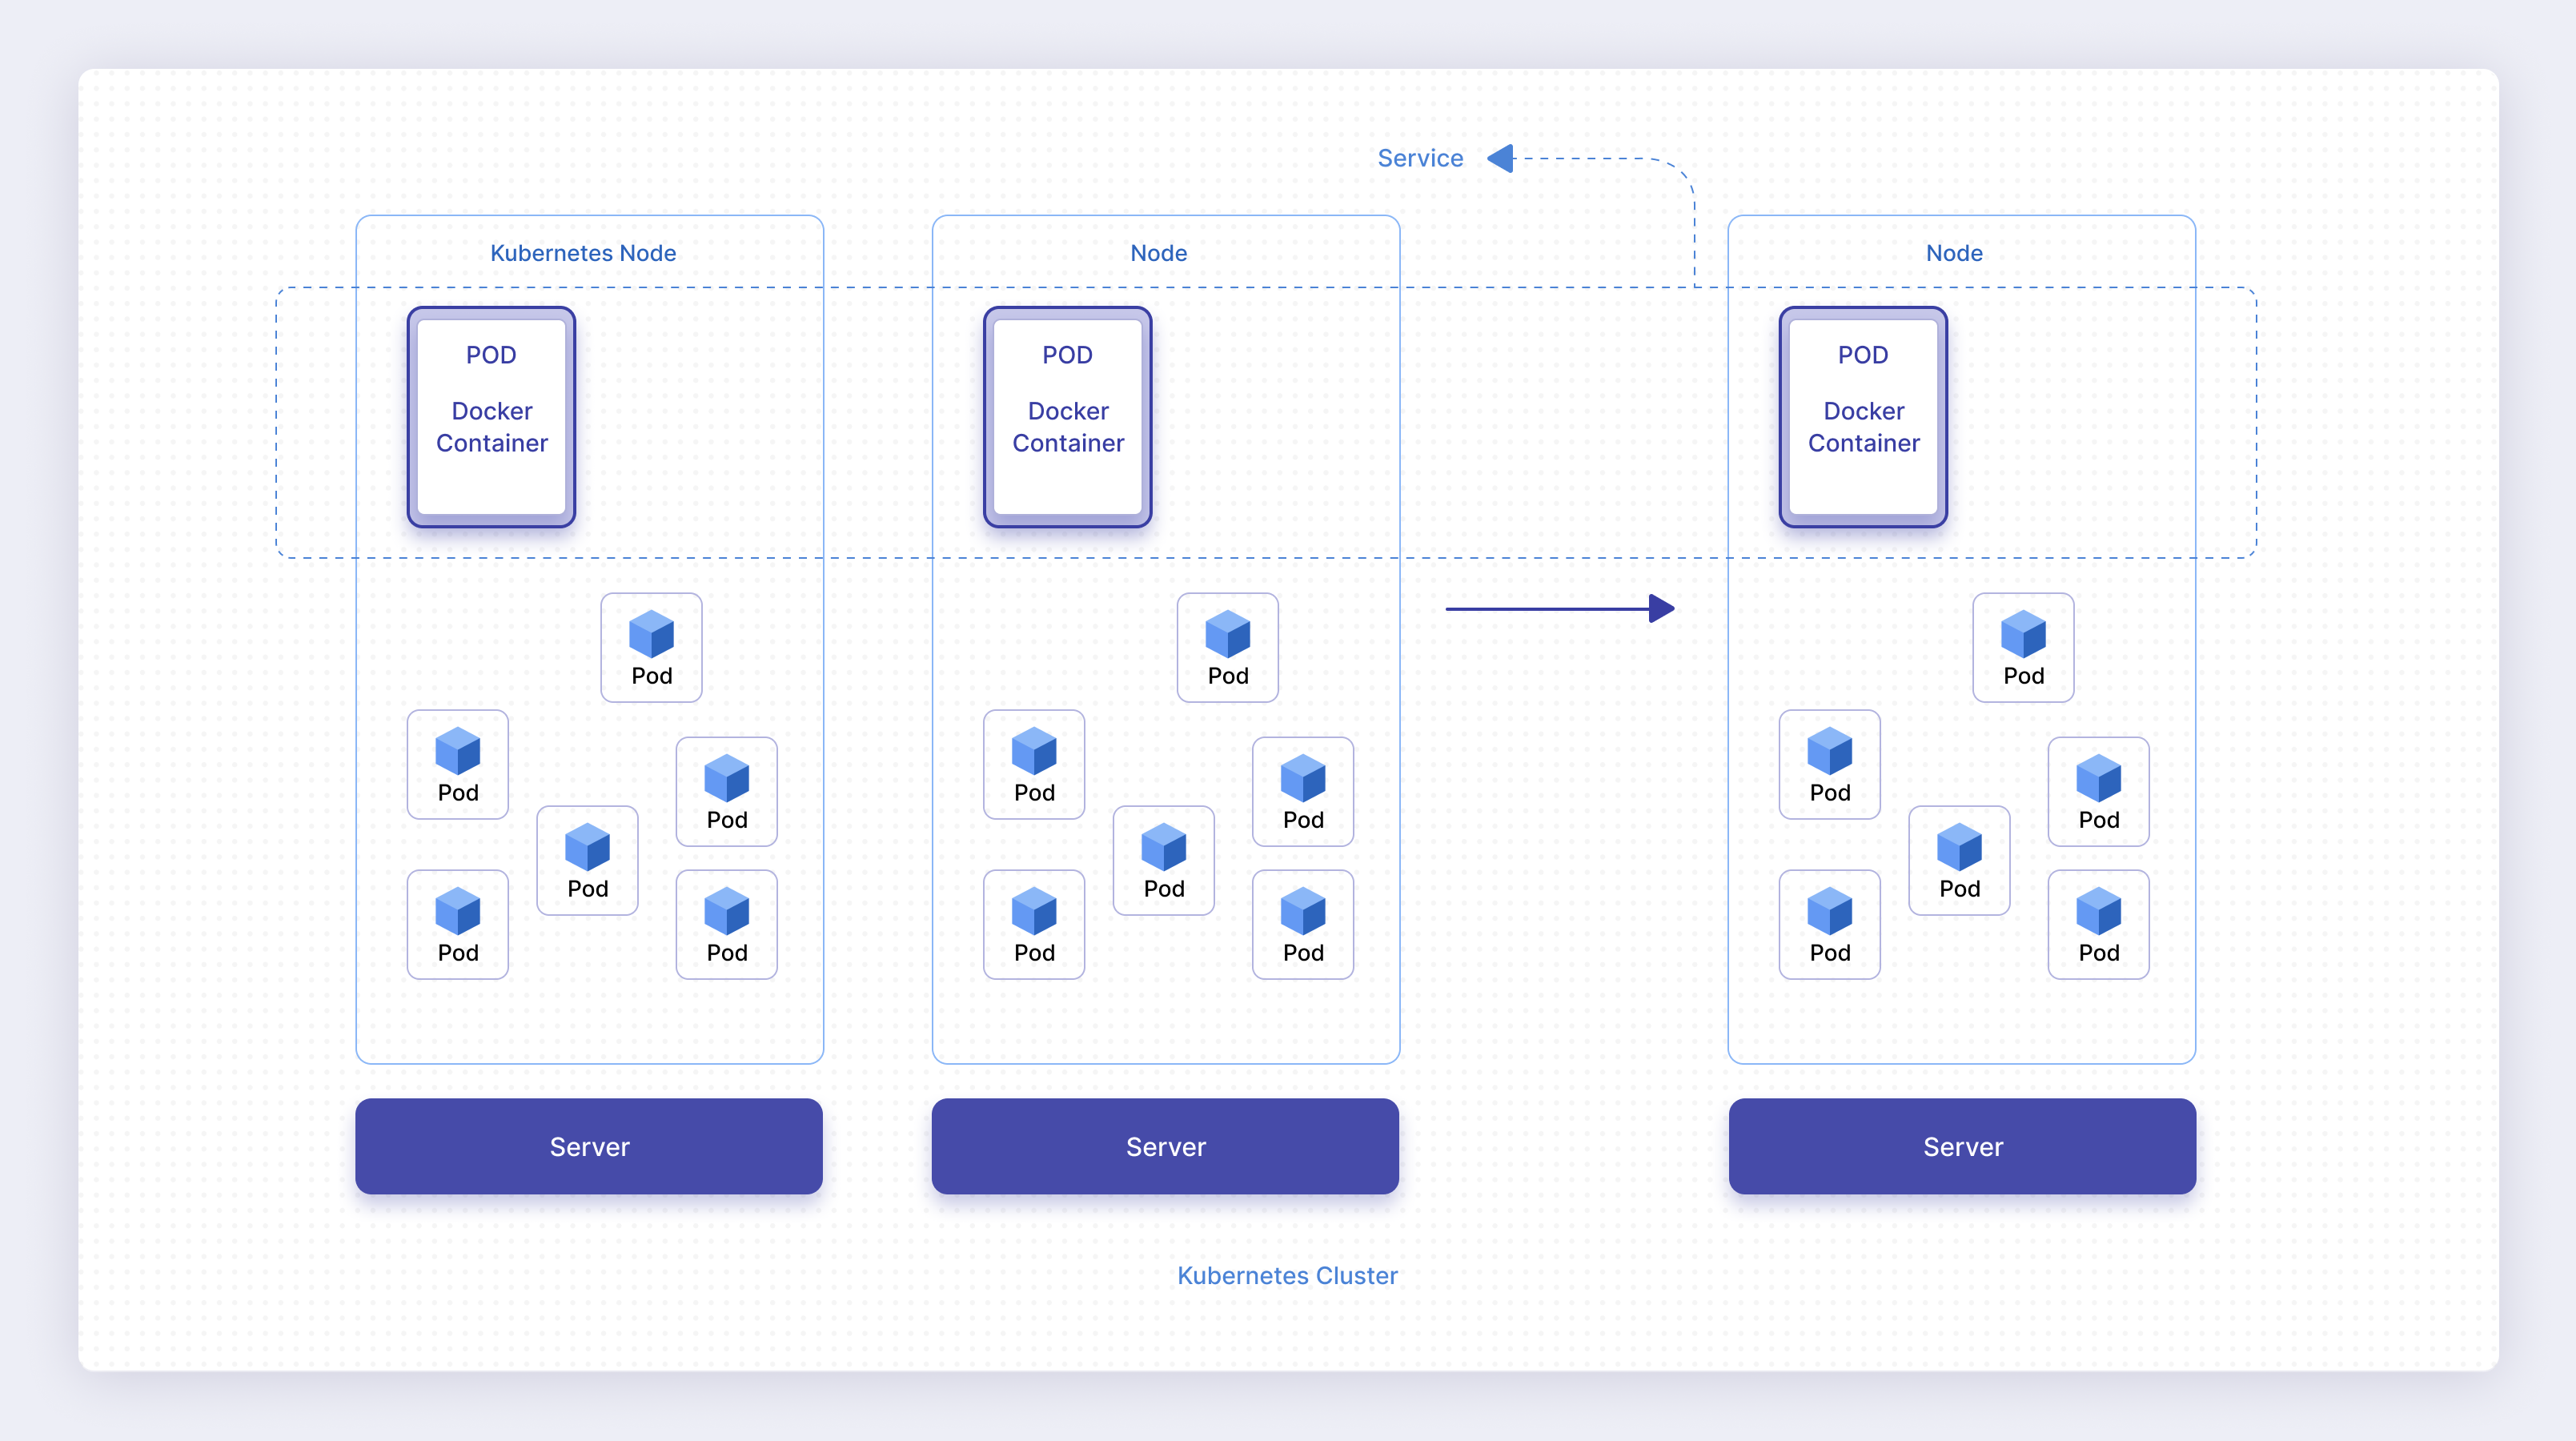
In Figure 3, you’ll see a typical view of the components of an application running in a Kubernetes cluster. The various layers are:
- Server. The server is the underlying computer that’s running the software. This could be a physical or virtualized server.
- Node. A node is a virtualized representation of the server in Kubernetes. A single node runs on a single server. There are as many nodes as there are servers in the cluster.
- Pod. A pod is an instance of a software component running on a single server. There usually are many pods running the same software for the same purpose, and there typically are many pods running on a single node. Typically, an application service consists of multiple pods, each running the code for that service.
- Service. A service is a virtualized group of related pods. A Kubernetes service typically corresponds 1-to-1 with an application service.
- Application. The user application consists of one or more services.
Each of these components has a very specific relationship with one another. As shown in Figure 4, a single application is composed of multiple services, and those services are each composed of multiple pods. Each pod runs on a single node, but different pods within a single service will typically run on different nodes. A node will typically run multiple independent pods.
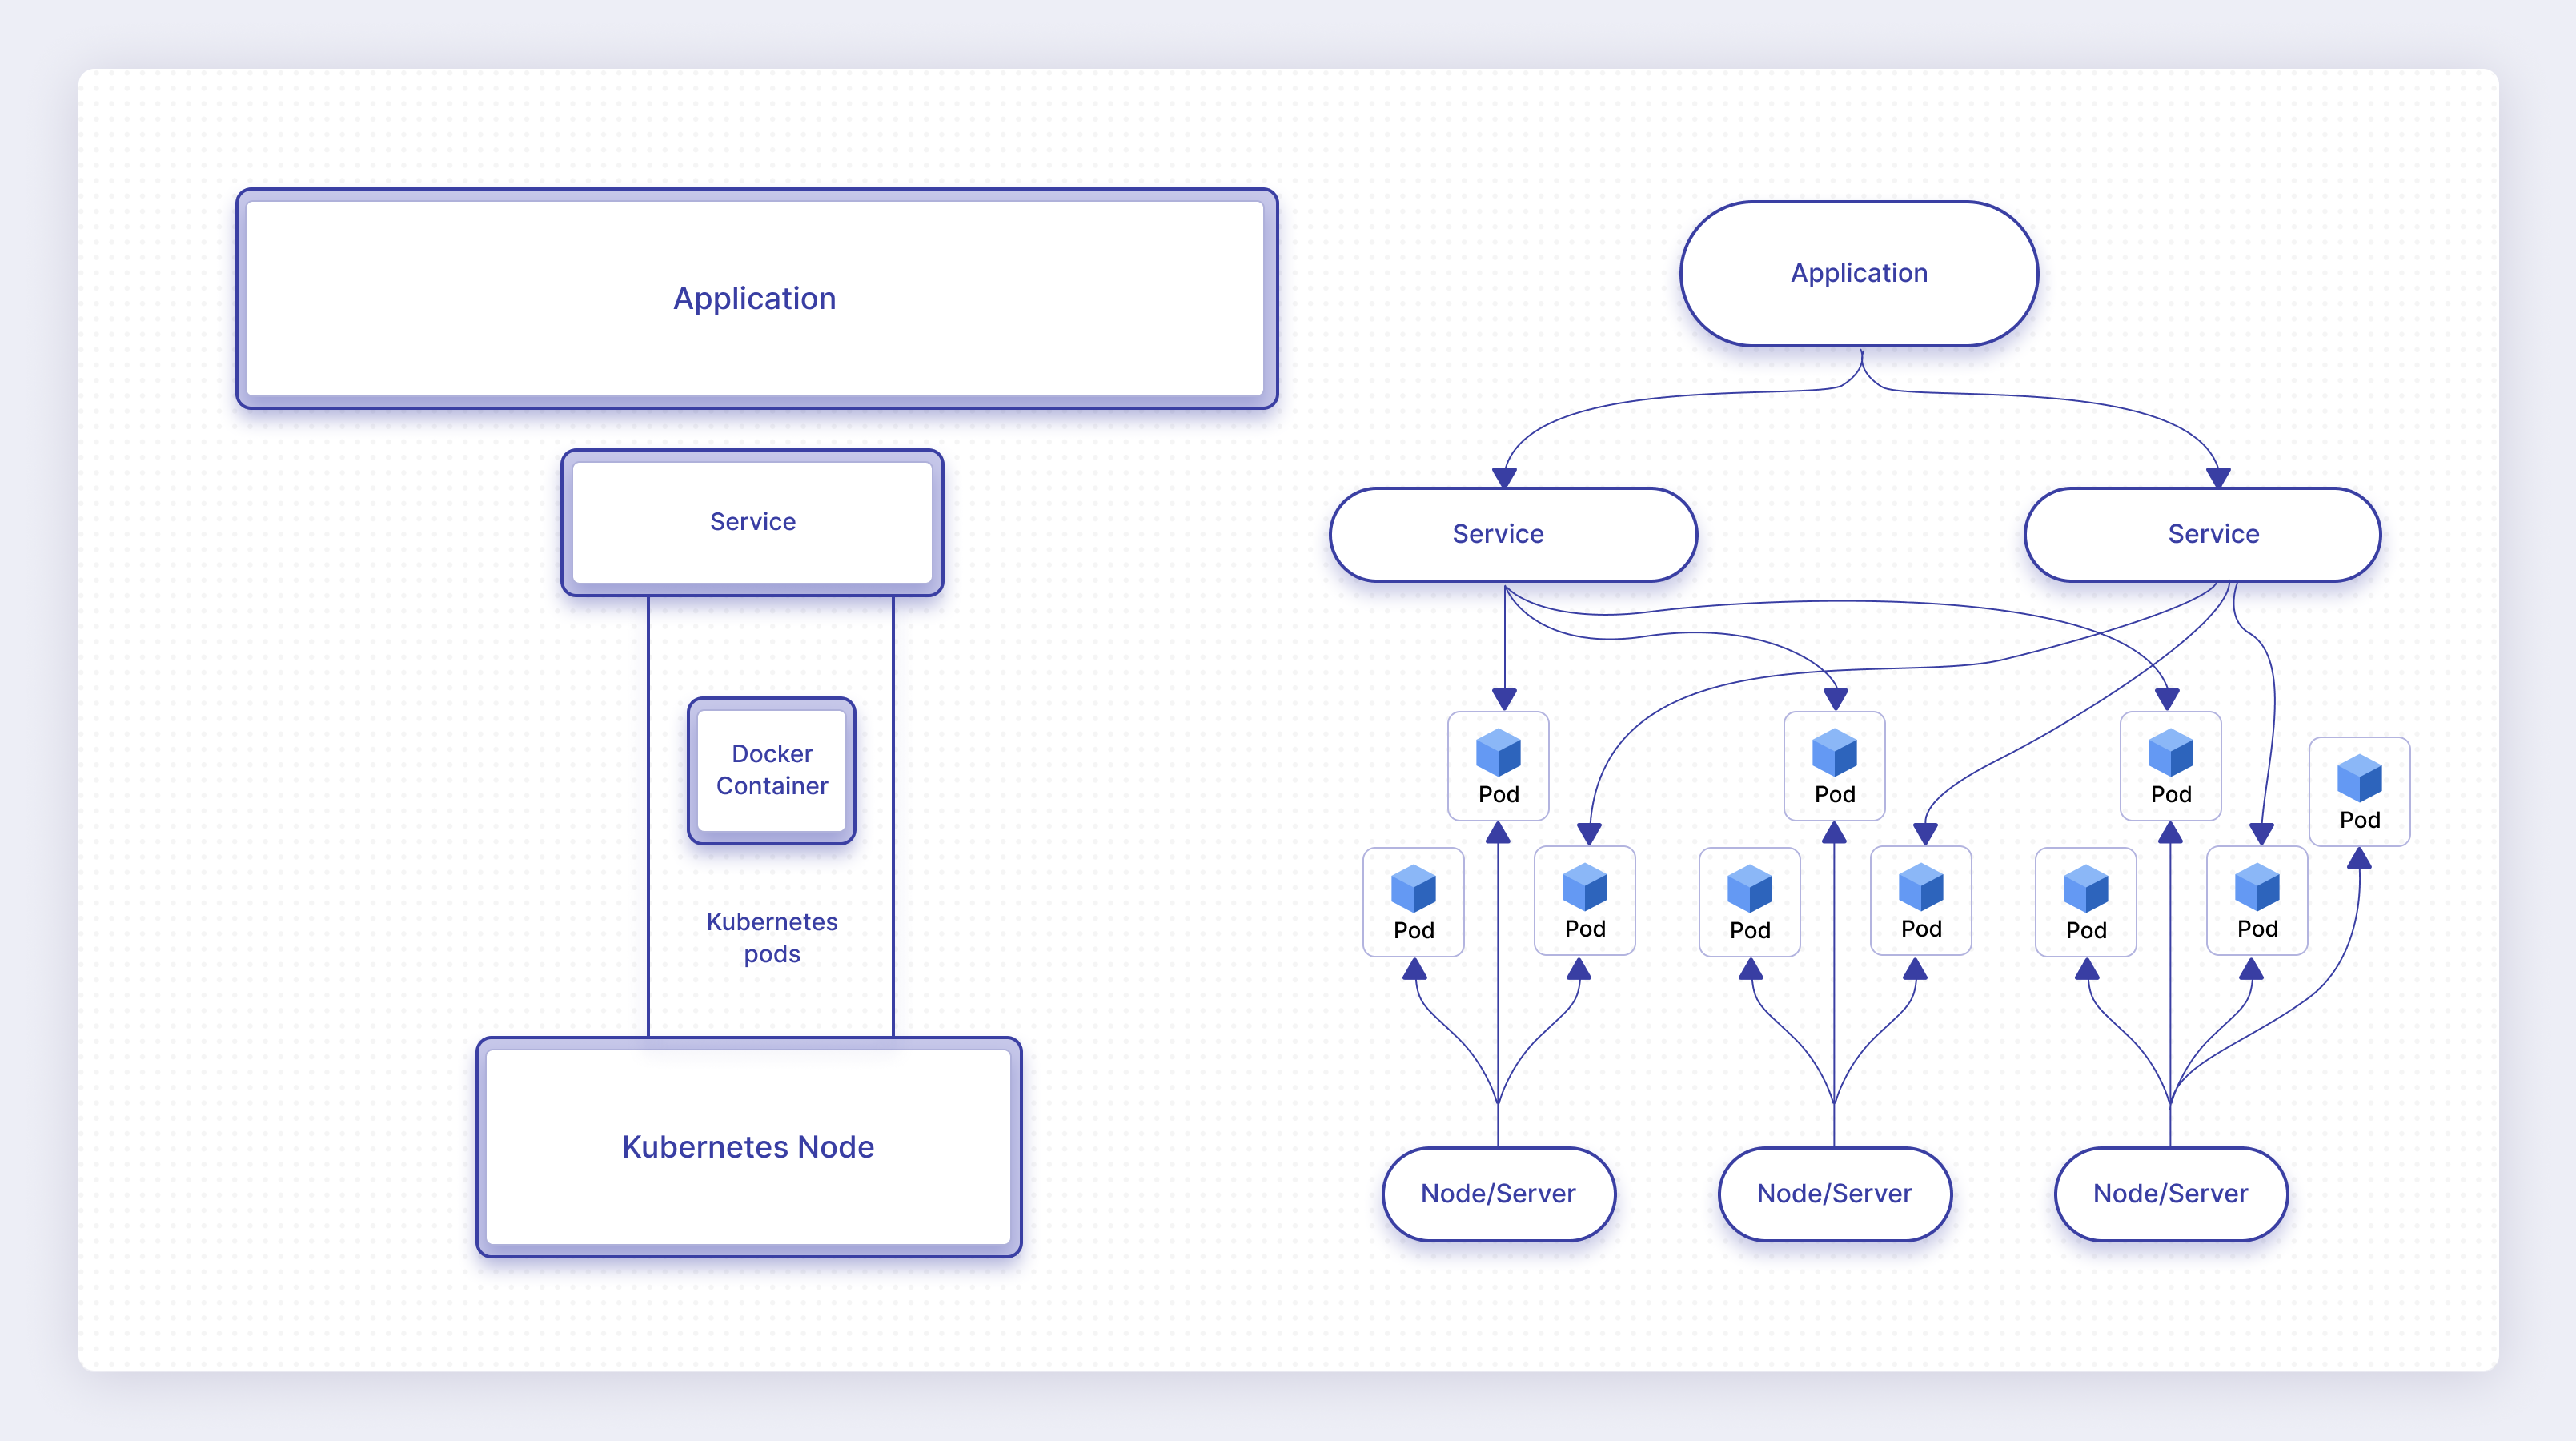
It may appear that there is no correlation between the pods that are part of a specific service and the pods that run on a single server. This is because any pod can run on any node, independent of what service it is a part of. However, typically, pods for a given service are distributed across multiple nodes for high availability/redundancy purposes.
Additionally, pods can typically be started, stopped, and restarted multiple times during the course of operating an application. As the load of a service increases, additional pods can be spun up to handle the additional load. As traffic decreases to a service, pods can be terminated to free up resources for use by other services.
Additionally, new nodes may be added to the cluster to give the entire system additional capacity. When not needed, nodes can be removed from the cluster and the corresponding pods removed from use. If a node fails, the pods on that node are removed and re-created on other nodes.
All of this results in a very dynamic system. Because the system is so changeable, it can be very hard to monitor the application operating environment.
Three-layer k8s monitoring strategy
Typically, a basic three-layer monitoring strategy is used to monitor an application running on a Kubernetes cluster. The three basic layers are:
- Application/service layer. Application performance monitoring tools, such as Dynatrace, New Relic, and DataDog, all have application performance monitoring (APM) capabilities that are used to monitor the application and the application services directly. These APM tools provide monitoring metrics, such as call latency, call performance, call traces, error rates, and error call stacks. Additionally, application dependencies can be monitored as well, such as databases and SaaS services.
- Server layer. Server performance monitoring tools are used to monitor the host servers themselves. They can be used to determine the load on the servers, and when additional servers may need to be added to the cluster or, alternately, when excess capacity can be removed from the cluster. They also can be used to diagnose server-level failure modes, such as abnormal process termination, memory overruns, over-consumption of resources, and runaway processes. Typical metrics monitored include values such as CPU utilization, percent memory used, disk space used, network usage, etc. New Relic and DataDog are powerful and popular server monitoring solutions.
- Kubernetes layer. These are tools that monitor the performance of the Kubernetes cluster itself. They provide capabilities such as: How many pods are running on each node? How many pods are running within each service? Are the pods responsive and operating reasonably? How many resources (memory, disk, CPU, etc.) is each pod consuming? What’s the rate of pod startup and pod failure?
While this article focuses on monitoring the Kubernetes layer itself, it’s important to realize that Kubernetes monitoring, in a vacuum, is incomplete. You cannot successfully manage your applications without also including application and server monitoring solutions in your toolset.
Kubernetes monitoring overview
When evaluating monitoring solutions for a system, such as Kubernetes, most people focus on what metrics are and should be collected to monitor the system. This is a necessary and important aspect to consider, but how do you know what metrics you need?
One way to accomplish this is to start by creating a list of questions you would like your monitoring solution to answer. Once you have the questions down, that will lead naturally to what metrics you need to collect to answer those questions.
Here are some sample questions that you could reasonably expect your Kubernetes monitoring solution to answer about your running application:
- Is the application up and operating (the processes are running)?
- Are messages being routed to and from the application correctly?
- Are messages flowing between services within the application?
- Does each component of the application have sufficient resources (memory, disk, network) to operate successfully?
- Are resources balanced and used reasonably across the entire fleet?
- Are your resources balanced and sufficiently redundant so that a failure in any portion of the system won’t bring down the entire application?
- Are service nodes failing to start? Are they failing after a period of time? Are they failing when idle? Do they seem to fail randomly?
These are just some of the questions that need to be answered. Of course, you’ll have application-specific questions you’ll want to make sure are answerable, and you’ll have different requirements on the importance of each of these and other questions that impact your application’s operating performance.
Once you understand the types of questions you’ll want your monitoring solution to answer, you can look for the type of metrics that you need to monitor for answers to these and related questions. As you think about the metrics you want your monitoring solution to capture, you should be focused on how this metric assists in answering one or more of your key questions.
Elements of monitoring Kubernetes
Kubernetes monitoring, in general, is divided into three main categories:
- Cluster monitoring. These are metrics about the cluster as a whole.
- Node monitoring. These are metrics about individual nodes within the Kubernetes cluster.
- Pod monitoring. These are metrics about individual pods and their lifespan within the Kubernetes cluster
What are some metrics that you could monitor for each of these categories? The answer varies considerably depending on the tool you use and the needs of your application. But, let’s look at each of these three categories, the metrics we can monitor in each, and the types of questions that typically can be answered by each.
Cluster monitoring
Cluster monitoring is about monitoring the Kubernetes cluster as a whole. This involves metrics such as the following:
- Is the cluster operating?
- How long has it been operating?
- Is network traffic flowing to and from the cluster properly?
- Are there errors being reported to the cluster indicating a component of the cluster is malfunctioning?
Cluster monitoring can give you insight into basic application questions such as:
- Is the application up and accepting requests?
- Are there aspects of how it’s operating that can impede the operation of the application?
- Can a change in behavior of the application be attributed to a new problem within the cluster itself?
Node monitoring
Node monitoring is about monitoring the individual nodes within a Kubernetes cluster and how the nodes are operating. This involves looking at metrics associated with each node, such as the following:
- Is the node able to start/stop pods successfully?
- Is there an imbalance in usage of this node vs other nodes?
- Is there an imbalance in pod failures associated with this node?
- Is this node low on resources (CPU, memory, disk)?
Additionally, metrics about the nodes as a group are important, such as:
- How many nodes are currently running? How does it compare with other times of the day, week, or month?
- How is the resource usage across the nodes balanced? Are there nodes that have available resources that can be used to take some of the load off of overloaded nodes?
- What network traffic is flowing to/from the nodes? Is there anything impeding the flow of traffic between the nodes? What about traffic to external systems and other applications?
Node monitoring can give you perspective into how the nodes that make up the cluster are performing. It can point to problems in the underlying servers, it can point to capacity problems in the fleet, or it can point to problems associated with balancing load across the fleet of nodes. This includes questions such as:
- Do you have sufficient servers attached to the cluster in order to handle your current needs and your near-term future needs? Do you have excess capacity that might allow you to remove servers to save money?
- Are the servers all operating at expected performance levels?
- Are you leaking resources? Memory leaks and other resource leaks can be an indication of a pending system problem.
- Are the nodes able to properly operate newly created pods? Are pods failing to start when they should not be failing?
- How many additional nodes can you safely operate in the cluster of nodes before you need to add more capacity?
- Is the load of all the pods properly distributed across the available nodes? Considering application availability, have you balanced which pods are running on each node reasonably?
- Are the pods on each node receiving traffic as required?
Pod monitoring
Pod monitoring involves monitoring individual pods that are running on nodes in the cluster, as well as groups of pods and how they work together. This includes the following types of metrics for each pod:
- CPU utilization of each pod
- Memory utilization of each pod
- Network utilization of each pod
- Disk and other resource utilization of each pod
Often, the lifespan of pods within a cluster or within a service is also of importance. Because pods are highly dynamic, creating and destroying pods happens regularly, and problems in managing the pod lifespan can be an indication of a more serious problem. Lifespan monitoring involves metrics such as:
- Number of pods started
- Number of pods terminated normally
- Number of pods that fail
- Failure reasons for failed pods
Cluster-level pod information can also be important, such as:
- Number of operating pods, number of stopped pods, number of hung pods in the cluster
- What node is each pod running on
Many questions that come up in Kubernetes monitoring can be answered by pod-level monitoring:
- Are pods operating? Is each pod operating as expected? Are the processes in each pod running as required?
- Is each pod receiving network traffic inbound as required?
- Is each pod able to send network traffic outbound as required?
- Are there any pods that are using excess CPU capacity beyond what is expected?
- How much memory does each pod require? Are any pods being starved of memory?
- Are your pods appropriately balanced across your server fleet (are like-purpose pods properly distributed across nodes)?
- Are pods for a specific service failing at an unacceptably high rate?
- Should executing pods be terminated because they are running “wild” and wasting excessive resources?
- How often are pods created/terminated? Are you being too aggressive in the load balancing and hence spending too many resources on starting up/shutting down pods? Or are you being too conservative and leaving excessive pods lying around?
- How are network resources utilized between pods? Are pods balanced to allow traffic to flow efficiently between pods without excessive extra-node traffic?
- Can a rebalance of pods cause a change in network utilization that can alleviate a contention problem?
Other types of Kubernetes monitoring
Typically, monitoring for other entities in Kubernetes derives from these three main categories. For instance, understanding metrics about a Kubernetes service means understanding pod-level metrics for each of the pods in the service, and metrics for the pods in the service as a group.
Metric attributes
As we come up with the metrics we need to collect, we also need to think about attributes of the metrics that are important to our ability to monitor the system.
The most important of these attributes include: how often do you collect the metrics (resolution), and how long do you store the results (retention)?
Determining metric resolution and retention is critical to understanding the monitoring resources required to monitor a given metric. Depending on the monitoring solution used, it can also impact the cost of monitoring that metric.
Do you need to know node memory utilization instantaneously? Meaning, do you need to know the current memory usage for each node? Or do you need to know how memory utilization has changed over a period of time (such as over the past 30 days)?
The answer to these questions will impact how you can use each of the metrics:
- An instantaneous value might be important to answer a question about whether you currently have sufficient resources to operate your application, and hence do you need to increase or decrease the resources available to the application right now.
- A 30-day history might be useful, in conjunction with application usage metrics and historical usage patterns, to see whether you will need more resources in the future.
- Historical metrics can be used to spot important trends: Do you have a memory leak that is causing your free memory to slowly decrease over time? It can also be used to spot correlations: What’s causing an ongoing problem that repeats whenever a particular node becomes overloaded, or a particular set of pods becomes overloaded?
There are several attributes for each metrics you should consider:
- How long do I keep each metric? This is called the retention period.
- Do I collect the metric once per second? Once per minute? Once per day? This is the specification of resolution of the metric.
- Do I need the same resolution for metrics that are 30 days old as I do for metrics from the past hour? Often, older metrics don’t need the same resolution as more recent metrics. This means that older metrics can be merged to create a lower resolution as time goes on. This is called metric aging and is an important aspect of allowing historical data to be retained longer.
- Where should I store the metrics? Should they be stored onsite next to the application? Should they be stored in an offsite location? Should I store them under the management of a SaaS monitoring company?
None of these questions are Kubernetes monitoring–specific but apply to nearly all monitoring solutions in general.
4 tools to monitor Kubernetes clusters
There are many options when it comes to tooling, both paid and open source. In this portion of the article, we explore four popular tools to use for Kubernetes monitoring in 2022.
Prometheus
Prometheus can be configured to monitor Kubernetes. Being an open-source solution, Prometheus can be the least expensive option. However, these cost savings can be overshadowed by increased costs to set up and deploy a Prometheus solution. It takes a fair amount of work to get a Prometheus system set up correctly and have it show quality charts and reports, as it requires integrating with other technologies, such as Grafana.
Prometheus is known for its Alertmanager feature set which gives users the ability to configure alerts across the data collected. It is also known for PromQL, its query language, which gives users the ability to query Prometheus metrics directly.
There are a number of managed Prometheus services available, including those offered by GCP and AWS. However, these managed Prometheus services can get expensive.
- Pros: A large number of integrations, relatively easy setup and configuration.
- Cons: Difficult to scale to very large workloads, managed solutions become expensive.
- Pricing: Free to use as an open-source solution, pricing is variable for managed offerings.
Dynatrace
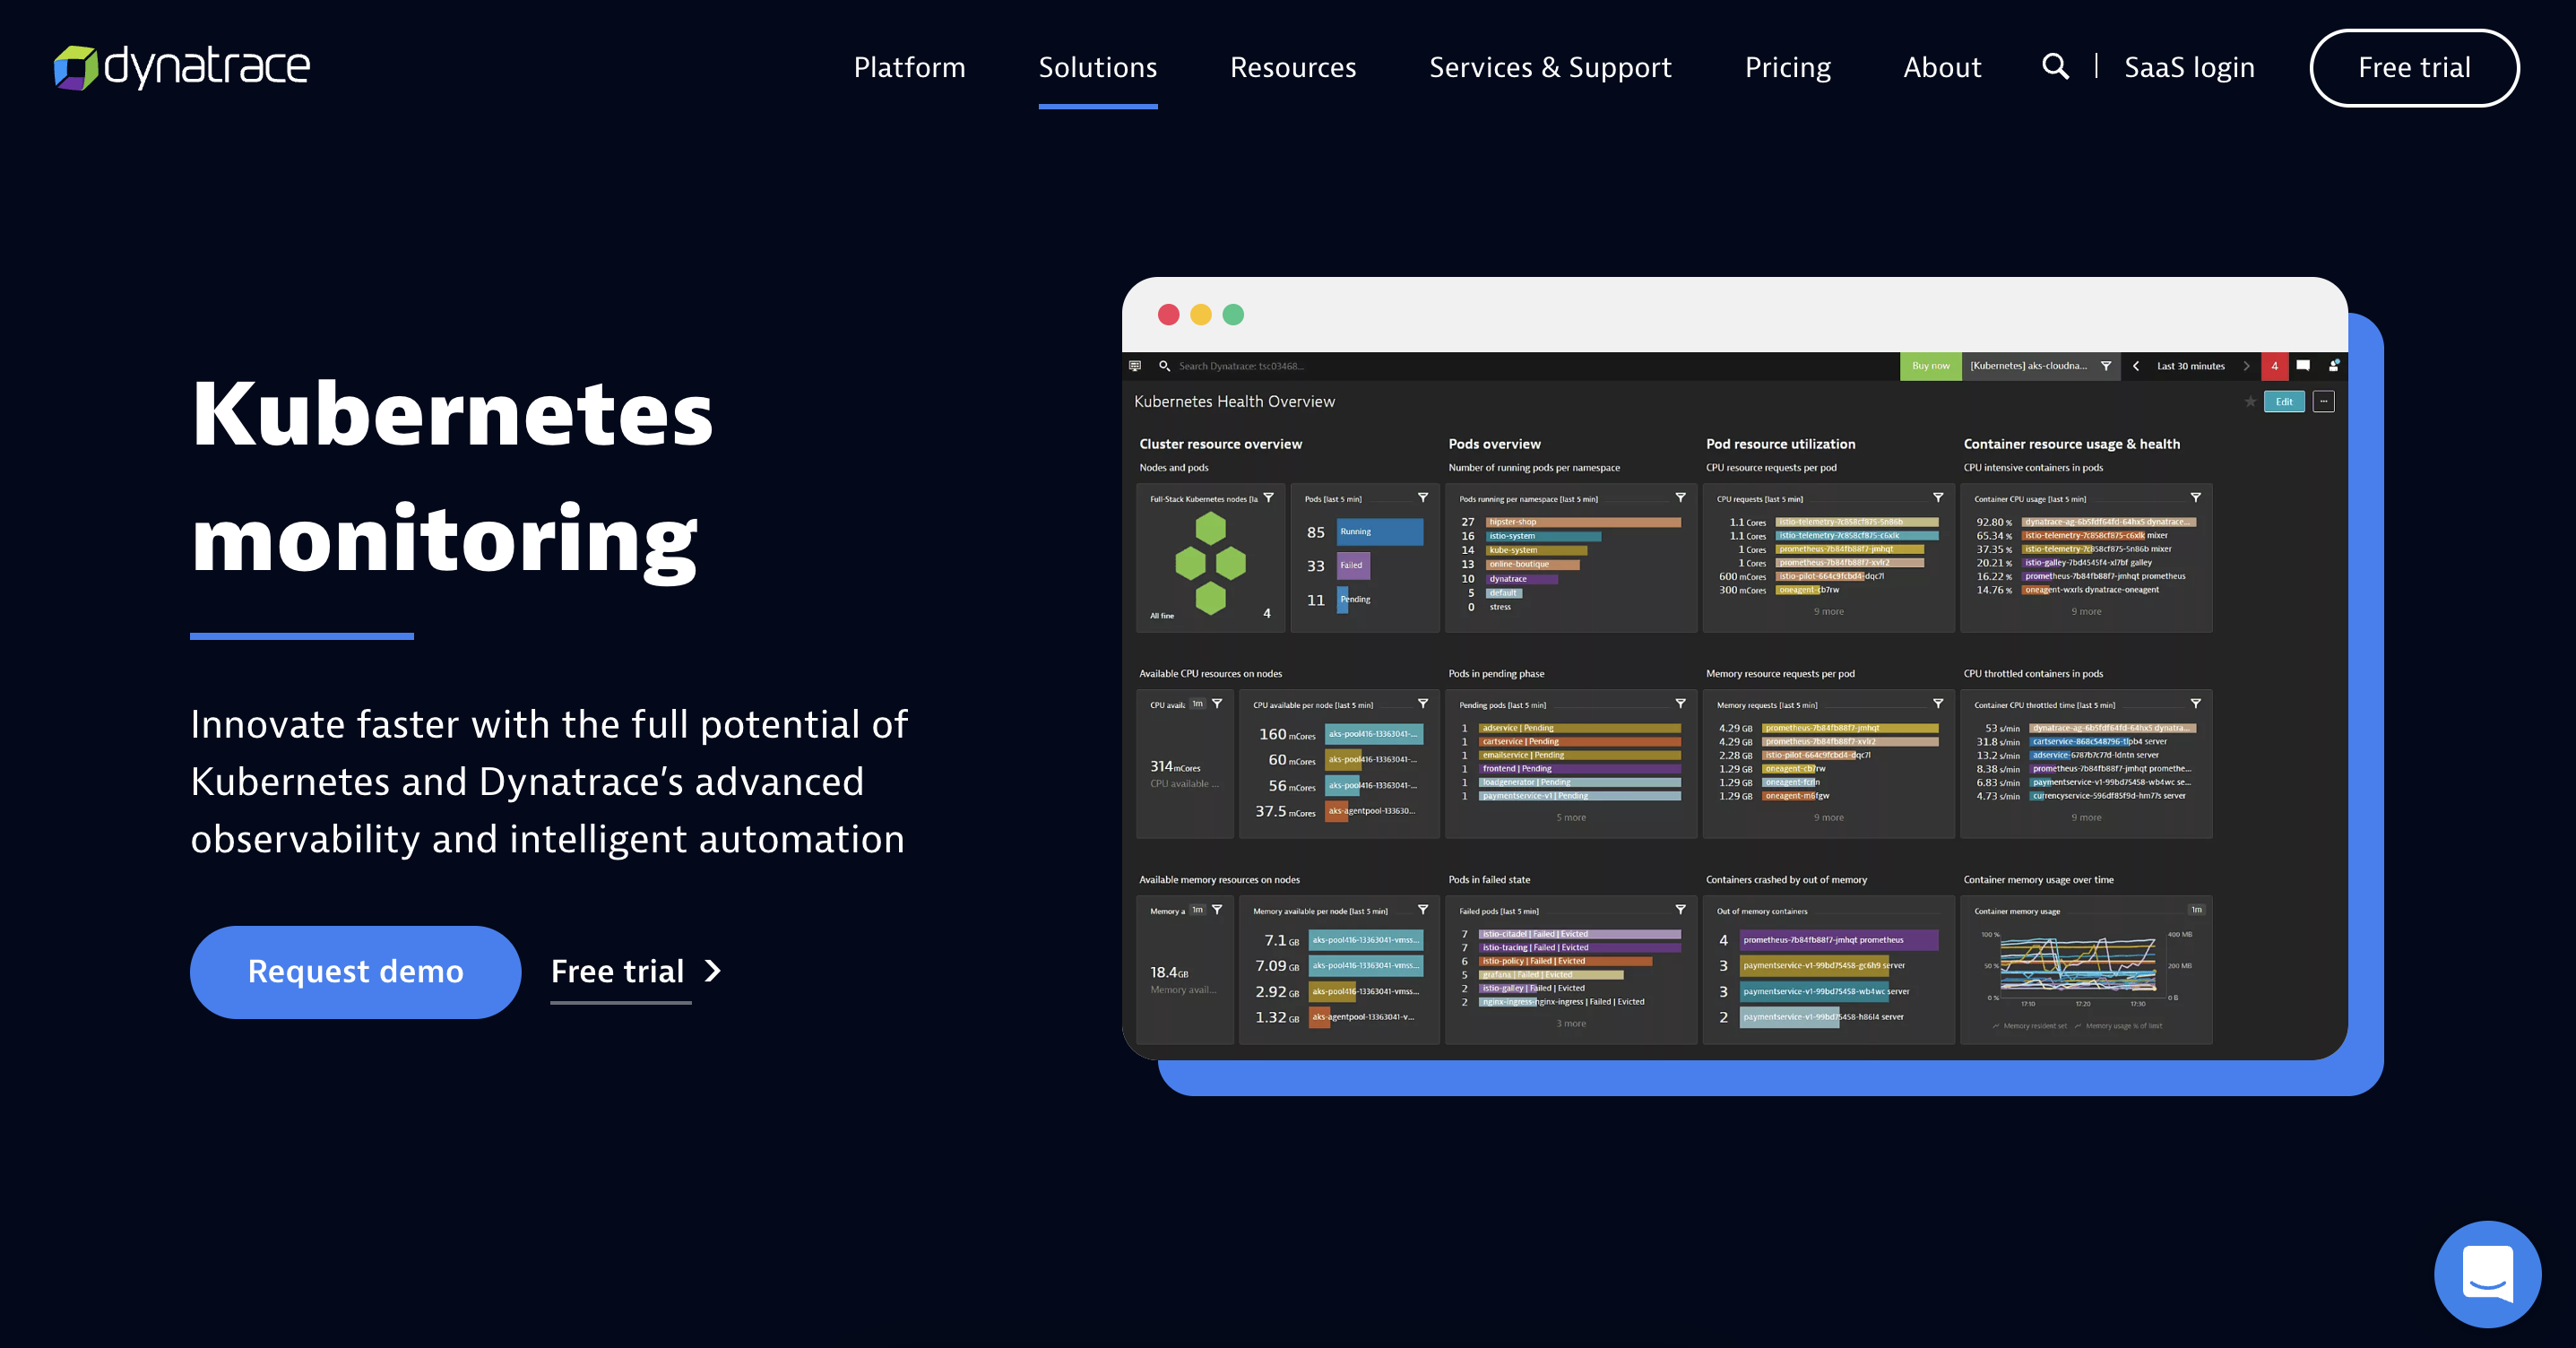
Dynatrace is a premium paid solution that focuses on monitoring cloud-based applications, so monitoring Kubernetes applications is a natural extension. Dynatrace has extensive Kubernetes monitoring, including the use of intelligent automation. Dynatrace offers a number of dashboards including those for metrics, Kubernetes events, and distributed tracing.
Dynatrace is often used by the largest enterprises including companies like Experian, SAP, and Dell.
- Pros: A comprehensive toolset with advanced security and cost optimization features.
- Cons: Relatively expensive pricing model compared to other products like Datadog.
- Pricing: $74 per host per month for Full-stack monitoring, and $22 per host per month for infrastructure monitoring.
New relic
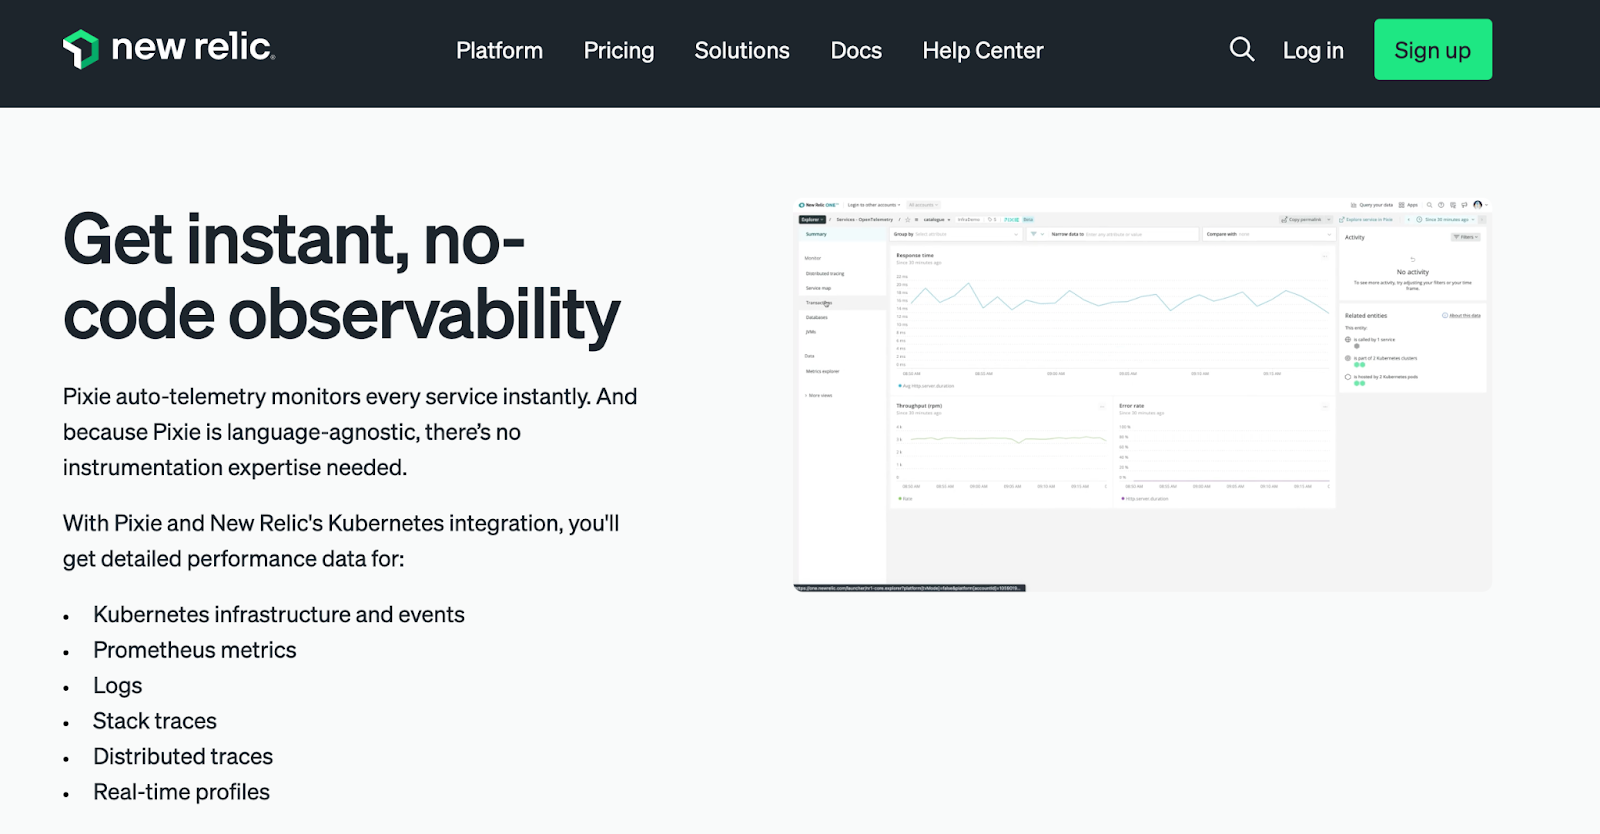
New Relic focuses on application performance monitoring, but recently it has focused considerable energy on improving its Kubernetes monitoring capabilities. In 2020, New Relic acquired and integrated Pixie into its platform. Pixie gives engineering teams the ability to access APM-like features, including tracing, without actually being an APM.
New Relic is a premium, paid offering and pricing is variable depending on your application and needs. Pricing is based on the number of users and the amount of monitoring data generated.
- Pros: Enterprise-grade features and capabilities like SSO, FedRamp, and HIPAA compliance, as well as an administration portal.
- Cons: Because pricing is based on usage and the number of users, and not access to particular toolsets, it might be difficult to estimate costs.
- Pricing: $0.30 per GB of ingest, plus per-user charges between $0 and $99 per month depending on capabilities. Additional charges for extended log retention, and access to Data Plus.
Datadog
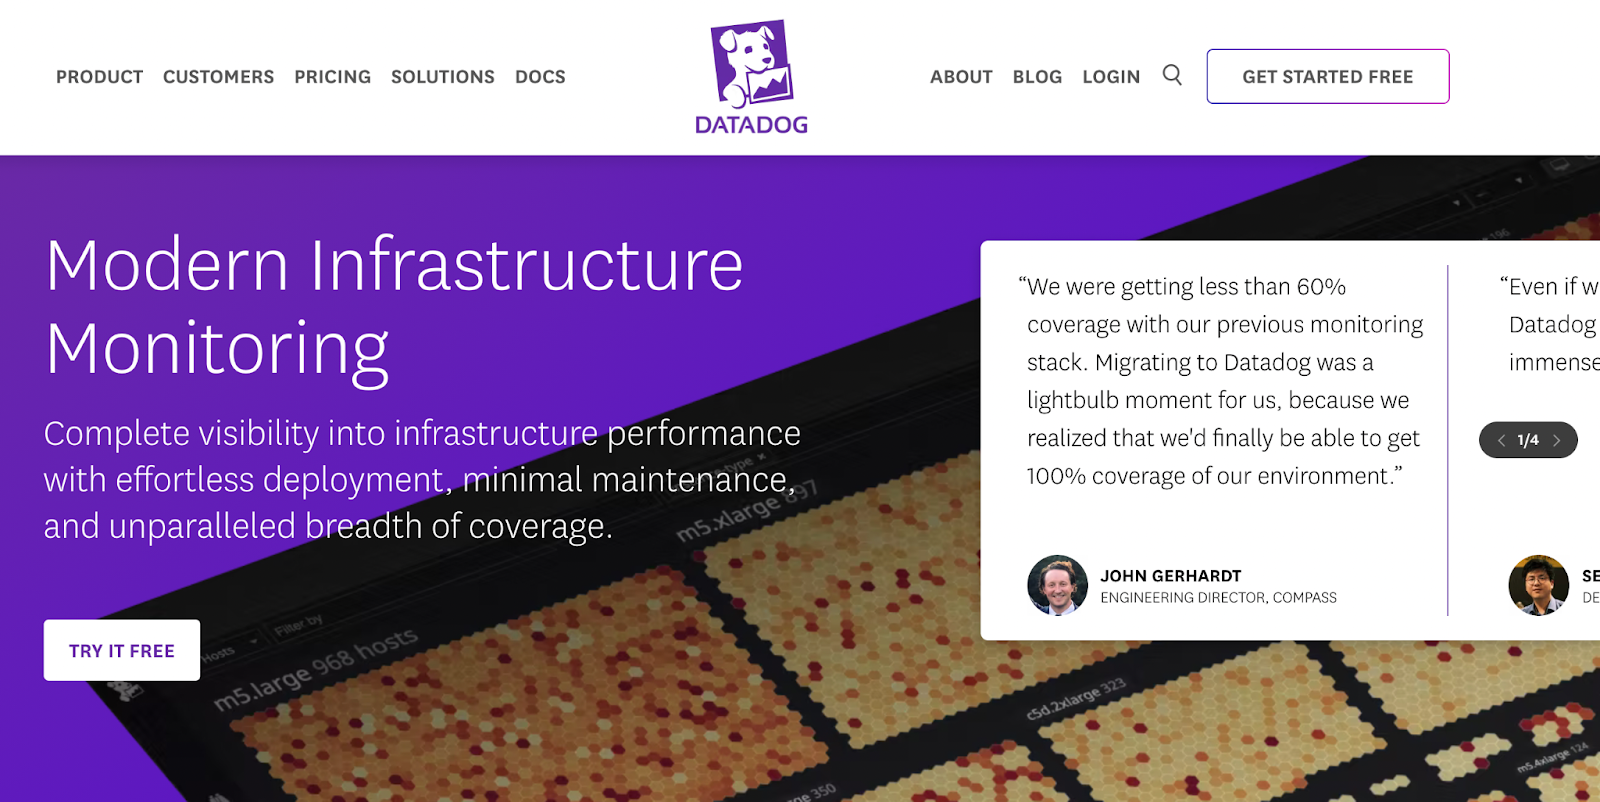
Datadog provides comprehensive Kubernetes monitoring that is integrated into its server and application monitoring solutions. Datadog is a paid service, but typically less expensive than some of the other paid solutions. Pricing typically depends on the number of hosts (nodes) that are monitored. Pricing is also dependent on the amount of metric, log, and trace ingest.
- Pros: A well-known solution with a large number of integrations. The company offers many of the toolsets you’d expect like infrastructure monitoring, and logging, as well as some unique features like security and incident management.
- Cons: Because the pricing model is based on the number of tools used, and off of usage, it can be difficult for teams to know how much Datadog will cost.
- Pricing: Variable depending on the toolsets selected, and usage. For the infrastructure monitoring product, the company charges $15 per host per month when billed annually, or $18 on-demand, with 15-month metric retention. Log pricing is based on the amount of ingest, and on the retention period. For example, the company charges $0.10 per GB of ingest, and $1.50 per GB for 15-day retention.
Final thoughts
Kubernetes is a popular open-source container orchestration tool for deploying and managing cloud-native applications. Kubernetes gives you many advantages for running container-based applications, many of which stem from the dynamic nature of Kubernetes as an infrastructure platform.
These same dynamic capabilities make monitoring Kubernetes more challenging than monitoring a traditional application-on-servers infrastructure. However, by understanding what questions you want to answer and what metrics you need to answer those questions, you can create a successful monitoring strategy.
Existing monitoring products provide specific Kubernetes capabilities that give you the visibility you require into your clusters to allow you to keep your applications operating safely. These solutions allow you to create a powerful Kubernetes monitoring strategy.
If you're looking to build an internal dashboard to monitor your Kubernetes clusters, then Airplane is a good fit for you. With Airplane, you can transform scripts, queries, APIs, and more into powerful internal workflows and UIs. With Airplane Views, you can build custom dashboards from existing component and template libraries.
To try it out, sign up for a free account or book a demo.