


Computing architecture has undergone a massive shift in the last few years, and traditional monolithic architecture has been taken over by microservice-based architecture.
This shift in architecture requires developers to rethink the way they observe, monitor, and debug their applications.
Distributed tracing has become a vital component to building any modern, scalable application.
In this article, you’ll learn what distributed tracing is and why you need it. You’ll also look at specific use cases to understand how it can be used today.
The microservices challenge
Most modern, cloud-native applications use a microservices architecture. In this model, a large application is broken down into smaller services that communicate with each other through APIs. Different services can be hosted on different servers and can even be located in different geographic regions.
Microservice architecture gives incredible flexibility for applications and their developers by splitting a huge application into smaller, easily manageable, and scalable services while increasing resiliency and reducing redundancy in the architecture.
However, microservice-based architecture comes with its own challenges, especially in the field of tracing.
In a monolithic app, you essentially have only one module and one team managing it. In this scenario, tracing requests and events and fixing errors is easy, but in microservice-based architecture, the request now has to traverse several services before a response is generated. Each service is likely managed and monitored by a different team, making it difficult to keep track of what’s happening across multiple services. If there’s an issue, it becomes challenging to point out which service is at fault.
External monitoring is difficult for applications with a microservice architecture due to the complex interlinking of various services required to create a response for every request. Other than the total response time and the number of invocations, nothing can be traced with external monitoring.
Distributed tracing is the technique employed to trace requests in an application in this environment.
Different distributed tracing standards
Because it’s a relatively new technology, it’s vital to have an agreed-upon standard that can be used to build distributed tracing tools.
OpenTracing by the Cloud Native Computing Foundation (CNCF) provides a vendor-neutral API specification for distributed tracing. It supplies flexibility and a solid standard, but the vendors provide implementation details, which can be very inconsistent.
OpenCensus was created by Google as an internal observability platform. It’s a collection of multi-language libraries that can report telemetry data to any backend observability or monitoring platform of the user’s choice. It can also trace requests, messages, and services from their origin to destination; however, it doesn’t provide any developer API.
In 2019, CNCF merged OpenTracing and OpenCensus into OpenTelemetry. It provides a solid foundation for building distributed tracing tools. OpenTelemetry provides a collection of tools, APIs, and SDKs that can instrument, generate, and collect telemetry data such as metrics, logs, and traces and can also export them to different analysis tools.
Why you need distributed tracing
Distributed tracing offers multiple advantages that make it extremely useful for observability.
Automation
Distributed tracing is automatic, unlike logs, which need to be manually inserted into the code. You can set up distributed tracing once, and it will start collecting data without any further configuration.
Visualization
Unlike logs, which are raw text, distributed tracing displays the data in a visual form. It’s easier for developers to understand the flow of the request and the relationships between services and resources.
Scalability
Distributed tracing is easy to scale because of its automatic nature. Minimal, and—in some cases—no configuration change is necessary when you add or remove a service or make changes to how they interact.
Cost-effectiveness
Easy to implement and use, distributed tracing is extremely cost-effective. Because it works with multiple applications, languages, and frameworks, you don’t have to spend time and money setting up and maintaining the distributed tracing tools. Many services also provide managed tracing tools, which can cut down on the cost of setting up a distributed tracing system.
How does distributed tracing work?
In this section, you’ll get an overview of how distributed tracing works and the related terminologies.
Terminologies
Distributed tracing is a unique technique for tracing external requests. Because it’s a newer technology, the terms used for discussing it are less common. It’s essential to define a few terms before going further to aid in a better understanding of its benefits and use cases.
Requests
Interaction in applications with HTTP(S) requests is the most common method of communication over the internet. These communications from external parties with the application are called requests. In addition, the way in which various services in the microservices architecture talk to each other is also referred to as a request.
The first kind of request is referred to as an external request, which originates from outside the application. The second type of request is called an internal request and is made from one service to another within the same application.
Traces and spans
A trace is a view into a request as it moves through the system. It’s made up of multiple spans.
A span is the building block of a trace, and it can be thought of as the smallest unit of work and typically represents one single named and timed operation, for example, making an API call, querying a database, etc. Multiple spans from multiple services throughout the lifetime of the request form a trace.
There are two types of spans in distributed tracing:
- Root span: the first span of any trace is called a root span.
- Child span: all spans that come after the root span are termed child spans. Each child span can have its own nested child spans.
Context
When a child span is created from the root span or another child span, the parent span passes its context to the child span. The context provides the parent ID and the trace ID to the child span.
Using this trace ID, the trace where the span belongs to is identified, and the parent ID is used to identify its relationship to other spans, specifically under which span it needs to be nested in the final trace graph.
Attributes
Spans by themselves hold relevant information about the operation performed, such as the duration and the name of the operation; however, these might not be enough to properly convey the context to someone who sees the trace.
You may need to store additional metadata with each span. For example, you might want to store the user ID or the location of the logged-in user. This can be implemented using attributes, which are key-value pairs to hold metadata about spans.
Sampling
The data collected with distributed tracing is enormous. All the services and multiple routes through them increase the total number of nodes through which the data passes. It’s difficult to identify the information you want when you have so much data.
Due to this constraint, representative data is used for analysis. The creation of a representative data set from a large volume of trace data is called sampling.
How traces work
The solutions and software tools for internal tracking of requests generate large runtime overheads that can slow down the application and incur additional cost. Distributed tracing uses a simple and elegant solution that is lightweight on resources.
The bulk of the action takes place when the user generates a request, for example, when a form is submitted. When the request hits the first service, the tracing platform generates a unique trace ID and an initial span called the parent span. All the requests passed from one service to the other will be tagged with this trace ID.
When the request enters another service, a top-level child span is created. Each child span is tagged with the original trace ID and has its own unique span ID. Other relevant information like the duration of the span, error data in case there was an issue, and metadata like a user ID are also stored with the span.
If the request performs multiple queries or commands within the same service, additional nested child spans are created under the top-level child span for that service.
Now you can use the trace ID to identify a trail left by the request throughout its journey.
Using traces effectively
Traces on their own are not very useful. To unlock their full potential, there are various insights you should gain from the traces, and they can be utilized in many different ways.
Troubleshooting problems for applications is one of the major use cases for distributed tracing. The vast amount of organized and tagged data is helpful in performing root cause analysis. This helps to investigate the underlying causes of surface-level problems and eliminate them.
IT and DevOps teams can use traces to monitor the system by identifying failure points, improving performance, and conducting maintenance activities. Teams can also monitor the traces to pinpoint any gaps and identify what to build next.
Reliability engineers can also use logs created with distributed tracing. They can identify the weak points in the infrastructure to bolster the support for the system and use the trace information to identify problems before they materialize as a failure.
Getting started with distributed tracing
Getting started with distributed tracing is as easy as implementing a few lines of code. The actual steps will vary depending on the tracing tool you use.
Below is an example setup guide for Node.js.
First, install the required dependencies:
Save the following code in app.js:
This defines a simple “express” application with one route.
Save the following code in tracing.js:
In the code above, ConsoleSpanExporter is used to print all spans in the console. You can also read through the OpenTelemetry docs to see how you can export the telemetry data to other tools.
Now it’s time to start the app.
Open http://localhost:8080 in your browser, and reload the page a few times. Eventually, the spans will be logged to your terminal. Here’s an example output:
The spans record how the request moved through the different components like “express” and how much time it spent there. Each span also has the traceID, parentID, and attributes.
For quickstart guides on other languages and frameworks, visit the OpenTelemetry code instrumentation.
Distributed tracing tools
Many tools are available for distributed tracing, including open-source tools and licensed ones. Most cloud service providers also offer their own proprietary tools for distributed tracing.
Some of the tools available are:
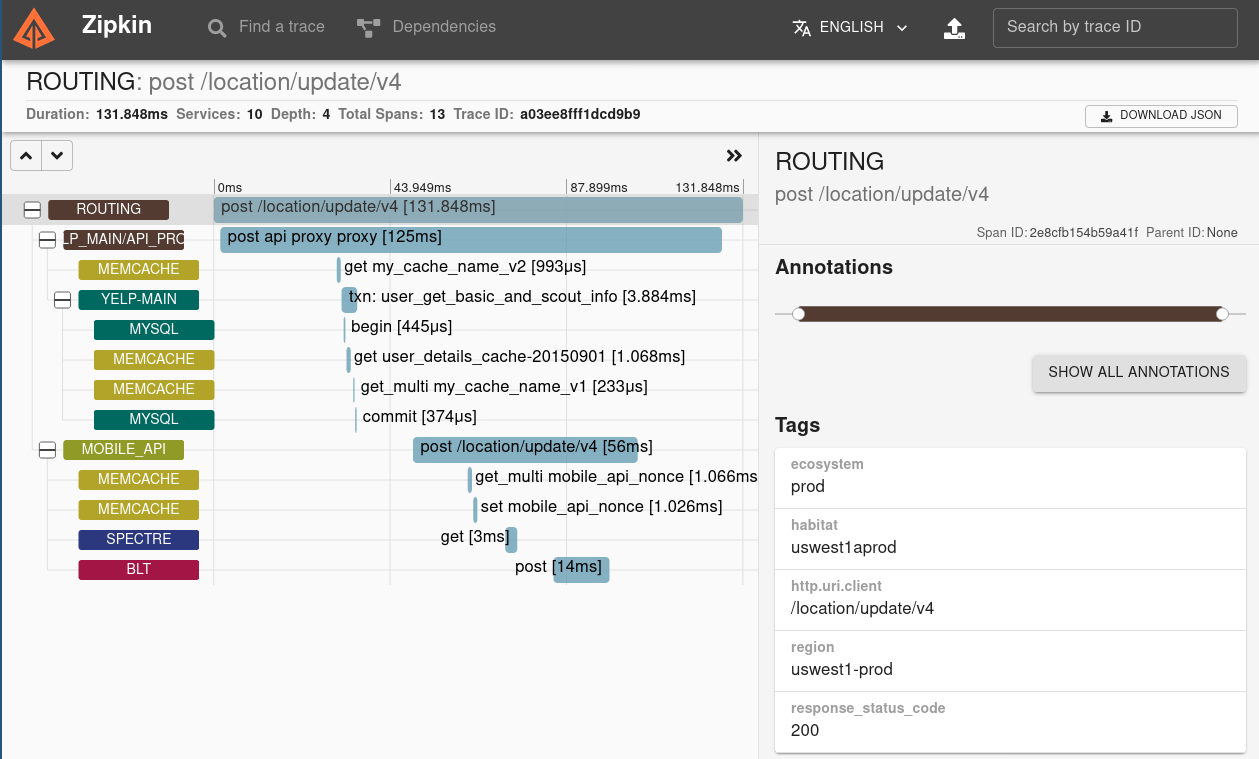
- Zipkin: developed by Twitter and inspired by Google’s Dapper, Zipkin can collect data from applications using HTTP, Kafka, gRPC, or RabbitMQ. The data can be stored in-memory, or in a database of choice, like Cassandra, Elastic Search, or MySQL, and it comes with a dashboard.
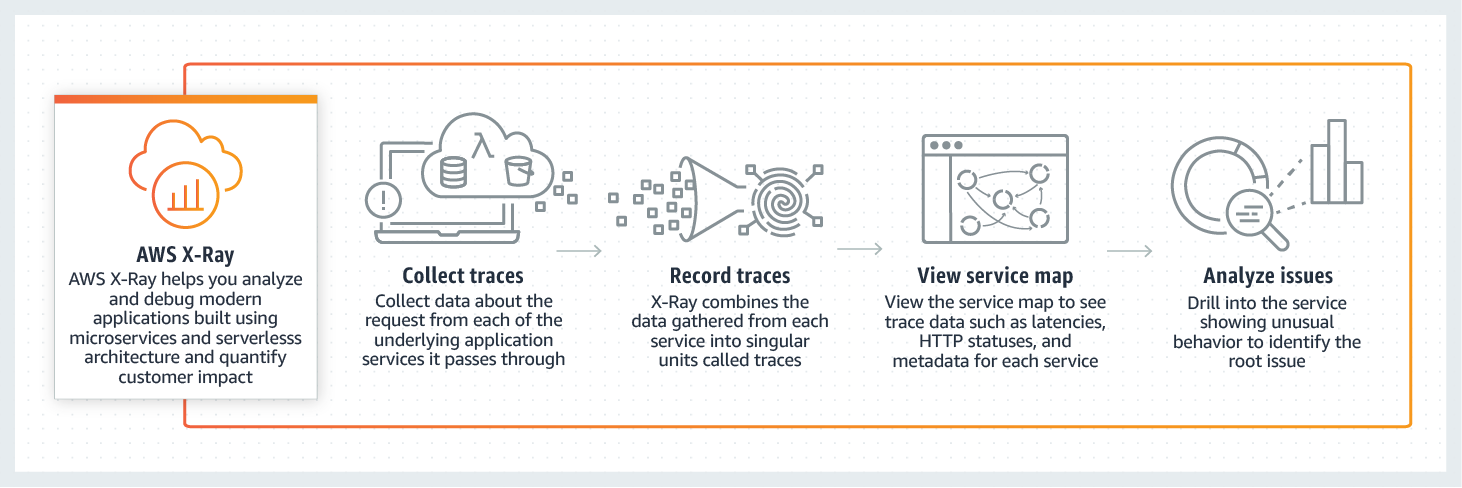
- AWS X-Ray: AWS X-Ray integrates tightly with AWS products like EC2, ECS, Lambda, SQS, SNS, and others. It helps you identify performance bottlenecks by showing you the relationship between services and resources of your application in real-time.
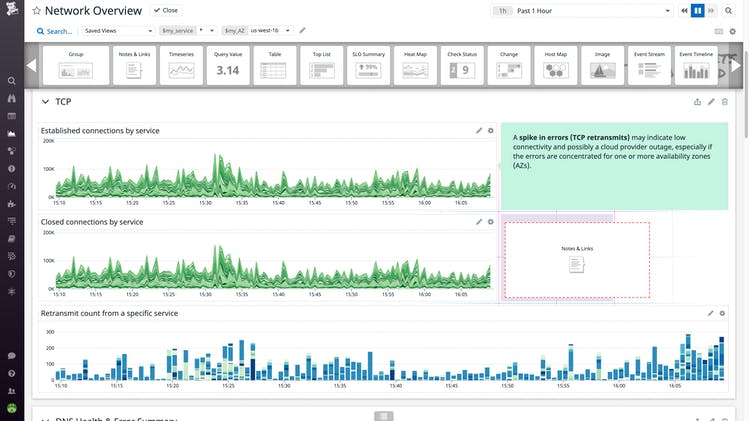
- Datadog: is a “cloud monitoring as-a-service” that collects metrics across multiple SaaS and cloud providers, automation tools, source control and bug tracking tools, databases, as well as other server components. It has an extensive list of integrations that makes it one of the most versatile and flexible observability solutions.
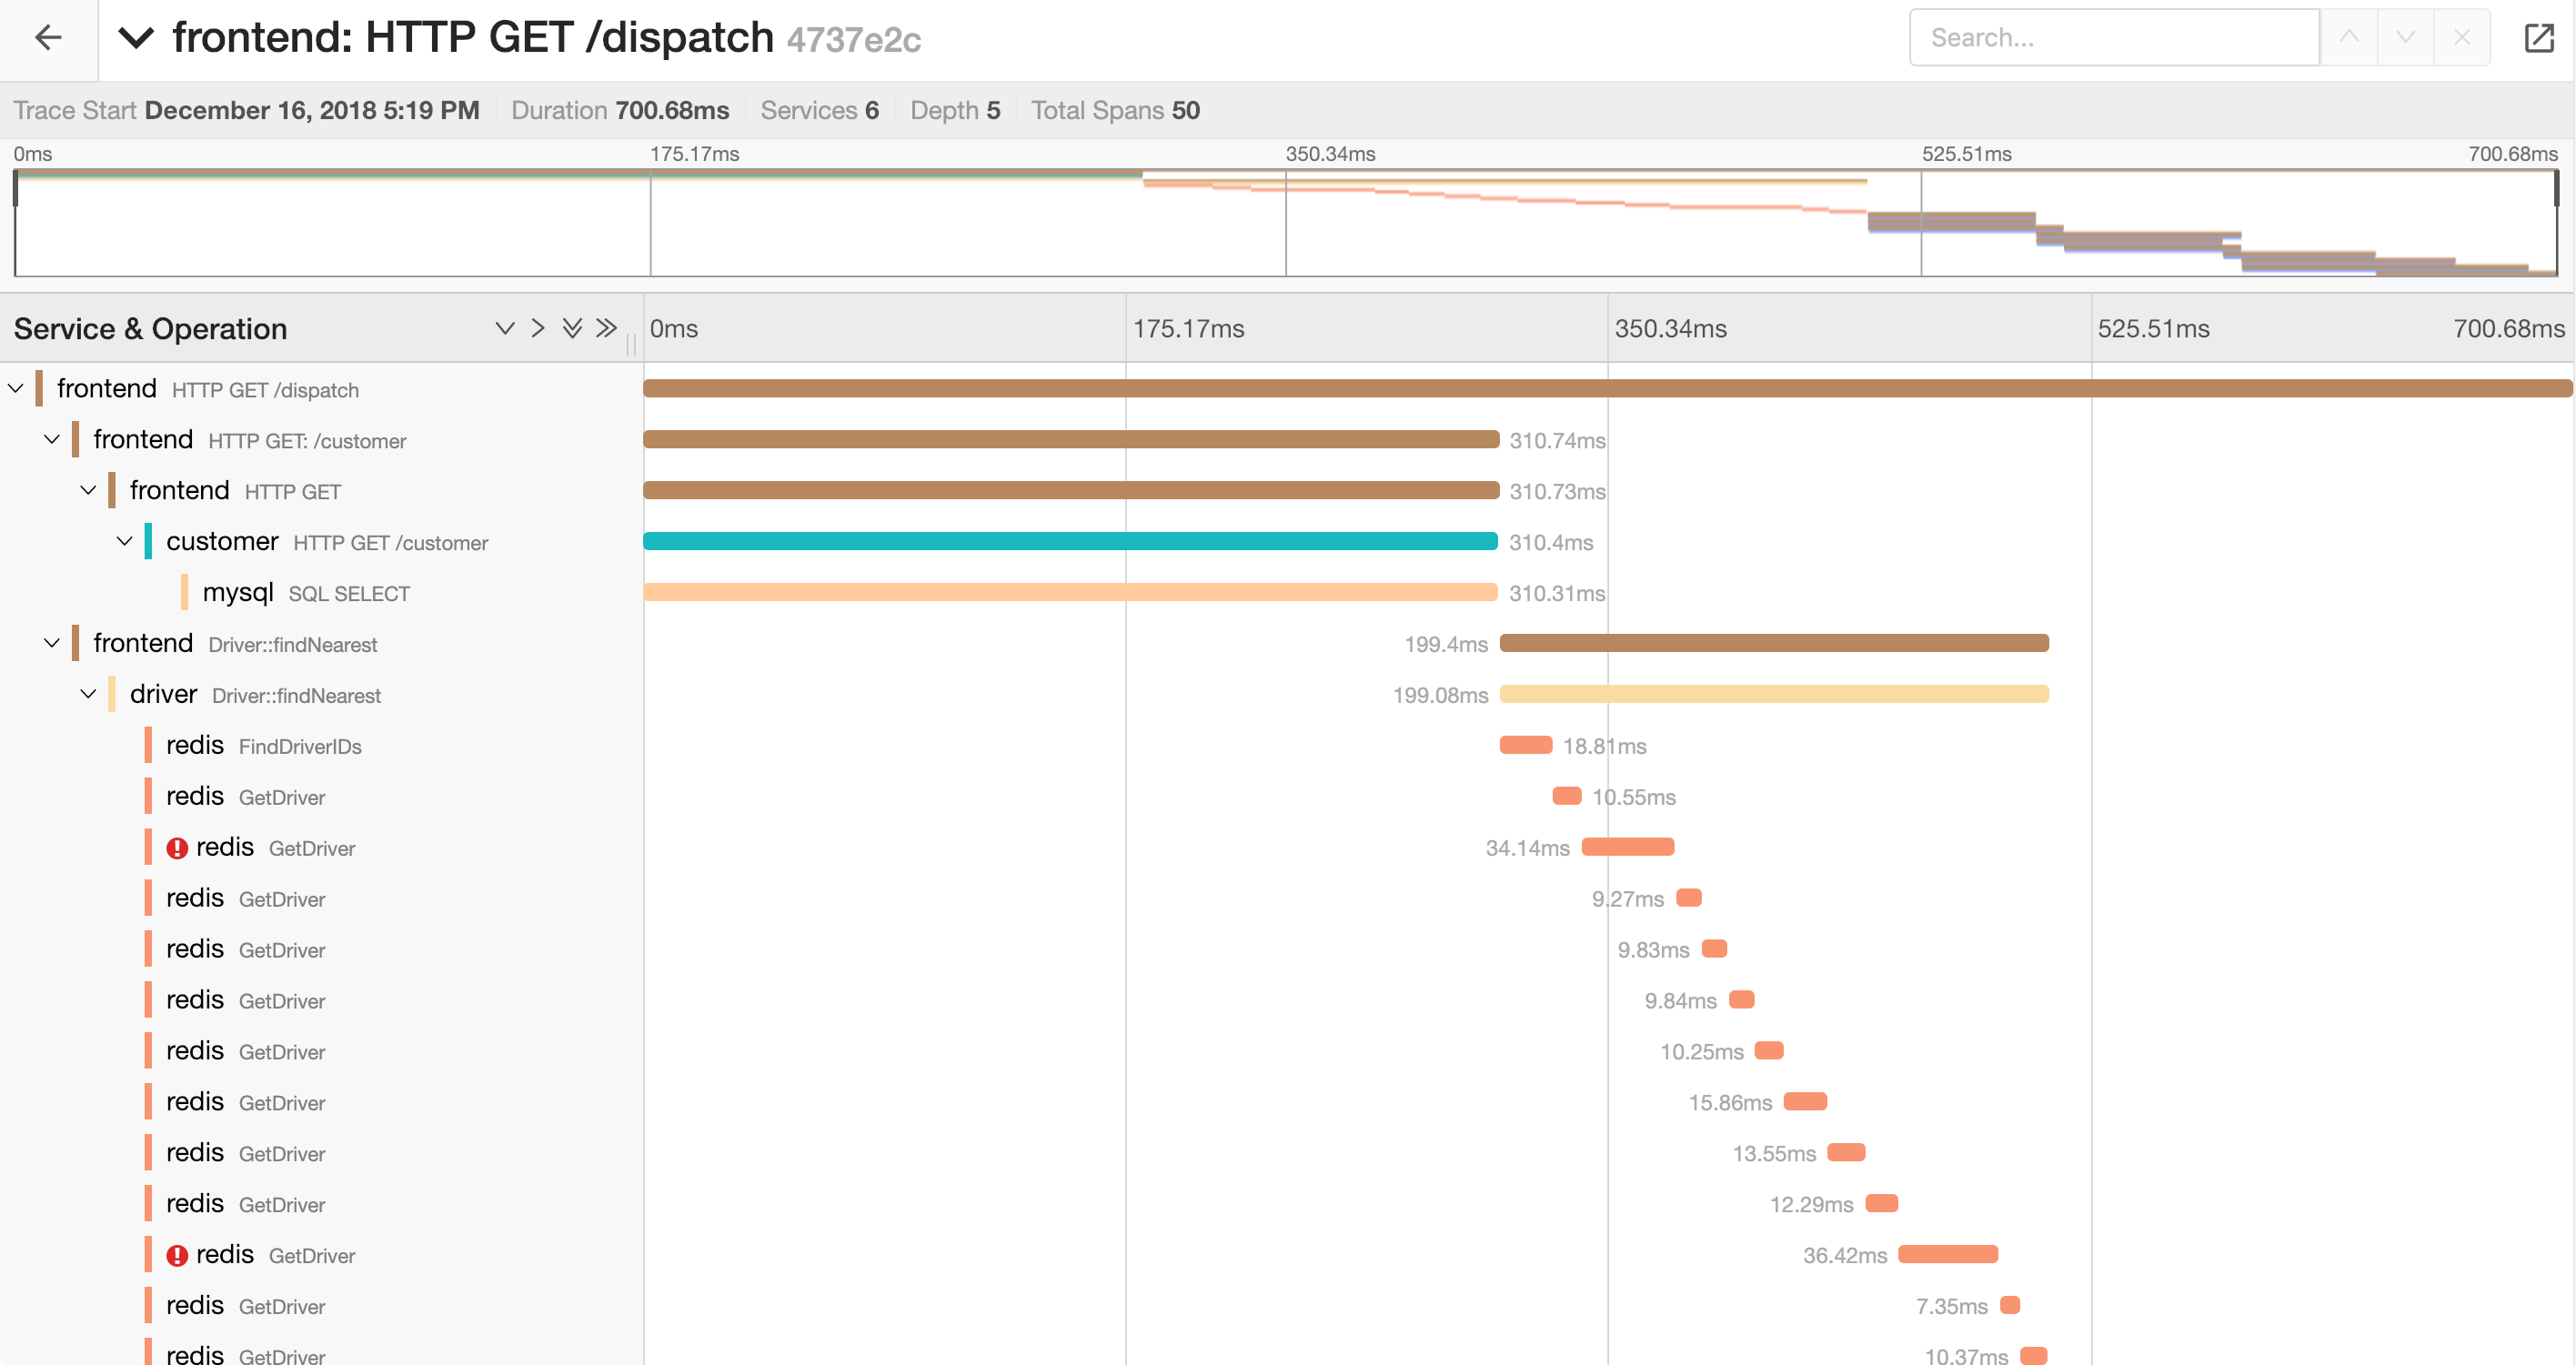
- Jaeger: is an open-source distributed tracing system that is created by Uber Technologies. It offers an OpenTracing compatible data model and can use multiple storage backends like Cassandra, Elasticsearch, and in-memory.
Other useful tools include Google Cloud Trace, Instana, Honeycomb, and Wavefront.
Distributed tracing and logging
Logging is the most common method for debugging any application. It’s a specific timestamped event that happened to your system at a specified time. Logs are extremely useful to identify errors.
In a microservice-based architecture, distributed tracing and logging must work in tandem to provide the best possible observability solution.
In this section, you’ll get an overview of how tracing and logging are similar, where they differ and how they can be used together.
Similarities of tracing and logging
Traces and logs both have the ultimate goal of gaining observability into the inner workings of a system.
Both collect information about events that occur in the system and have a similar workflow in the sense that they collect metrics from the application and route them to an external location for analysis. This external location can be a database, a file, or another web service.
Tracing and logging differences
There are, however, some key differences between logs and traces. The main one being that logs can capture the state of a single service or component individually, whereas traces capture information across multiple services.
Logs are usually collected as raw text and have no structure. This makes it difficult to search and analyze because each developer can use their own logging format.
Traces have a definite structure and can easily be searched and analyzed using attributes, timestamps, and other metadata, which makes them easy to work with.
Using tracing and logging together
Traces provide a bird’s eye view of your system, whereas logs provide more individualized information.
When you’re debugging an issue, you can use traces to follow the request throughout its journey and pinpoint the service where the issue is. Once you have identified the service, tracing is no longer useful, and you need to switch to the log of that specific service and check the events for possible clues.
By utilizing both tracing and logging, you can unlock their full potential.
Final thoughts
Distributed tracing makes logging events and metrics easier and simpler without causing any significant runtime overheads. Without a doubt, distributed tracing is an essential component of any application hosted with a microservices architecture.
Kubernetes is one of the most used platforms for distributed computing. Tracking data is an essential element of running any application with Kubernetes; however, it can be challenging since containers are built and discarded on a regular basis.
If you're looking for a powerful internal tooling platform, then consider using Airplane. Airplane is the developer platform for building custom internal tools. You can create Tasks, which are single or multi-step functions, or Views, which are React-based custom UIs.
Getting started is easy, sign up for a free account or book a demo and start building powerful internal tools within minutes.


