


Whenever you set up a new Kubernetes cluster, there are always certain things that need to be done. You need to make sure that you have the correct sizes in your node pools; you need to make sure applications are namespaced correctly; and, of course, you need to make sure you are monitoring the cluster in the right way.
This can become somewhat of a task for the inexperienced. There are so many things that can be monitored when it comes to Kubernetes—pods, nodes, namespaces, etc.—it can be hard to keep track of everything.
In this article, you’ll be shown the basics: CPU and memory usage. Even though a lot can be said for Kubernetes monitoring, you still need to make sure these basic metrics are monitored and kept in check.
What is resource monitoring and how is it used?
Resource monitoring can be a lot of things, and there are many different ways of approaching it. One trait common to every method is the simple goal of wanting to know what’s happening. In a traditional architecture you would typically monitor CPU and memory usage, as most legacy systems are running on a set number of machines, and adding new ones isn’t always simple. Therefore, it’s important to make sure applications are using only as many resources as intended, so as not to run out of capacity.
In Kubernetes, however, it’s easy to set up autoscaling. So why monitor these metrics when the cluster will always make sure there are enough nodes to take care of the workload? There are quite a few reasons, some more important than others. One of the biggest reasons is cost. Scaling up your cluster is not free, and you almost always want to keep your cluster as small as possible. Another reason for monitoring CPU and memory usage metrics is to be aware of sudden performance changes. A sudden spike in memory usage? This could be an indication of a memory leak. A sudden spike in CPU usage? This could be a sign of an infinite loop. Although basic, these metrics can definitely help you.
Those are two of the biggest reasons why you want to monitor these metrics. With that said, let’s take a look at how you can do it within Kubernetes.
What is Kubectl top?
If you’ve ever worked on a Linux system, chances are that you’ve used the top command. If you know the command, you’ll quickly get used to how the one in Kubernetes works. If you don’t, fear not! Although kubectl top is a powerful command, using it is very straightforward.
Installing the metrics API
The kubectl top command doesn’t actually collect any metrics itself. It queries the Metrics API for the metrics and presents them to you. In most clusters, especially those provided by cloud services, the Metrics API will already be installed. However, in some clusters, it won’t: the one provided by Docker Desktop, for instance. You can check whether the Metrics API is installed by running the following command:
If you get a result, that means the API is already installed and you can use it. If not, you’ll have to first install it. You can find instructions for this here. As of writing, you need to run the following command:
Using Kubectl top
Once you’re sure the Metrics API is properly installed, you can start using the kubectl top command. Start trying it out by running kubectl top pod. This will show you metrics from all the pods in the default namespace. If you want to get metrics from a specific namespace you will have to specify the namespace. For example, if you want to get metrics from the web app namespace, you can do the following:
| NAME | CPU (cores) | MEMORY (bytes) |
|---|---|---|
| nginx-84ac2948db-12bce | 14m | 1Mi |
| nginx-84ac2948db-bc9ae | 14m | 1Mi |
You’ll see that you aren’t bombarded with a ton of different metrics. You’re provided with the metrics that it can pull directly from your pods, CPU, and memory usage. Although this may not seem like much in the context of something big like Kubernetes, it can be used to troubleshoot a variety of issues.
If you see your resource usage suddenly spike in your cluster, this will quickly let you know which pod is causing the issue. This is especially helpful if you have multi-container pods, as the kubectl top command is also able to show you metrics from each individual container.
$ kubectl top pod nginx-84ac2948db-12bce --namespace web-app --containers
| POD | NAME | CPU (cores) | MEMORY (bytes) |
|---|---|---|---|
| nginx-84ac2948db-12bce | api | 14m | 6Mi |
| nginx-84ac2948db-12bce | log-collector | 14m | 20Mi |
In the above example, you have a web app that uses a sidecar container to collect logs. Looking at the above output, it’s obvious that it’s the log collector causing resource utilization issues, and not your web app. This is a place where many could potentially get stuck; however, you know exactly where to start troubleshooting.
Of course, it’s possible to use this command for checking things other than pods. You can also use it to view metrics from your nodes:
$ kubectl top node
| NAME | CPU (cores) | CPU% | MEMORY (bytes) | MEMORY% |
|---|---|---|---|---|
| gke-test-default-pool-2948c8a8-fk92 | 55m | 8% | 781Mi | 67% |
| gke-test-default-pool-2948c8a8-kd89 | 47m | 7% | 644Mi | 55% |
Understanding metrics
When looking at the metrics, you get the memory in typical Mi notation, meaning mebibytes. Working with Linux and Kubernetes, this is something you should be familiar with. Getting the CPU (cores) in m notation may seem a bit weird.
Within an operating system there’s a concept known as CPU Time. This concept refers to how much time your process is actively using the CPU. Most processes are not constantly using the CPU, but rather they use it sporadically. This may be because it’s simply not running, or it may be waiting for something else. If your process made use of the CPU constantly for a second, then it would be said that your process was using the entire core in that one-second interval.
So what does the m notation mean? Since most processes don’t use the CPU constantly, there’s a concept known as milliunits, which is denoted as m and is 1000ths of a unit. So the output showing 55m is 0.55% of a CPU core being used.
Tools and methods
Using kubectl top feels like a bit of a lackluster way of monitoring Kubernetes. While CPU and memory usage can do a lot for you, it’s still missing a lot in the context of Kubernetes as a whole. This is why there are many tools to expand on monitoring.
Kubernetes dashboard
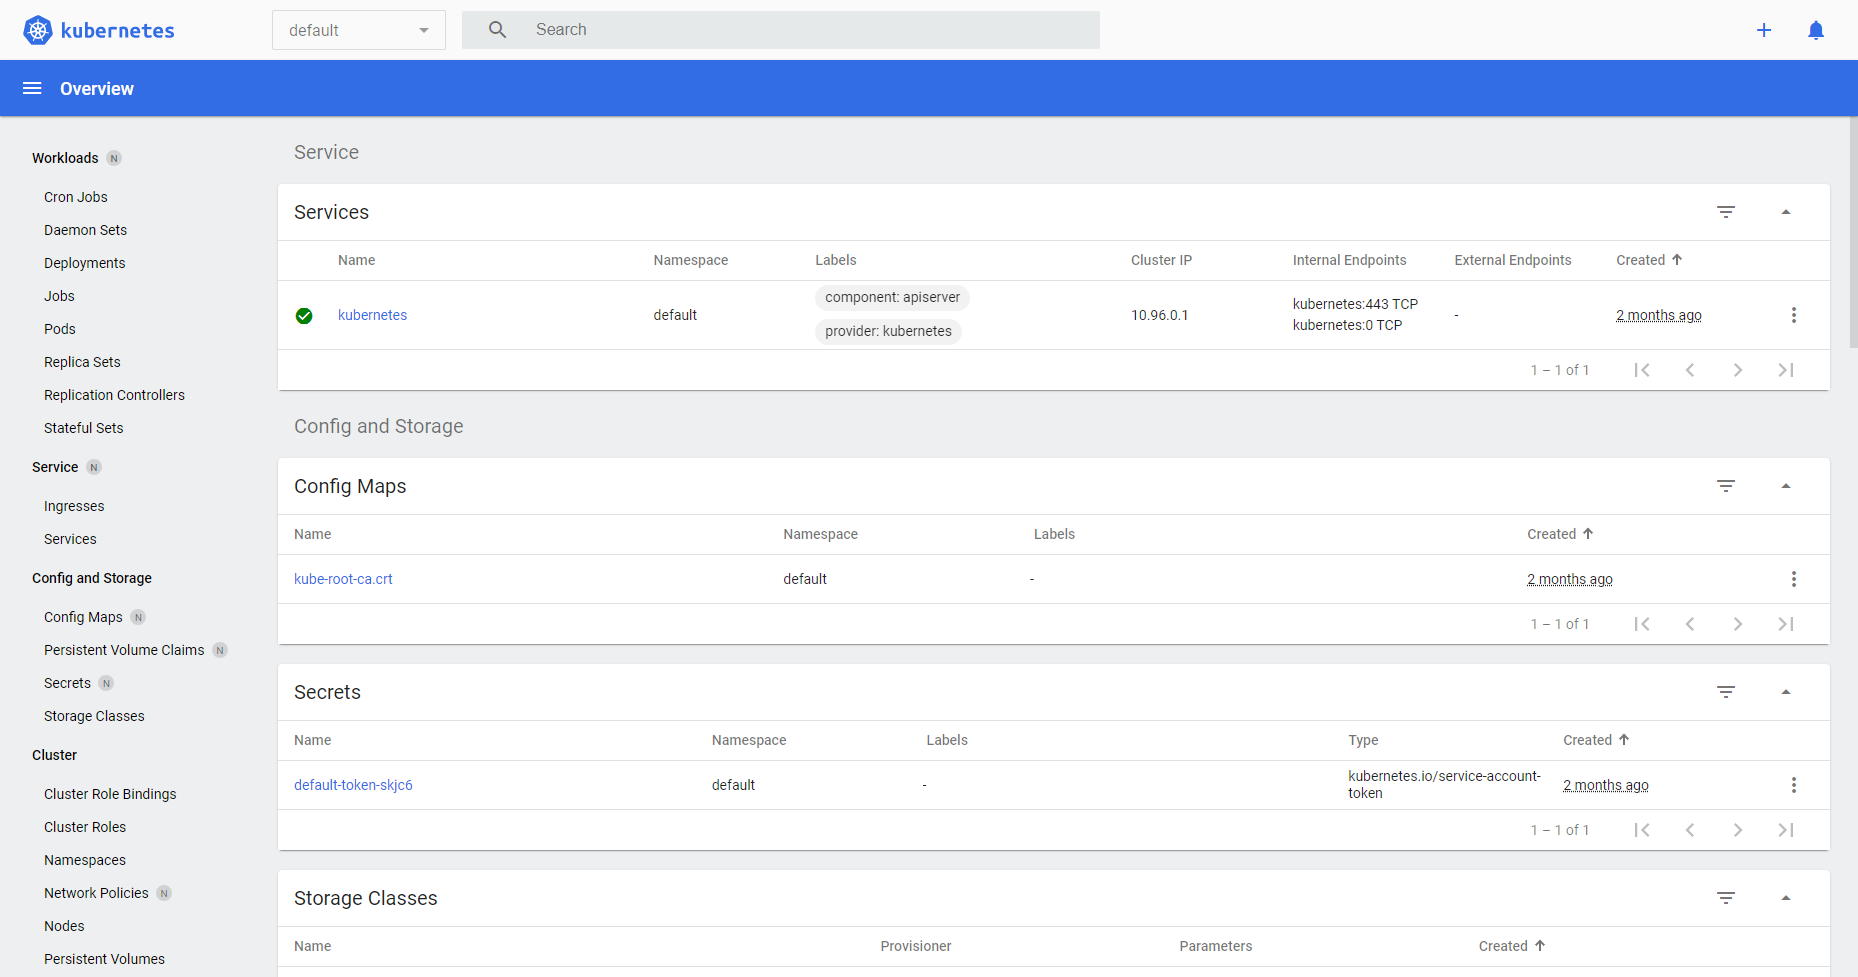
The Kubernetes dashboard is not enabled by default, but you can find installation instructions for it here. This dashboard can help give you some basic metrics graphs for your cluster and get more insights into historical data. This is unlike the kubectl top command, which only shows you instant metrics. The Kubernetes dashboard is free to use.
Conclusion
Now you know more about Kubernetes metrics, their use in the context of resource monitoring, and why you should care. CPU and memory usage may very well be some of the most basic metrics you can monitor, and it may seem unnecessary to do so in such a highly scalable platform as Kubernetes. Yet it’s sometimes important to go back to basics and use the tools given to you.
If you are looking to build an even more robust and customizable dashboard to help you track Kubernetes metrics effectively, Airplane is a great solution for you. Airplane is the developer platform for building custom internal tools. The basic building blocks of Airplane are Tasks, which are single or multi-step operations. Airplane also offers Views, which allows users to build custom UIs quickly.
Airplane offers an extensive pre-built component library and template library, making it easy for users to get started. In addition to these libraries, Airplane offers strong defaults, such as job scheduling and activity logs, that make it simple for users to create and monitor their internal tooling quickly.
To build your first internal UI to track your Kubernetes metrics, sign up for a free account or book a demo.


