


In recent years, Kubernetes has become the preferred tool for deployment and management of containerized applications, with every major cloud provider providing managed Kubernetes services. However, the growth of Kubernetes also comes with new challenges, such as effective cost management, efficient usage of cluster resources, and health and performance monitoring of the cluster and its hosted applications. Thankfully, there are tools available to solve some of these challenges, and one such tool is kube-state-metrics.
kube-state-metrics provides multiple benefits to your cluster. In this article, you’ll learn what kube-state-metrics is, the importance of enabling kube-state-metrics in your cluster, some of its use cases, and how to implement it in your cluster.
What is kube-state-metrics
kube-state-metrics is a monitoring tool that leverages the Kubernetes API to provide metrics on the state of the objects in your cluster. Such metrics include the pod status, node capacity, available deployment replicas, resources requests and limits, and many more.
It is important to not confuse the Kubernetes metrics server with kube-state-metrics. The Kubernetes metrics server provides information about the usage of the cluster resources (such as CPU and memory) which is useful for scaling, while kube-state-metrics focuses more on the health of the Kubernetes objects in your cluster, such as the availability of pods and the readiness of nodes.
Features of kube-state-metrics
kube-state-metrics provides features that make it an important tool in your monitoring tool arsenal. They include:
- Availability of metrics data at an HTTP endpoint
- Data available in Prometheus exposition format
- Reports raw data from Kube API
Availability of metrics data at an http endpoint
kube-state-metrics exposes its data on the /metrics HTTP endpoint and is served as plain text, which makes it easy to configure it with any monitoring platform that scrapes data from the Kubernetes cluster. Furthermore, you can view kube-state-metrics in a web browser, though the data displayed is in a raw format that requires additional tools like Prometheus and Grafana to become more human-readable.
Data available in Prometheus exposition format
Prometheus is a popular tool that is included in many Kubernetes users’ observability toolset. It scrapes metrics from its target endpoint and saves the scraped data in an internal time-series database for analysis. This can be integrated with another monitoring tool such as Grafana to visualize the data.
The output of kube-state-metrics uses the Prometheus exposition format, which exposes your metrics data in such a way that Prometheus can understand and use. This makes integrating kube-state-metrics with Prometheus a straightforward, hassle-free task.
Reports raw data from kube api
kube-state-metrics outputs data retrieved from the Kube API with no modifications. This means that the data exposed provides comprehensive information about the Kubernetes objects, and users can transform this data based on their needs.
Use cases for kube-state-metrics
There are several use cases for using kube-state-metrics, and this section will show you some of the information you can extract from Kubernetes nodes, pods, and deployments.
Nodes
kube-state-metrics allows you to get information about resources such as CPU, memory, and disk space, the capacity of nodes, and the allocatable resources that have been set for each node to schedule pods. You can also get information about the status of nodes in your cluster, which includes the number of available and non-available nodes, allowing you to investigate the cause of the node unavailability or terminate them to save costs.
Pods
If you don’t have sufficient data about the state of the pods in your clusters, then tracking the performance of the hosted applications can be an uphill task. kube-state-metrics provides several pod metrics that help you fine-tune your cluster and stay on top of pod-related issues. Such metrics include:
- The number of available pods ready to serve requests.
- Information about the status of a pod container, and if applicable, why there are pod containers stuck in a
waitingstate. - Information on the number of pods waiting to be scheduled on a node.
Deployments
Deployments allow you to provide declarative updates to pods and ReplicaSets. This tells the cluster to update the actual state of the cluster in order to reach the desired state, such as scaling the number of running pods in the cluster.
kube-state-metrics can provide insight into your deployments by telling you if the number of running pods is equal to the desired number of pods running. It can also provide metrics on the status of the deployment. A deployment can be in a progressing, completed, or failed state.
Note that this is just a brief overview, and kube-state-metric isn’t limited to the objects mentioned above. For more information, look at the documentation for each of the Kubernetes objects metrics exposed by kube-state-metrics.
Implementing kube-state-metrics
Now that you understand the purpose of kube-state-metrics, it’s time to implement it in your cluster. If you don’t have a cluster, you can use Minikube to set up a local cluster on your computer, making it easy for you to learn and practice Kubernetes. Once you have a cluster up and running, follow the steps below to implement kube-state-metrics in the cluster.
Install Helm if you don’t have it installed already. Helm is a package manager for managing Kubernetes applications. It provides an easier option to manage (install, uninstall, and configure) Kubernetes applications. In this tutorial, you’ll use Helm to install kube-state-metrics in your cluster. For more information about Helm, check out the Helm Documentation.
Open your terminal and run the following commands to use Helm to install kube-state-metrics.
The process of running the above commands should look similar to the image below.

You can override the default configurations of kube-state-metrics, such as the metrics it exposes, memory limit, and number of replicas. To view the available configurations, run the following command.

Create a config.yaml file that includes the values you want to override, and run the command below.
This installs kube-state-metrics with the configuration values that you specified in the config.yaml file.
kube-state-metrics has been successfully installed in your cluster. Now you have to expose it, so it will be available at your localhost endpoint. Run the command below:
In your terminal, send a curl request to 127.0.0.1:8080/metrics and it will return a response containing metrics of the Kubernetes objects as seen in the image below.
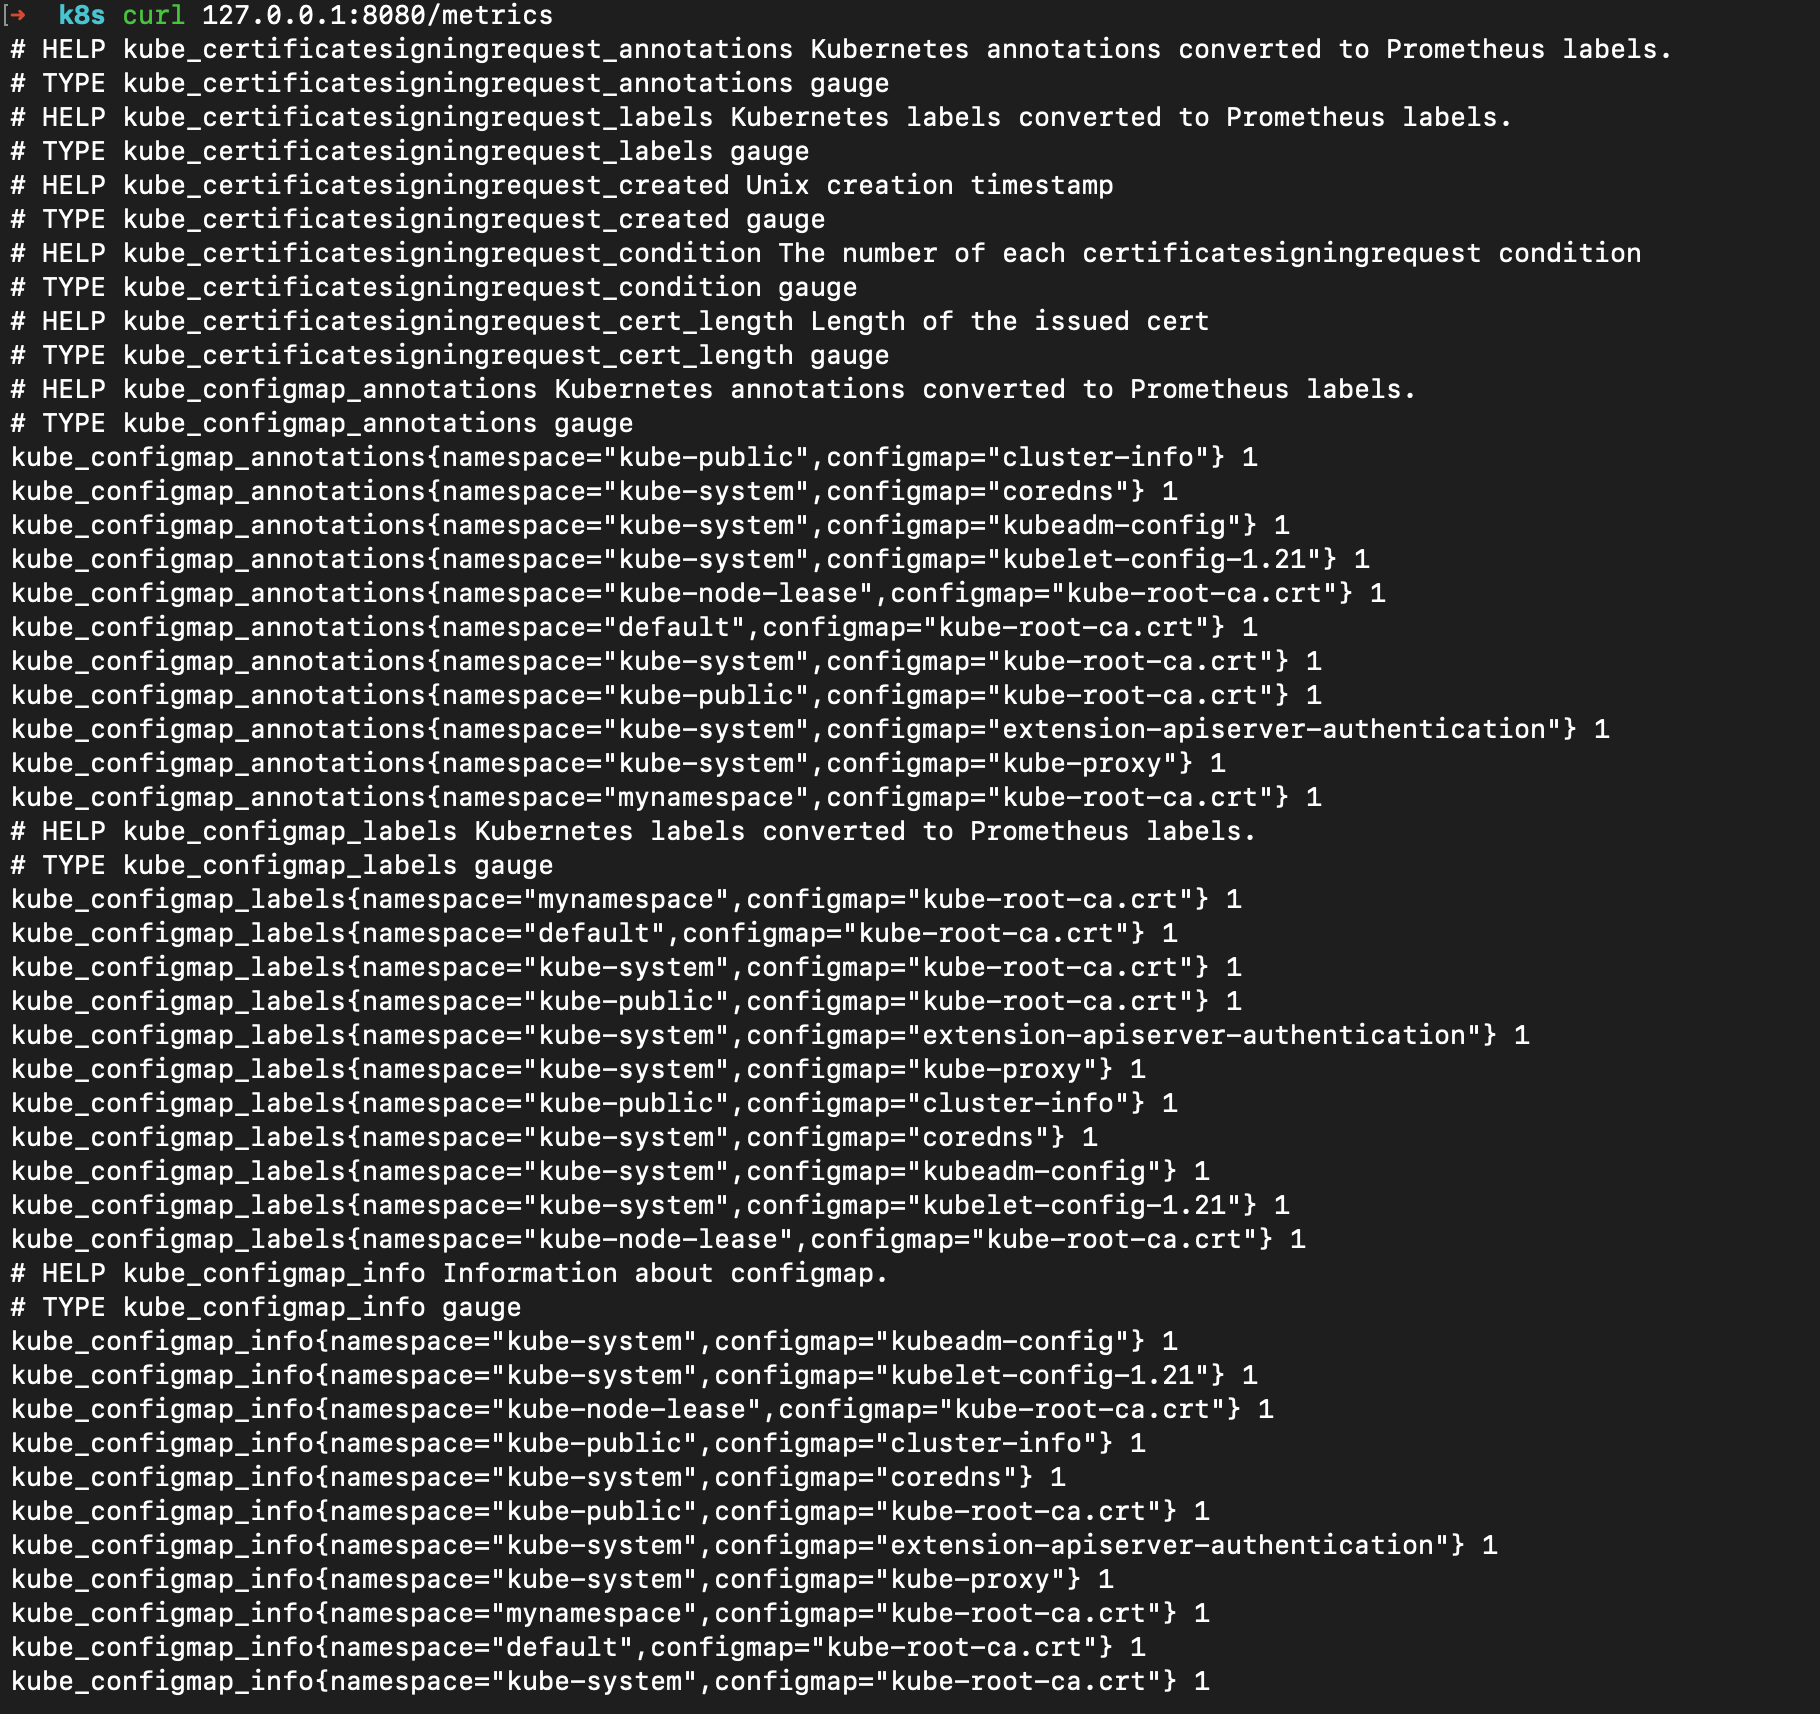
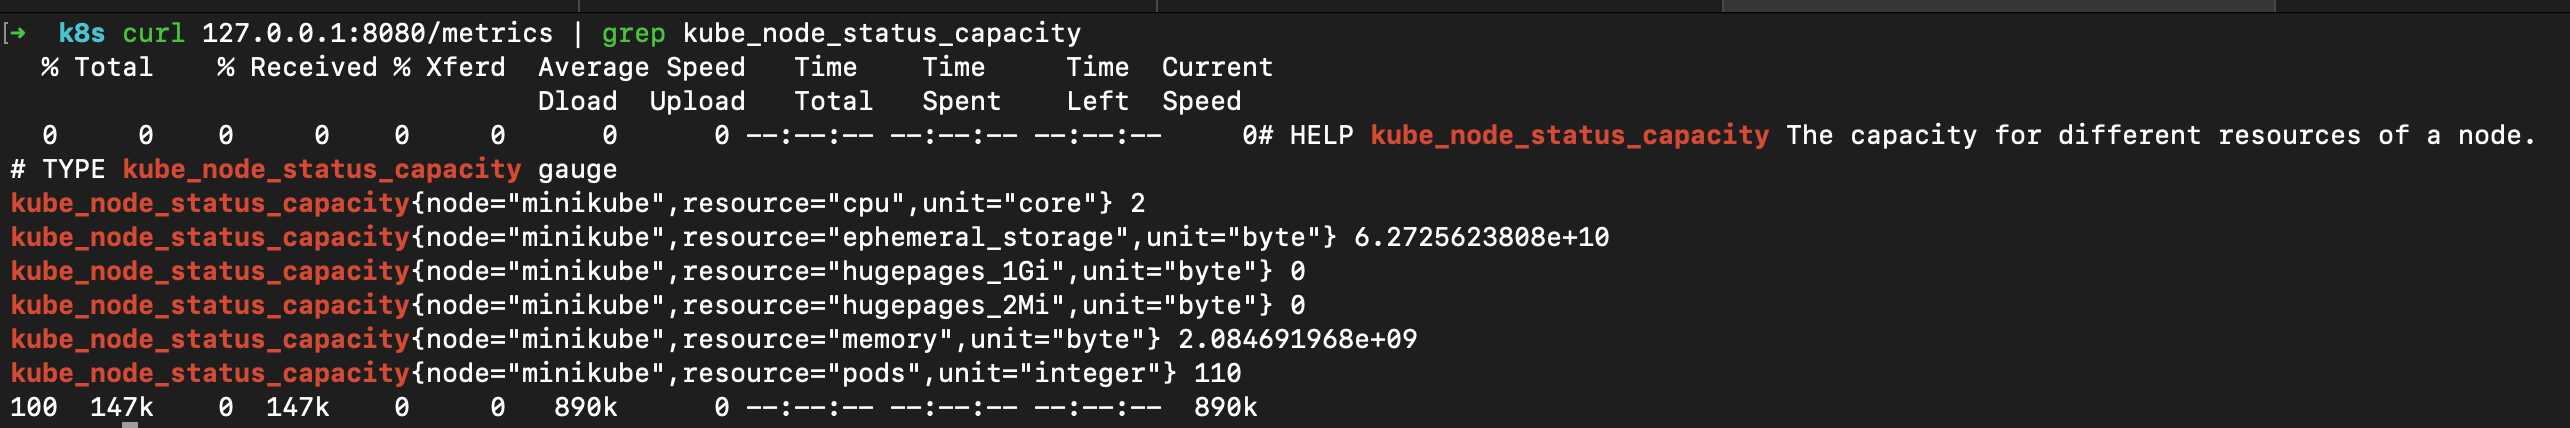
The response contains a lot of information, which can make it difficult to find the exact metric you want. You can use a combination of grep and curl requests to surface the metric you want. The example below will return the node status capacity.
Scaling considerations for kube-state-metrics
As your cluster grows, you might experience increased latency on the /metrics endpoint. As a general rule, it’s advisable to begin by allocating 250Mib of memory and 0.1 cores for kube-state-metrics, which you can increase as needed as your cluster grows in size. It’s important to note that setting the CPU value too low when configuring kube-state-metrics can affect its performance. If you find that you need to allocate more resources, you can do so by creating a resources.yaml file as follows.
Then run helm upgrade --reuse-values -f resources.yaml kube-state-metrics prometheus-community/kube-state-metrics.
Cost considerations
Managed Kubernetes providers charge for the storage cost of metrics ingestions, and the charges you incur depends on the size of the metrics generated. To get full visibility of the changes and trends in your cluster, it’s important to retain the metrics so they can be compared over a period of time. To control costs, it’s important to only expose the metrics that you need. To do this, create a values.yaml file and include the metrics you’d like to track, as seen below.
Then run helm upgrade --reuse-values -f values.yaml kube-state-metrics prometheus-community/kube-state-metrics. Once this is done, kube-state-metrics will only expose kube_node_info and kube_job_status_active metrics as configured above. It’s also important to check your Kubernetes service provider’s documentation and understand the terms of use, so you can avoid unexpectedly high costs.
Final thoughts
kube-state-metrics is a very useful tool in monitoring and observing your Kubernetes cluster. Understanding how it works, implementing it properly in your cluster, and using it to the fullest can provide you with actionable insights that will help you manage your cluster more effectively, improving the health and performance of your cluster while also minimizing the expense.
kube-state-metrics is a powerful tool for monitoring your cluster, but you still need to integrate it with other monitoring tools to unleash its full capabilities. If you want to reduce the number of monitoring tools required to monitor your cluster effectively, or you want to supplement the monitoring tools in your monitoring arsenal, you should consider a third-party solution like Airplane. Airplane is a code-first internal tooling platform that makes it simple to transform scripts, queries, APIs, and more into powerful workflows and UIs.
Using Airplane Views, you can easily build a monitoring dashboard that allows you to manage and troubleshoot issues with your Kubernetes clusters in real-time. Airplane's engineering workflows solution can also streamline your critical engineering use cases, saving your team time and resources.
To build your first monitoring dashboard within minutes, sign up for a free account or book a demo.


