More and more companies are switching to complex architectures like microservices and serverless, and those that do find that tracking the performance and health of apps across a large number of distributed components becomes much more complex. The days of relying on[SNMP monitoring and tracedump to understand what’s happening in your apps are long gone. If you’re in this situation, you need a complex, resourceful application performance monitoring (APM) tool that consolidates multiple facets of monitoring — like instrumentation, metrics collection, dashboards, and analysis — in one easy-to-use platform.
There are two types of APM tools — commercial and open-source. SigNoz is a popular open-source APM tool that is built closely around the three pillars of observability, offers powerful metrics and traces in a single place, and can be self-hosted easily, so you have complete control over your operations. In this post, we’ll take a look at SigNoz and help you understand its relevance in the modern ecosystem.
How does SigNoz work?
SigNoz presents itself as an open-source alternative to Datadog, a leader in the APM and observability industry. For an open-source tool, it offers quite powerful features, such as root cause analysis, detailed trace filtering, and scalable stream processing architecture, with other features like role-based access control (RBAC), single sign-on (SSO), and anomaly detection in its roadmap.
Key features
Here we’ll explore some of SigNoz’s key features and show how it differentiates itself from competitive tooling.
Metrics and traces in a single place
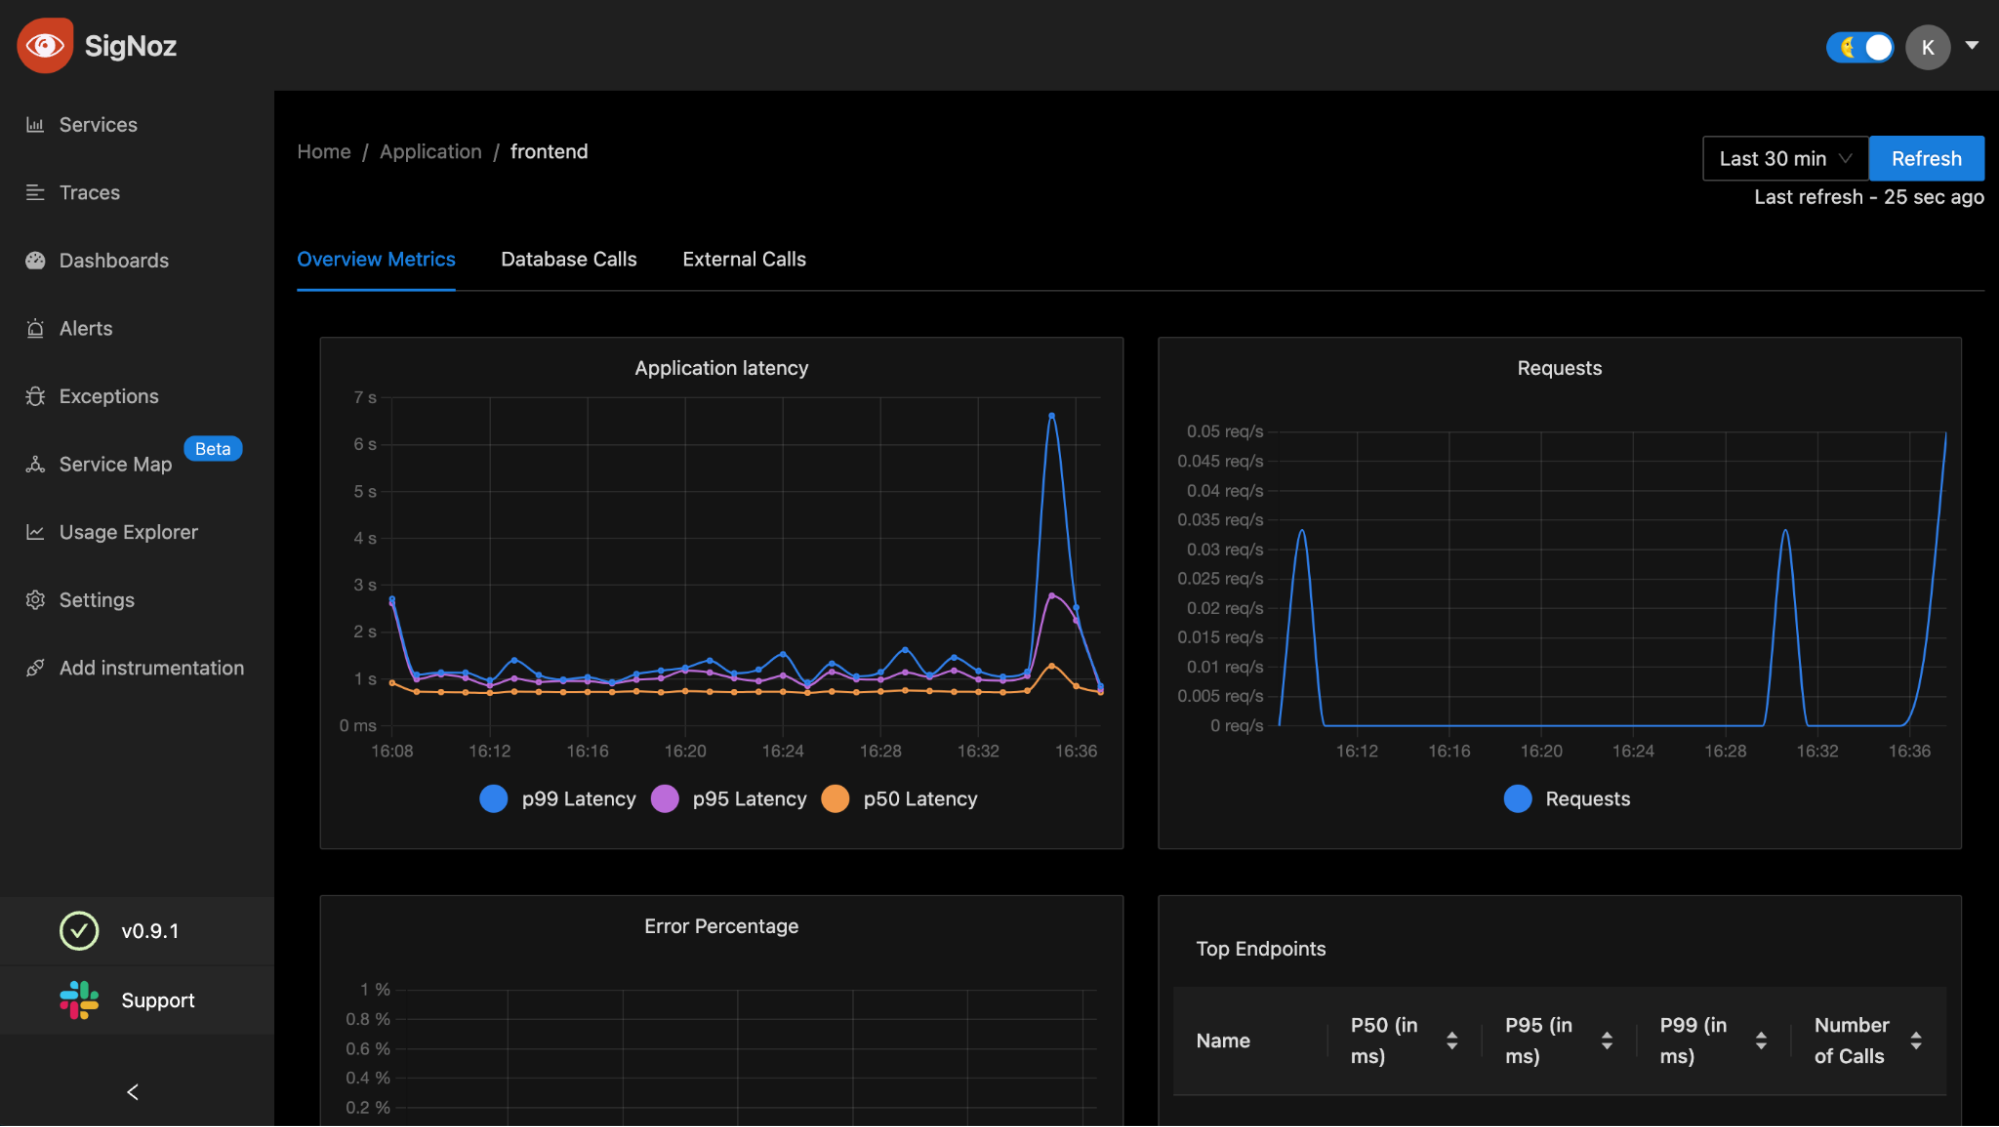
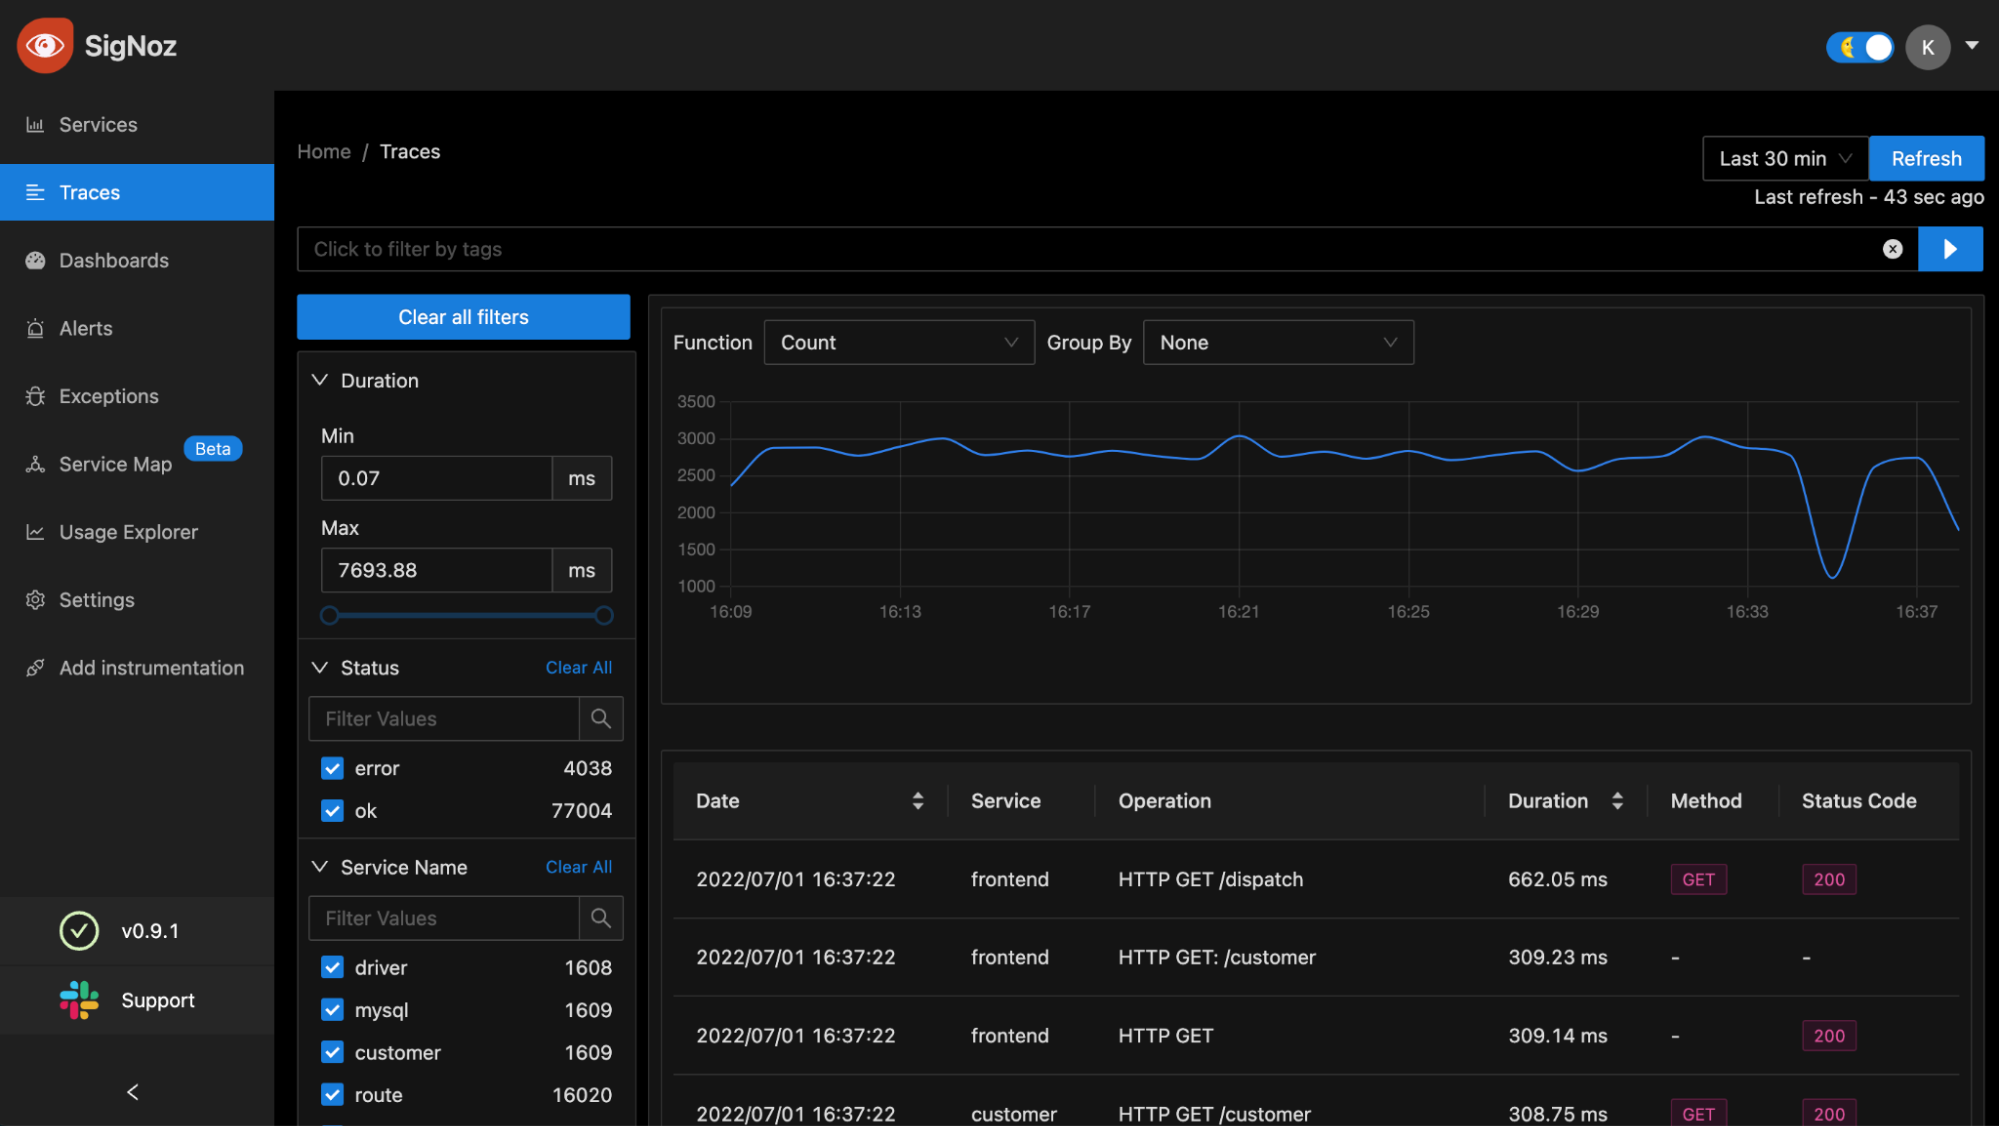
SigNoz puts metrics and traces together in its smooth, intuitive UI. This makes it easy for you to get insight into what’s happening in your apps. The dashboard is self-explanatory, and you can click on individual items in the list of requests at the bottom to get more details on each request.
Easy-to-use dashboards
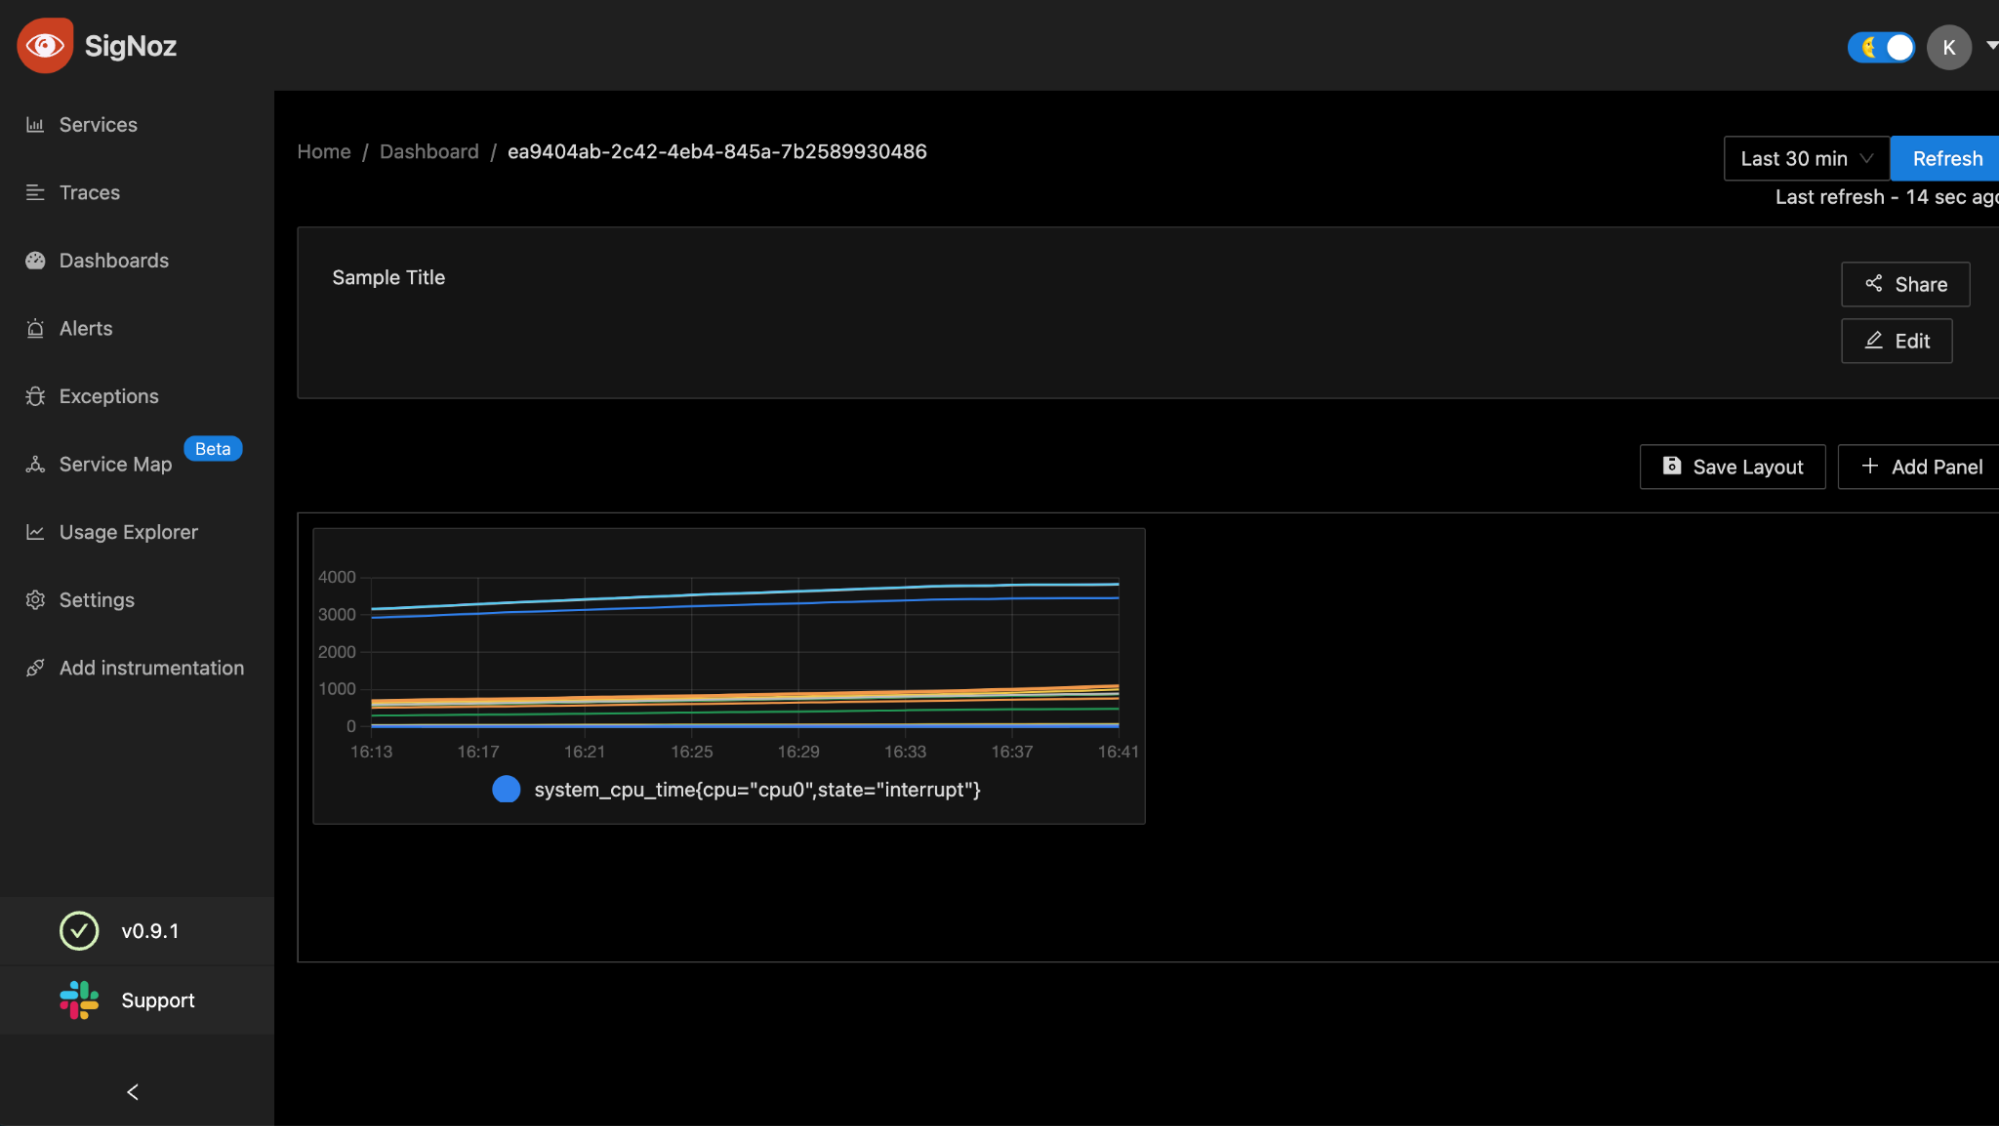
Building dashboards is relatively easy in SigNoz. You can add widgets to your dashboard, and your widgets can query your metrics directly, using PromQL, ClickHouse Query, or a simple query builder.
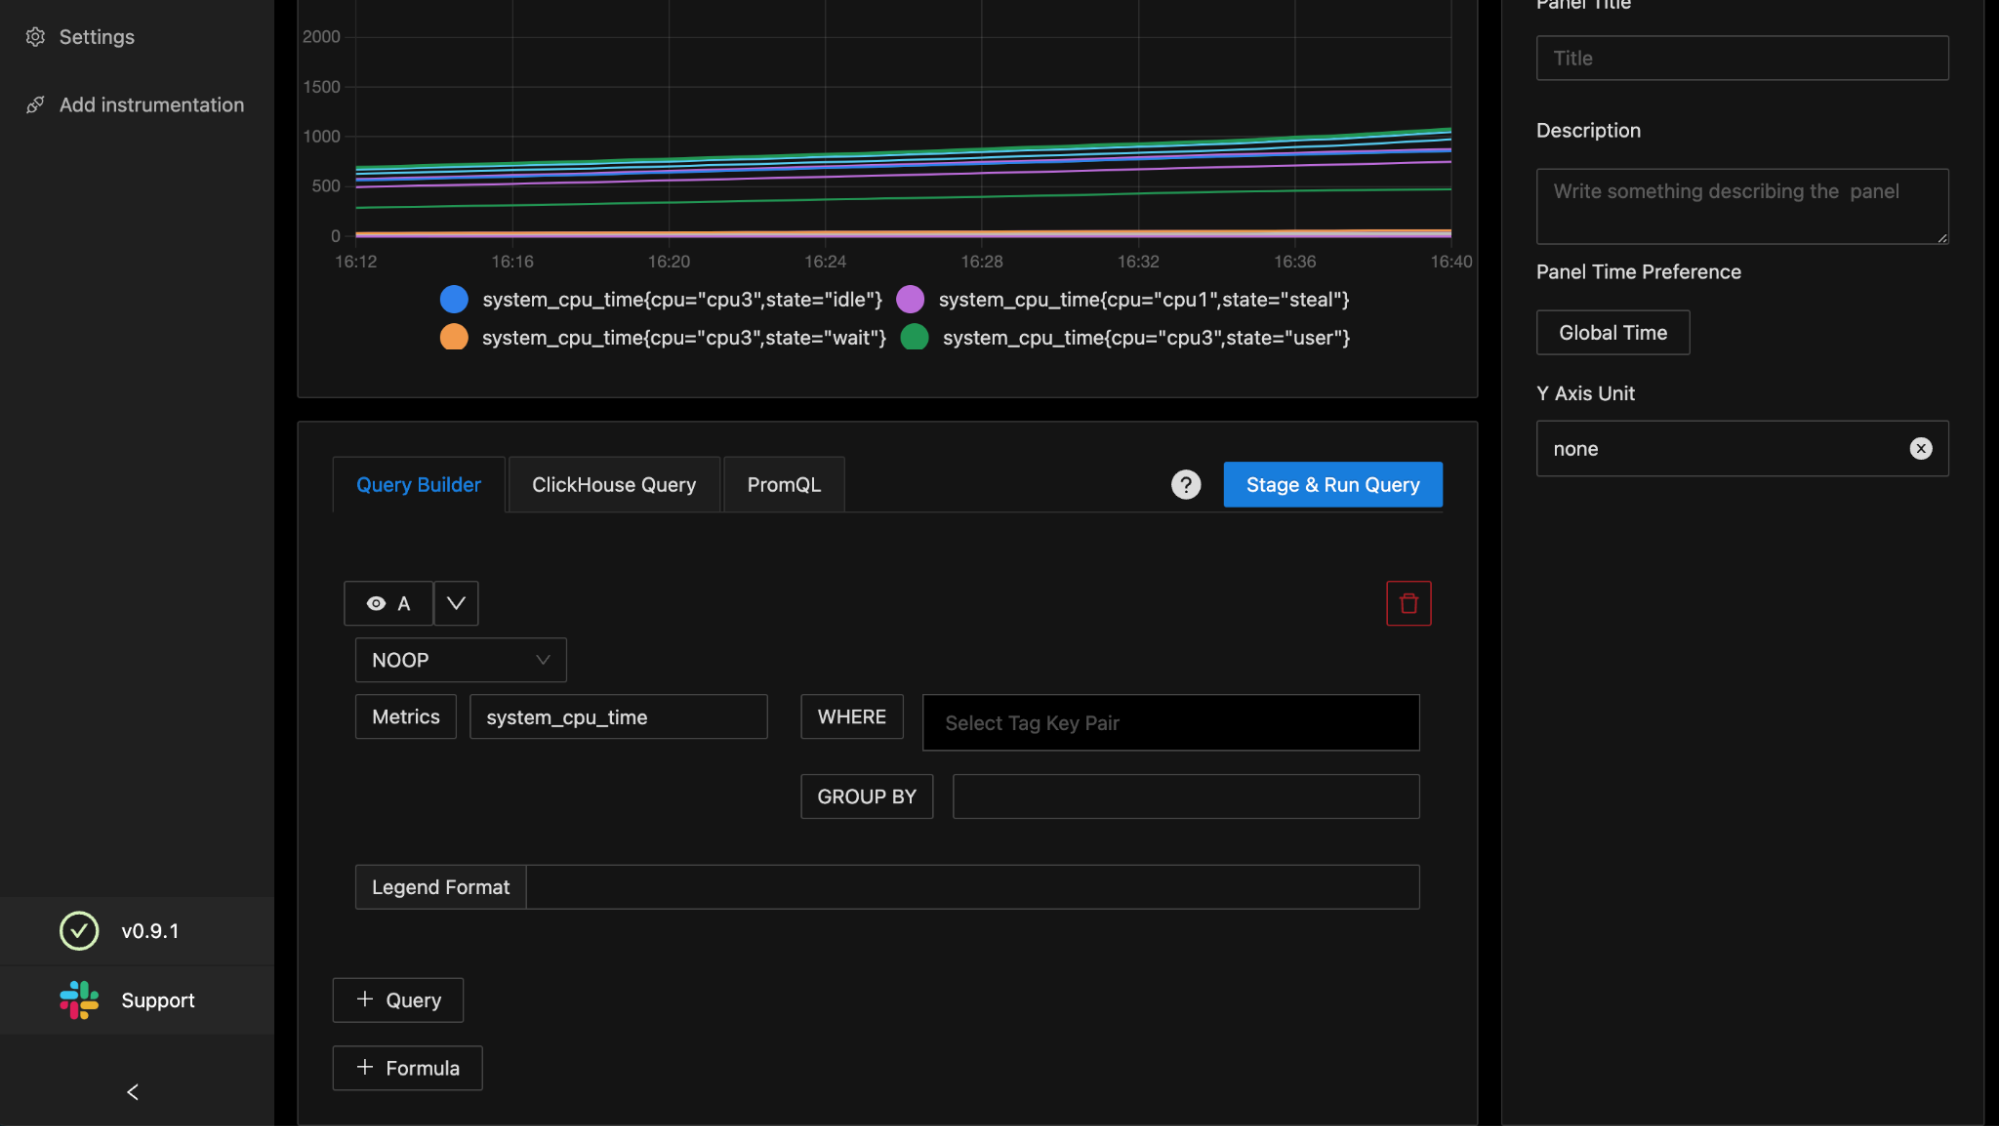
Once a dashboard is built, you can view all the visualizations in one place. You can also save and share dashboards with other members of your team.
Powerful trace filtering
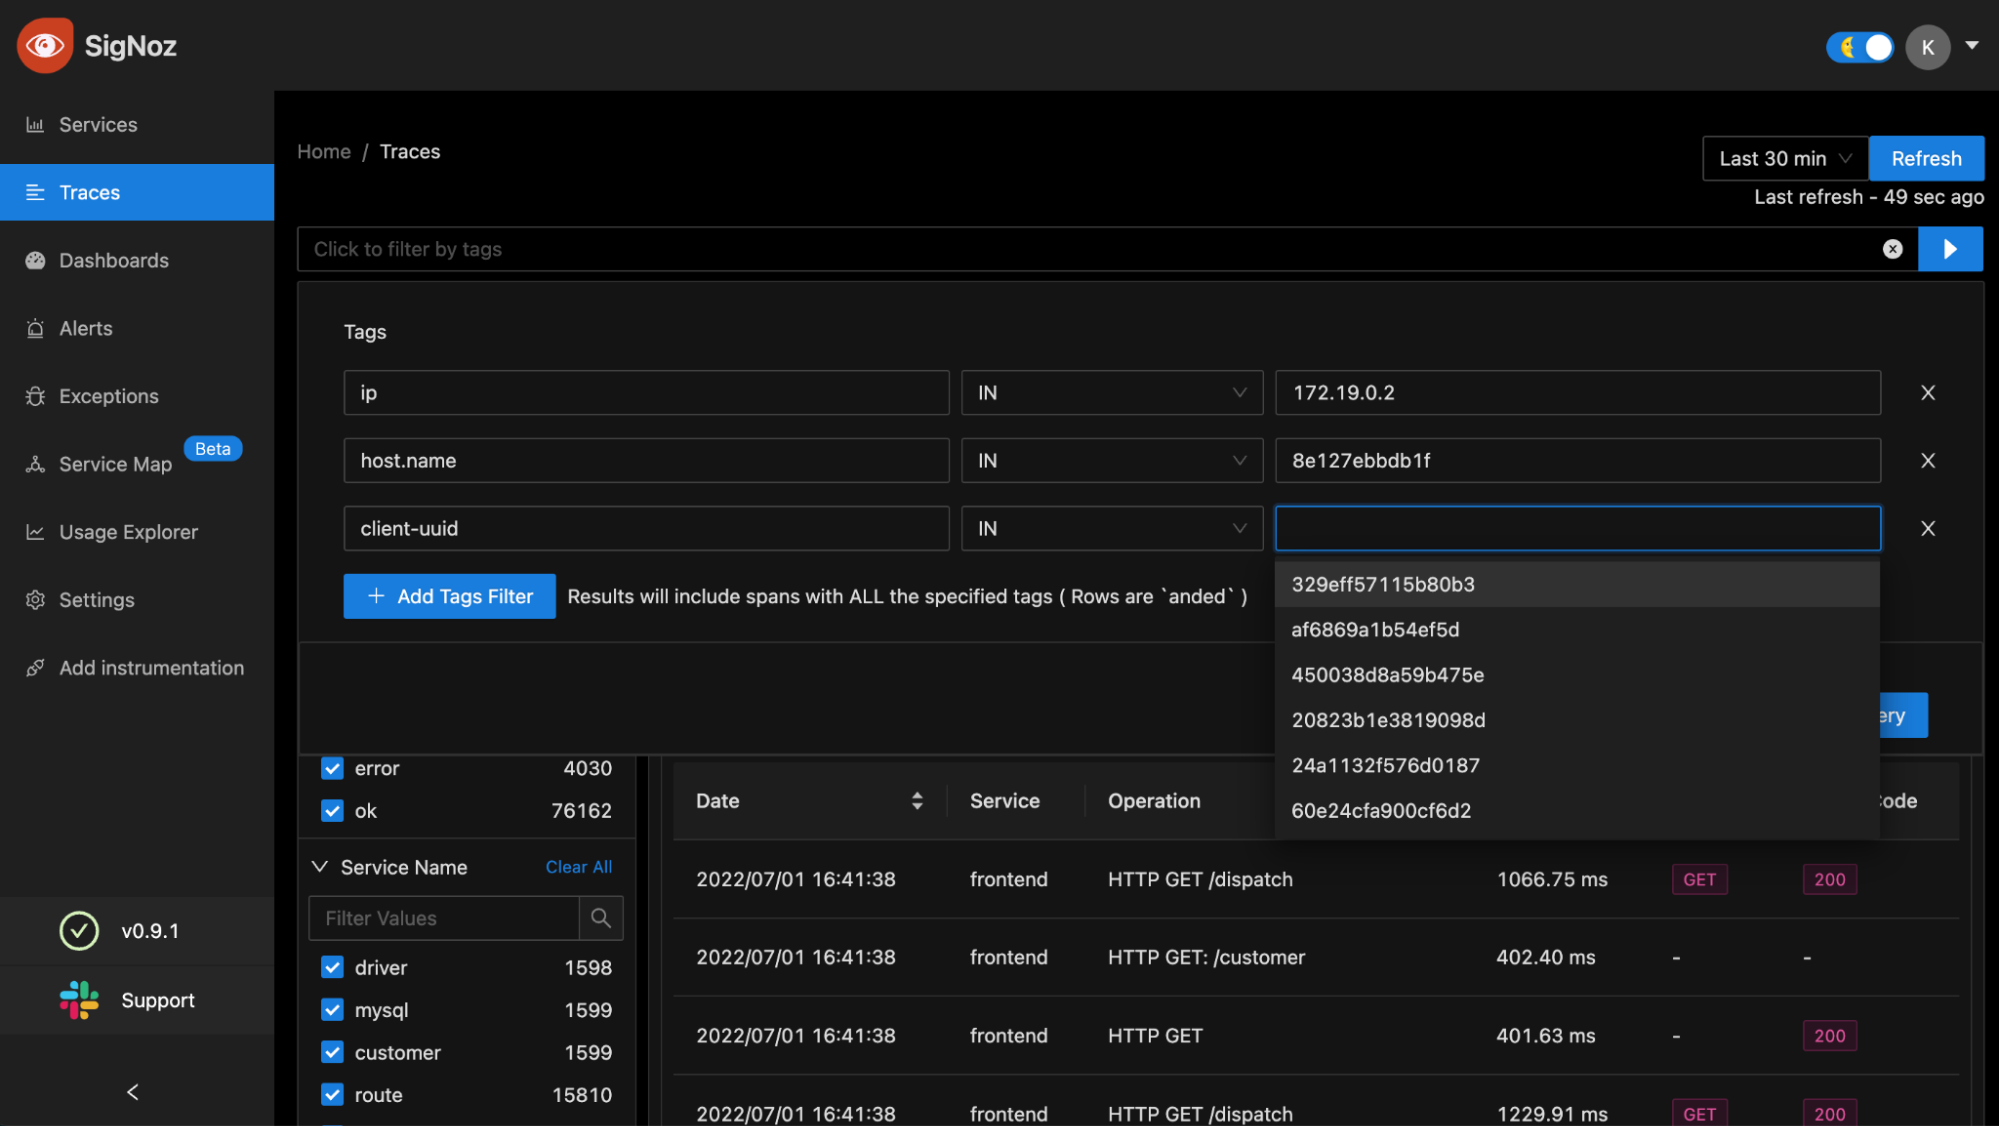
Some of SigNoz’s most important offerings, given that it is an open-source tool, are its filtering capabilities. You can use the quick filters on the left side of the interface to hash out the information you need or run complex queries using all possible tags from your traces. The filters are easy to apply, and you can always drill down into the results to know more about them.
PromQL-backed alerts
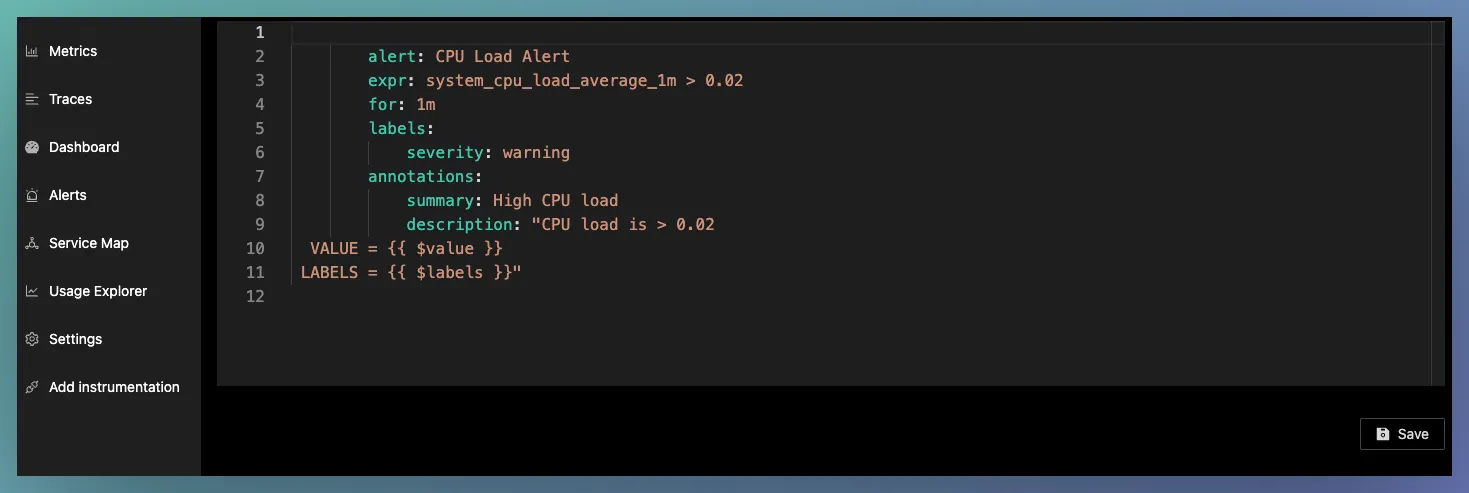
You can use a Prometheus-like editor to quickly set up alerts in SigNoz. This editor allows you to conveniently set the condition, period, and labels for your alerts.
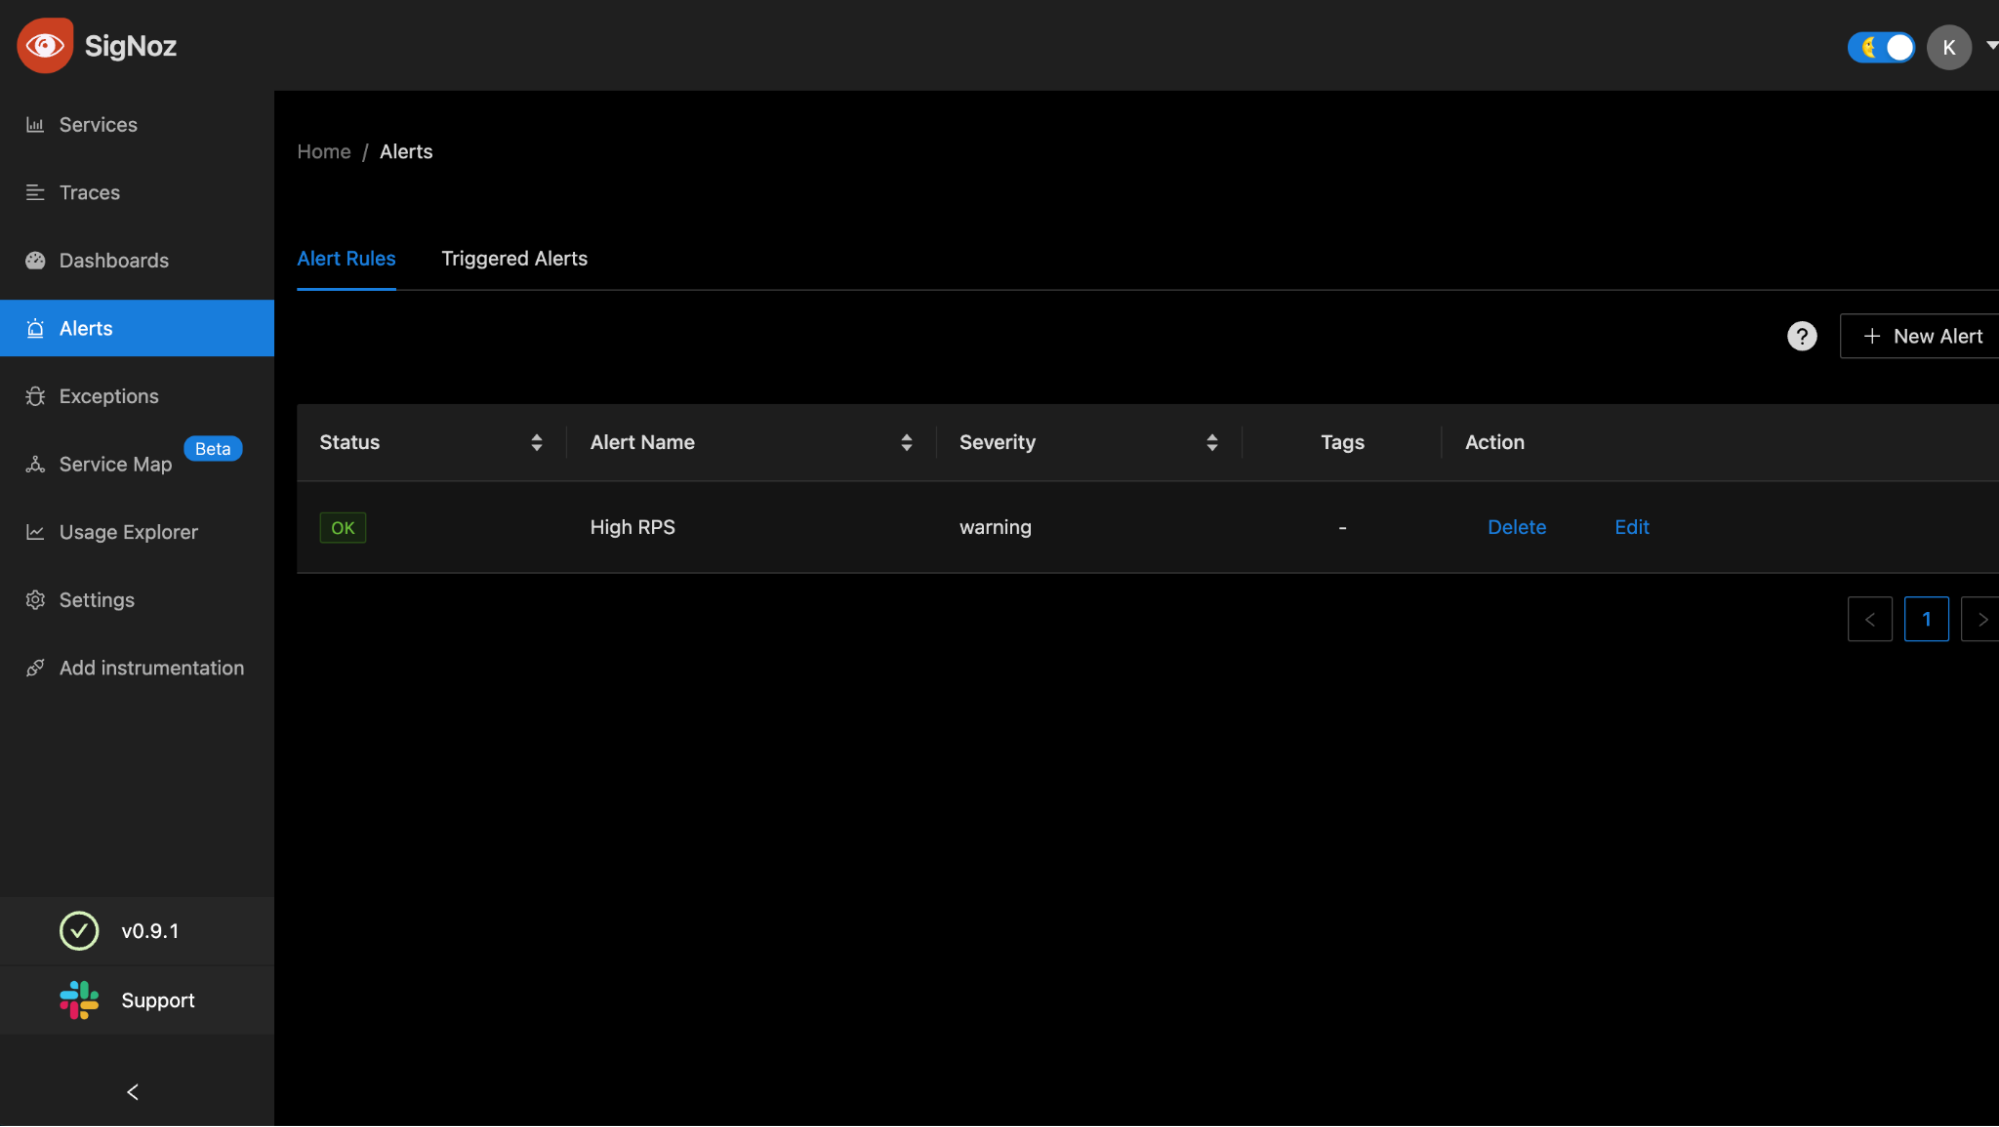
Once you save an alert, it shows up in the list. When an alert gets triggered, it shows up in the another tab, "Triggered Alerts.” You can apply filters and group alerts, but the feature isn’t very advanced.
Service maps
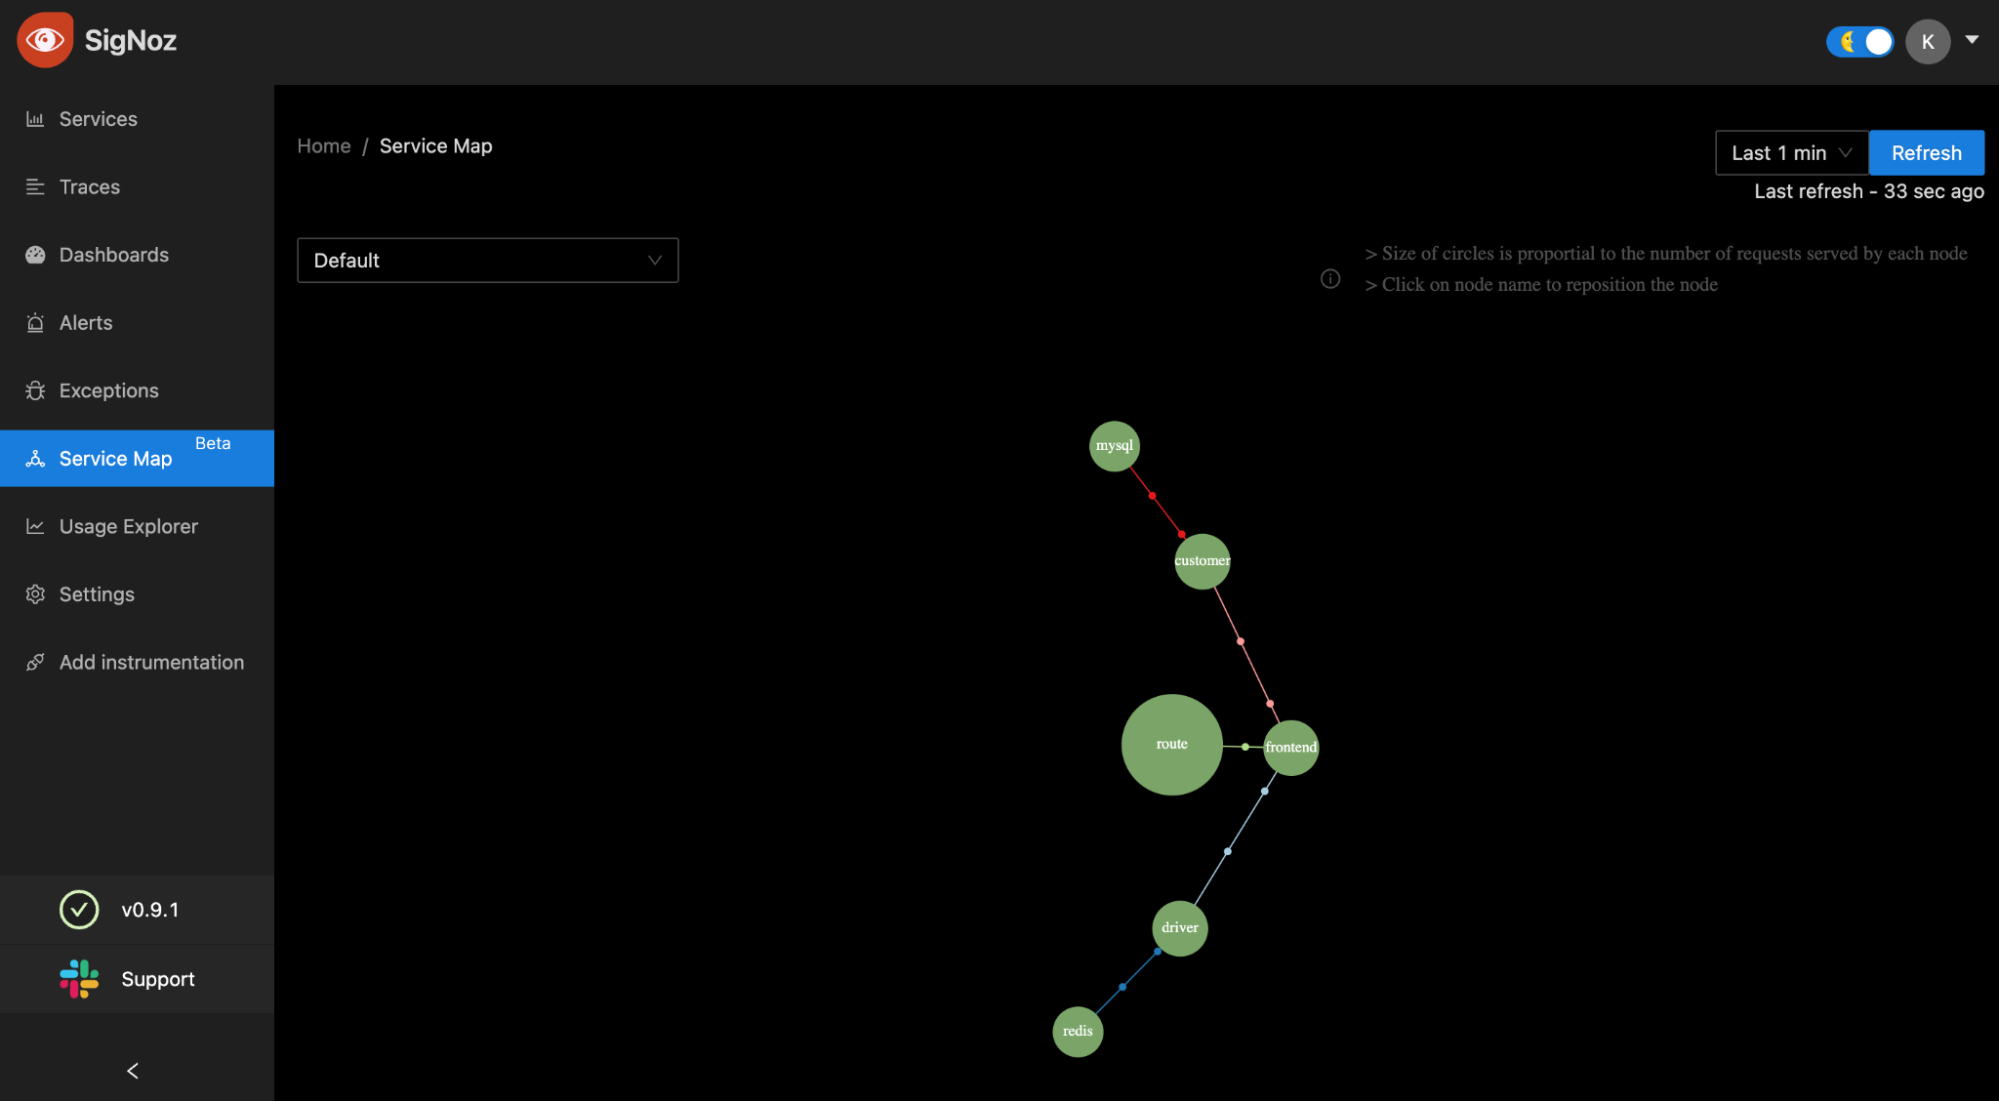
Service maps are a unique way to view all the components of an app at once. They help you to view the path of requests inside the app, and some even allow you to view metrics along with the components.
SigNoz presents you with a very simple service map that shows how the components of your app are connected. The size of each node in the map is proportional to the number of requests it receives on average. For an open-source tool, the service map offered by SigNoz is more than sufficient.
Installation, support, and integrations
Installing the tool is quite simple. There are different methods for Docker-based and Kubernetes-based applications. For installing SigNoz on a Mac or Linux machine, all you need to do is clone their Git repository and run their install script. The script will take care of everything that’s needed to get SigNoz up and running. Then you can play around with the SigNoz dashboard at http://localhost:3301.
The next step is instrumenting your app, which is specific to your app’s tech stack. All you need to do is install the OpenTelemetry-based dependencies and add a pre-built script to your app (like this one for NodeJS) to get started. In time, your dashboard will start to show you insights into your app’s performance.
For an APM tool that can provide you with root cause analysis and deep trace filtering, the installation process is a breeze. But since SigNoz is an open-source tool, direct support options may seem limited. You can, however, always tap into the Slack community of 1,000-plus users who have used SigNoz and can assist you wherever needed.
User interface and ease of use
As mentioned previously, SigNoz’s UI is uncomplicated, clean, and easy to use. The left pane hosts links to all essential components of your monitoring setup, and the panels on the right make perfect use of the available screen area to show information via graphs and tables.
Dashboards are easy to build and use. Compared with other open-source tools like Prometheus and Jaeger, SigNoz’s UI is a class apart and feels very premium.

Third-party integrations
SigNoz offers integrations with Slack, PagerDuty, and webhooks to link with any other external services directly for alerting. You don’t get an extensive list of third-party integrations as you do with tools like Datadog and AppDynamics — but, SigNoz covers almost everything you’ll need for a simple setup.
Pricing comparison vs. Datadog
Since SigNoz is an open-source tool, it is completely free to use. However, when you’re self-hosting it in your production environment, you might incur costs. SigNoz also offers cloud hosting options.
To give you an idea of the cost difference, for every $20,000 per month you would spend on an APM tool like Datadog, you can get similar services from SigNoz at a mere $676 per month (with 2x redundancy). Even if you add more hosts, SigNoz will still turn out to be around 10x less expensive.
Why should you use SigNoz?
Now that you know the tool well, the next step is to understand whether it’s the right tool for you. Here are a few reasons you should use SigNoz:
- Open-source: Since SigNoz is completely open-source, you get to try it in your projects without any compliance or security concerns. You have access to its product roadmap and can support its development directly. The fact that it is free to use is an enabler for many small startups that are just starting to tap into the realm of observability and monitoring.
- Easy-to-use user interface: For an open-source tool, SigNoz’s UI feels quite fluid and advanced. Everything that you need is easily accessible, and it takes only a few clicks to drill deep into an issue or event.
- Powerful filtering and aggregation options: SigNoz offers a very powerful filtering and aggregation experience for traces and metrics. It is on par with quite a few paid tools in the market.
- Enhanced flexibility and privacy: Since SigNoz is open-source and you can self-host it, you retain complete control over your app data. You do not need to worry about privacy laws such as GDPR or CPRA. Also, since you can self-host the infrastructure, you don’t need to wait for scheduled maintenance or downtimes.
Alternatives to SigNoz
If you’re not sure SigNoz would be the right fit for you, here are a few alternatives:
Jaeger
Jaeger is an open-source distributed tracing solution that empowers you to easily monitor complex distributed systems. Some of Jaeger’s top features offered are:
- Distributed transaction monitoring
- Root cause analysis
- Dependency analysis
- Distributed context propagation
Graduated from the Cloud Native Computing Foundation, Jaeger is open-source, hence free to use (you’d still have to bear self-hosting costs). However, Jaeger lags behind SigNoz in terms of user experience and visualization capabilities.
If you’re looking for an easy-to-use open-source APM solution, you might want to consider SigNoz over Jaeger, due to the former’s intuitive UI and ability to handle metrics.
Prometheus
Prometheus is one of the most popular open-source monitoring solutions in the industry. It’s primarily used to monitor containerized workloads, but it supports monitoring for non-containerized apps as well. Here are some of its key features:
- Self-contained (no external/network-based dependencies)
- Service discovery
- Stores metrics in time-series format
- Accessible data formats
However, it’s important to note that Prometheus focuses only on metrics. It does not make up for a full-fledged APM solution. You don’t get features such as distributed call tracing and end-user monitoring. Also, as withJaeger and SigNoz, you’d have to self-host Prometheus or choose one of the managed services.
Prometheus is great when it comes to small-scale deployments. But when you’re looking to go big, horizontal scaling and persistent storage become an issue. On top of that, Prometheus’s UI does not come close to SigNoz’s in terms of simplicity and ease of use.
Nagios
Adding to the list of free and open-source APM solutions is Nagios. Released in 2002, Nagios has stayed an important monitoring tool for quite a long time. Here are some of its prominent features:
- Powerful monitoring with detailed insights into your web apps
- Multi-tenant capabilities
- A huge, active community of more than one million users
- A variety of available plugins
However, Nagios is often regarded as a tool of the past. It seems to struggle with scalability after a certain point, as its configuration becomes difficult to manage. Setting up Nagios on the cloud is time-consuming, and some components of Nagios require Linux knowledge, even for Windows admins. So Nagios is not exactly the most ideal open-source APM for today, but it can still do the job if needed.
Final thoughts
As an open-source APM, SigNoz scores well on features and ease of use. However, it could use a few more third-party integrations. The community around SigNoz looks promising and is ever-growing. Therefore, you should feel free to use SigNoz if you’re looking for an open-source APM tool with a minimalistic UI and all essential features available in one place. If you’re looking for a more detailed solution with advanced features like distributed tracing, real-user monitoring, and more, you might need to look toward a paid solution.
If you're looking for a maintenance-free platform that makes it even easier to track, monitor, and manage your applications, then consider using Airplane. Airplane is the developer platform for building custom internal tools. You can use Airplane Views to build complex, React-based UIs to manage the health of your applications and troubleshoot issues quickly.
To test it out, sign up for a free account or book a demo.


