


Microservices create stand-alone, distributed, and asynchronous services that site reliability engineers need to monitor to see if an application failed on deployment or behaved unexpectedly.
Monitoring is the superpower that helps you observe your system’s health, creates reliability, and ensures your users are getting the best application experience possible. In monitoring, you look at infrastructure and track/mitigate problems, like high resource usage, high latency, and downtime in real time; and it helps you to be proactive with your infrastructure.
In this article, you’ll learn about two open-source monitoring tools, Prometheus and Jaeger. You’ll learn how these tools are similar, how they’re different, and when you should use each one.

Prometheus

Prometheus is growing quickly and is among the top three CNCF projects in terms of velocity.–CNCF
Prometheus is an open-source Cloud Native Computing Foundation (CNCF) graduate project used for generating alerts and monitoring metrics by using time series data as the source for metrics. From its inception at SoundCloud, the project has continued to grow in number of contributors and adoption from companies and users. The popularity of Prometheus is likely due in large part to the rapid growth of Kubernetes, where Prometheus is particularly useful.
The tool supports multidimensional data models with a time series identified by a key-value pair where the key is a metric name. Your metrics are scraped with your HTTP endpoints via a pull-based data collection model. PromQL, a query language, helps you slice and dice data according to your needs, and various integrations, like Grafana, can help you create beautiful dashboards.
Third-party exporters allow you to export existing metrics from external systems.
Jaeger

Jaeger is also an open-source platform that was created by Uber in 2015 for troubleshooting and monitoring distributed microservice environments with the help of traces. This CNCF graduate project helps you trace the path of requests in a mess of microservices so that you can perform root cause analysis (RCA by isolating problems using a dashboard of call flows.
With its end-to-end distributed tracing, Jaeger helps you optimize your services. This is achieved with the help of client libraries in multiple languages, which aid in your understanding of the flow of requests and traces via the web UI. In short, you can use Jaeger for the following:
- Distributed context propagation
- Distributed transaction monitoring
- RCA
- Service dependency analysis
- Performance/latency optimization
Prometheus and Jaeger: differences
Both Jaeger and Prometheus are extensively used in the monitoring space, but they’re very different by design.
Jaeger is used for distributed tracing to track user requests, whereas Prometheus’s expertise lies in time series metrics. If this sounds a bit complicated, remember Prometheus focuses on the system as a whole. It monitors metrics, like Disk I/O, CPU usage, and other defined metrics; and it helps you store your data in chronological order, making metrics simpler to navigate.
A time series is a sequence of sequential data points that occur over a particular interval of time. A “metric”, in this case, refers to the piece of data that is tracked at each increment of time.– Anodot
In contrast, Jaeger focuses on the application and not the whole system. It provides a distributed tracing system that helps you collect the application information, not your complete infrastructure. When you need to find out why your request is running slow and you want a way to track all your incoming and outgoing requests individually, Jaeger can help.
Architecture
Jaeger, by design, can ingest a massive amount of data. The agent–collector relationship (agents push data to collector) can scale to numerous nodes or hosts without issues. Jaeger is meant to scale horizontally, and you can do this ad infinitum.
On the other hand, Prometheus isn’t meant to sustain horizontal scaling. Even using workarounds, like shredding metrics across several Prometheus servers, horizontal scaling isn’t efficient and adds more complexity to the system.
Your Prometheus servers can efficiently scale vertically, but it’s not very sustainable when you require monitoring millions of metrics and your server starts pulling them from endpoints. A million metrics can use more than 100GB of memory, which might cause issues in Kubernetes.
Prometheus’s other limitation is its inability to have a pluggable database apart from the local disk. Pluggable data stores are essential for operating at a particular scale.
Jaeger’s storage is a pluggable component and supports Cassandra, Kafka, and Elasticsearch for traces after running through the processing pipeline. Memory storage is supported by default, but it’s not recommended to be used in production.
Prometheus and Jaeger: initial configuration
After learning about the value these tools provide, the biggest question is how hard they are to implement or maintain. The best part of being a CNCF graduate project is that they are both very mature, with excellent documentation and a massive community of support.
These tools can be easily installed in the cluster by using Helm charts or applying manifests available on GitHub releases using the precompiled binary.
If you want a shortcut, the following commands will install Prometheus via Helm:
Setting up Prometheus to monitor your whole infrastructure is relatively easy. The process is straightforward until you dive deep into advanced configurations.

On the other hand, Jaeger is complicated in its simplest form due to its architecture. You need clients, agents, and collectors to start distributed tracing. That means your application code should be refactored to add the client code so that it can generate a trace.
The following steps add a sidecar injection to your YAML manifests (fifth line) to facilitate a user datagram protocol (UDP) connection between the agent and collector.
After you facilitate a UDP connection, you need to enable cluster-wide permission if you keep your Jaeger operator and deployment in a namespace other than the one your applications are deployed in, which is the most common scenario.
Another issue with Jaeger is that different teams need to work on it for initial configuration. It’s not straightforward like Prometheus, but since the project is mature, there’s plenty of documentation available to help. You can always jump into the Slack community for more help from users and contributors.
Prometheus and Jaeger: comparing ease of use
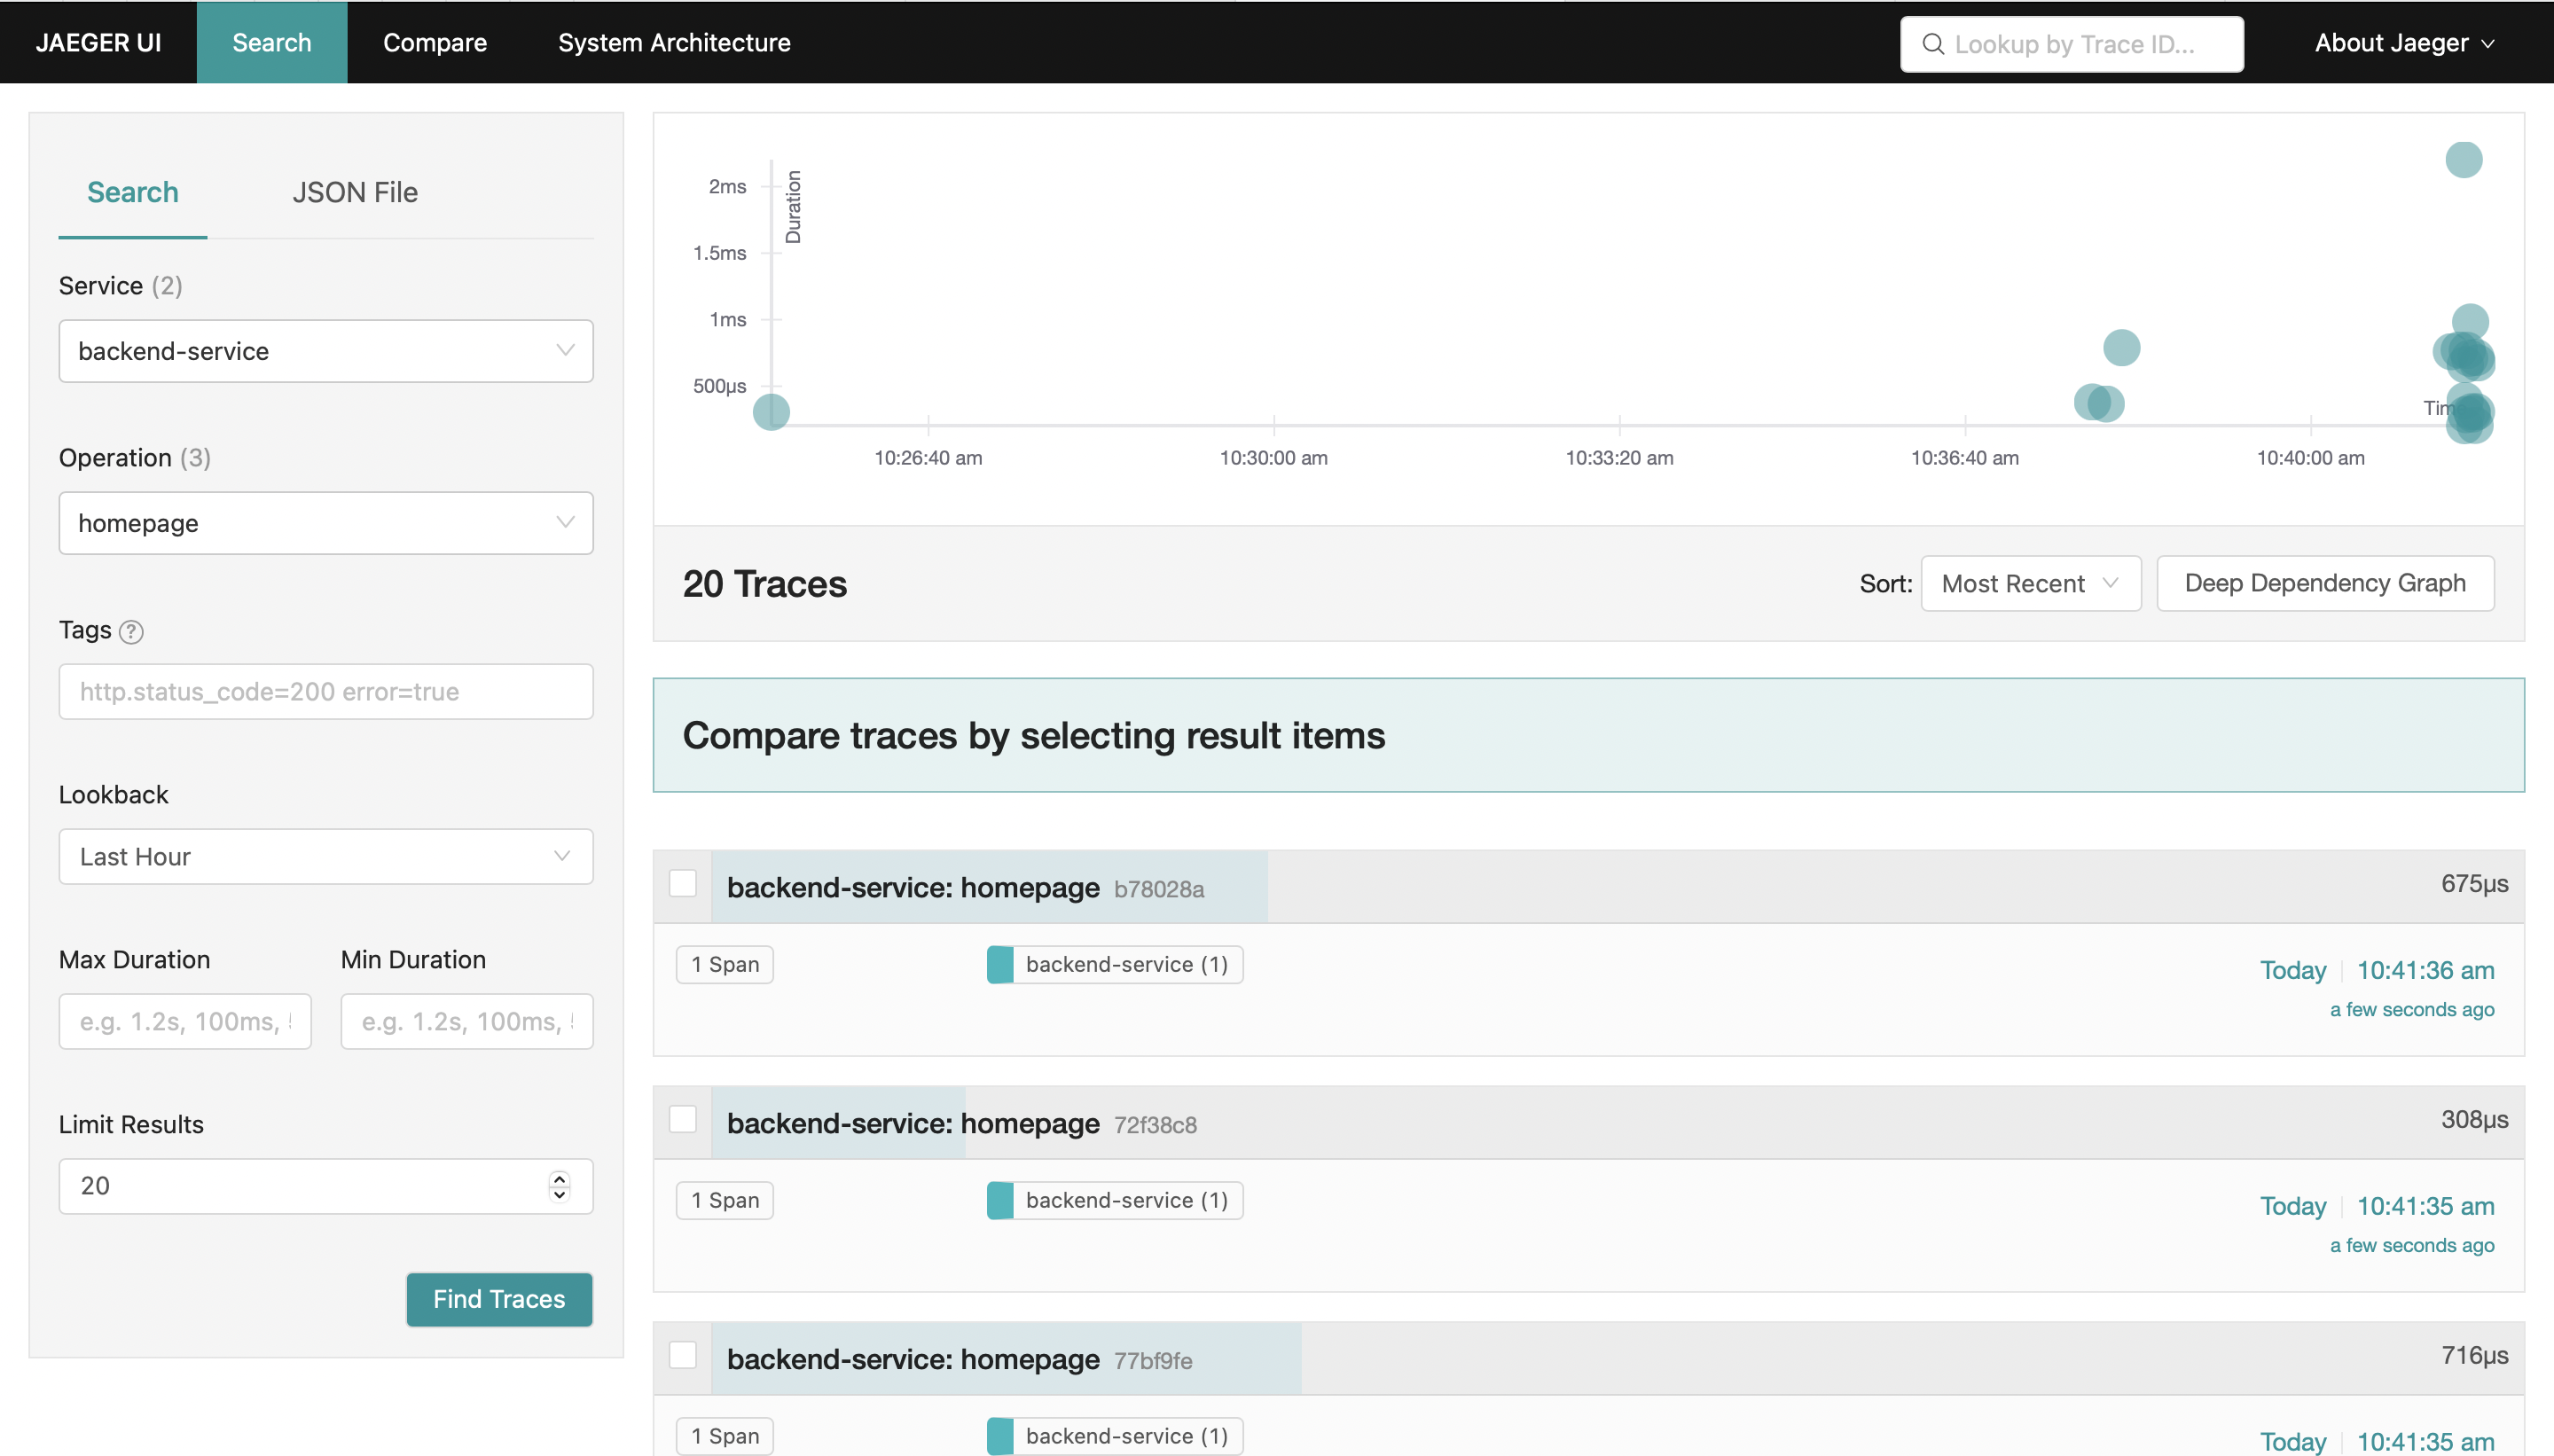
Monitoring isn’t straightforward when visualization isn’t available. Jaeger’s web UI is mature and has dependency diagrams to help. After you identify an error and trace the routes to pinpoint the cause, you can effortlessly start looking at traces your application produces and conduct RCA.
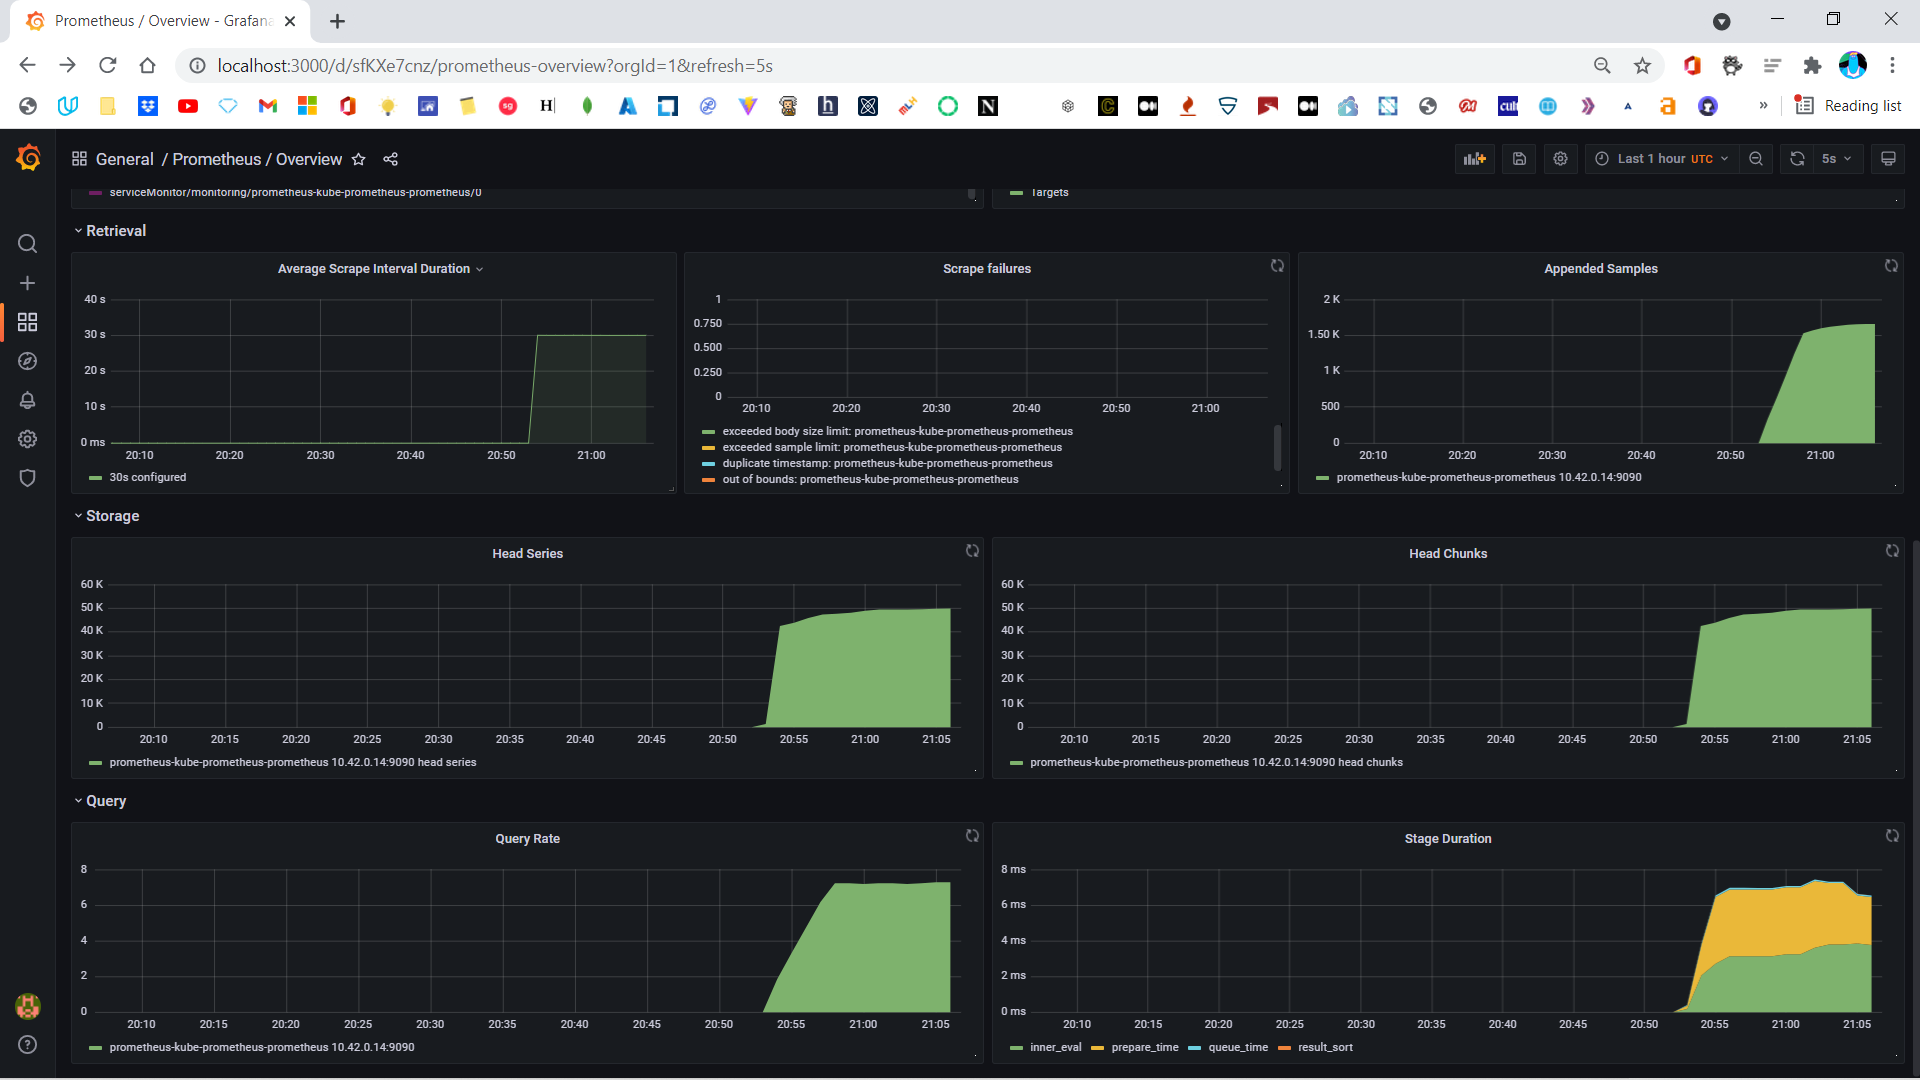
Prometheus, on the other hand, is very limited with its web UI. Grafana helps Prometheus reach its full potential by supporting queries. These queries use PromQL to filter and aggregate metrics in real time to provide you with rich contextual metrics data. Once set up, you can watch the data updating in a specific time duration you set.
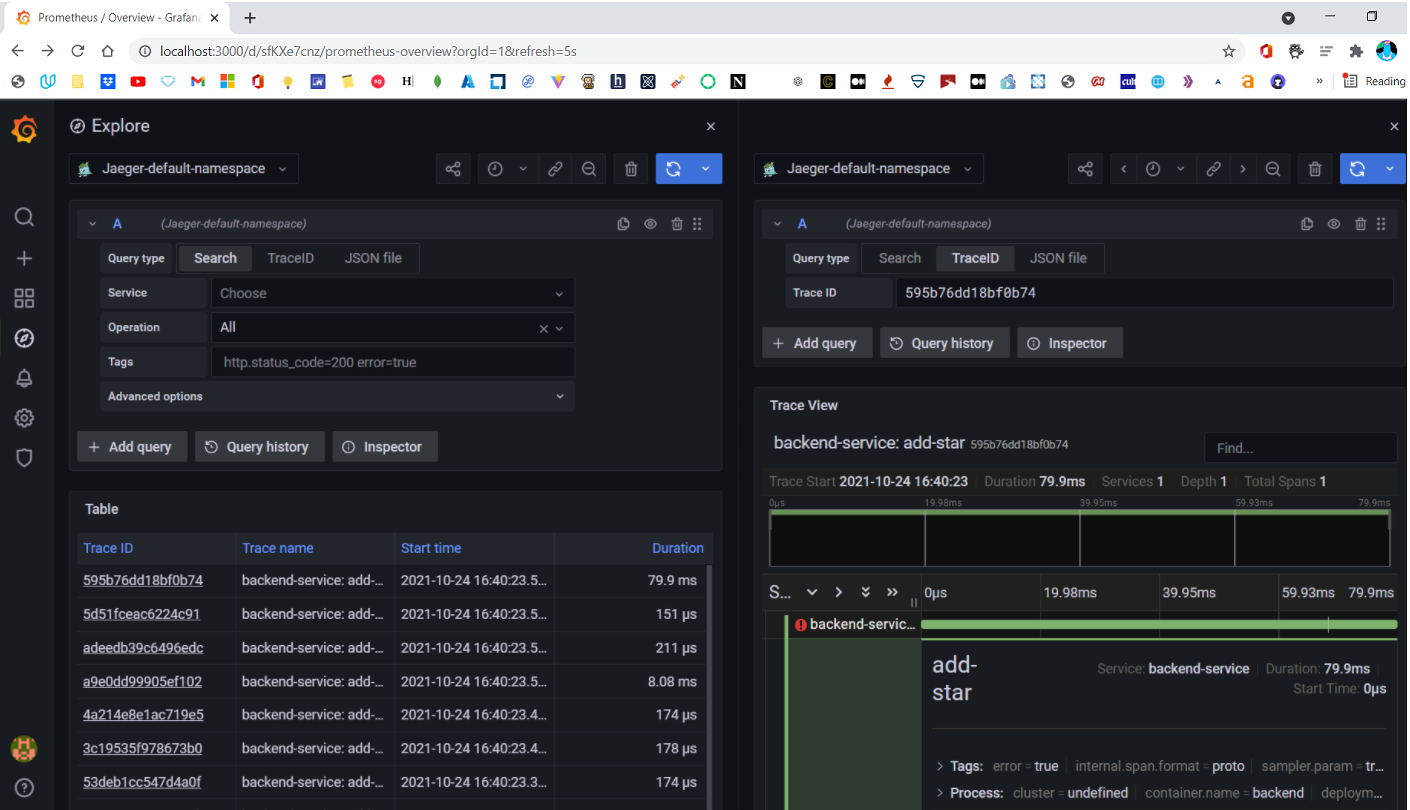
Developers love to plug Grafana with every data source they can. So Jaeger dashboards are popular with Grafana as well.
Prometheus and Jaeger: using them together
Monitoring and tracing go hand in hand with success for engineering teams. Prometheus gives you the ability to detect anomalies with your infrastructure, and Jaeger helps you fix them by diving deep into the requests and pinpointing the exact cause of the error on your application. When you use both of these tools, you create an ecosystem where your users have the best experience possible.
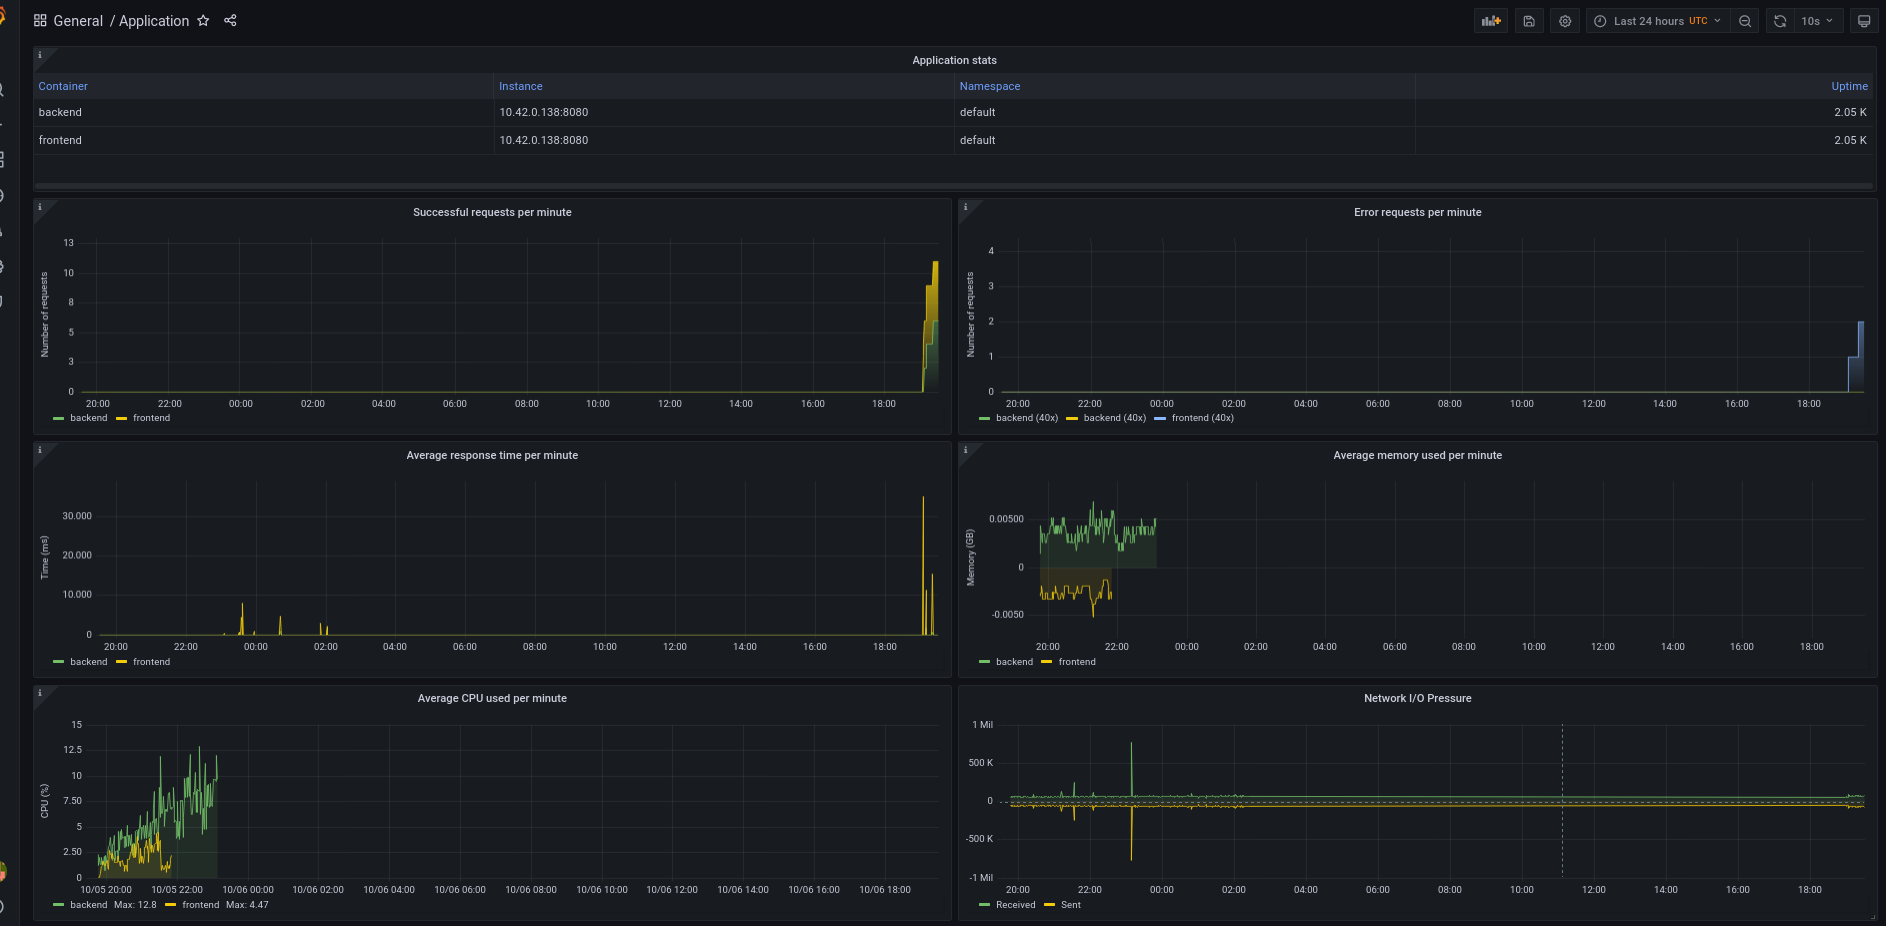
The dashboard above shows these key performance indicators (KPIs):
- Application stats show information about application services.
- Successful requests show the total number of successful requests.
- Error requests show the total number of 40x and 50x error requests.
- Average response time shows the average response time of successful requests (status 200).
- Average memory used shows the average memory used.
- Average CPU used shows the average CPU used.
- Network I/O Pressure shows the amount of I/O operations in the node.
This is a simple dashboard where you monitor the metrics listed above to get pod-level and application-level metrics that help you monitor your application efficiently. You can customize them to meet your needs and utilize both applications together.
Final thoughts
You should now understand how beneficial monitoring is for your infrastructure. Microservices bring performance at the cost of complexity, and monitoring helps you manage the complexity efficiently. The scraping capability of Prometheus and tracing of Jaeger make them a perfect fit for your engineering team. Using both these tools together helps make your infrastructure resilient, but the usages will depend on your needs.
If you want to monitor for resource utilization and optimization, Prometheus is the superior choice; and if you’re going to monitor relationships between the services, go with Jaeger. You can read the official documentation of Prometheus and Jaeger for additional information.
Third-party tools, like Airplane, provide out-of-the-box solutions and help you monitor your Kubernetes cluster’s health with dashboard templates and easy-to-set alerts. You can quickly customize dashboards in Airplane using Views and build single or multi-step workflows that anyone on your team can use. Airplane also offers strong defaults, such as job scheduling, permissions setting, and more.


