


Application performance monitoring (APM) tools are essential for developers because they measure the health of software applications using different metrics. The need for monitoring increases with new features, so the sooner a team sets up an APM the better.
The monitoring industry is constantly evolving, but here are ten open-source APMs that stand out from the rest. These tools cover a variety of use cases and each offers unique benefits. One of these tools might be exactly what your engineering team is looking for. Let's dive in!
- Signoz
- Pinpoint
- Prometheus
- Jaeger
- Glowroot
- Apache SkyWalking
- Graphite
- Scouter
- Weave scope
- InspectIT Ocelot
Signoz
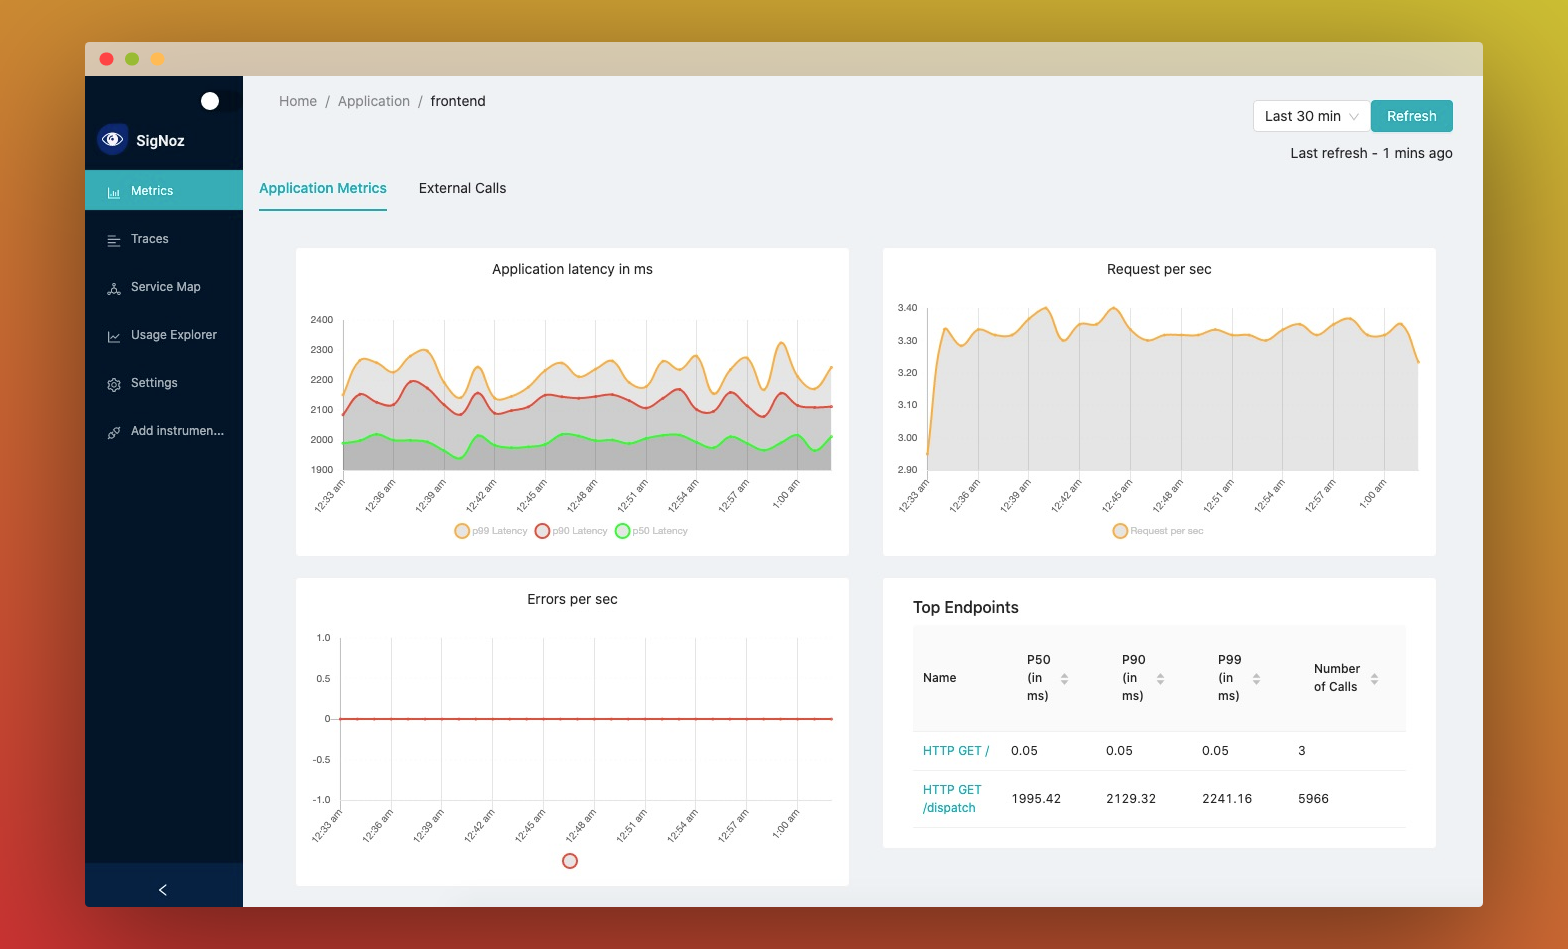
With a vibrant community and active development, Signoz is one of the most complete open-source APM projects available.
What makes it stand out is the unified UI for metrics and traces, besides advanced filtering on trace data and custom aggregation.
Highlights
- Offers integrated UI for metric and traces
- Runs business-specific queries
- Runs aggregates on custom tags
- Offers native support for OpenTelemetry
- Built using a modern stack including Golang and React in TypeScript
Pros
- Installing Signoz in a single node is easy once you’ve checked the minimum requirements.
- The maintainers of this project keep the setup process relatively painless, which improves developer experience (DX).
Cons
- The Signoz backend needs to be installed on the host where your application is. This adds some overhead to your traditional development, which needs to be taken into account during the deployment process.
- The documentation can be confusing because it only describes how to configure storage and retention periods.
- The total cost of ownership correlates with APM deployment and maintenance, including but not limited to its required memory (at least 1.5 GB) and its upgrades.
Pinpoint
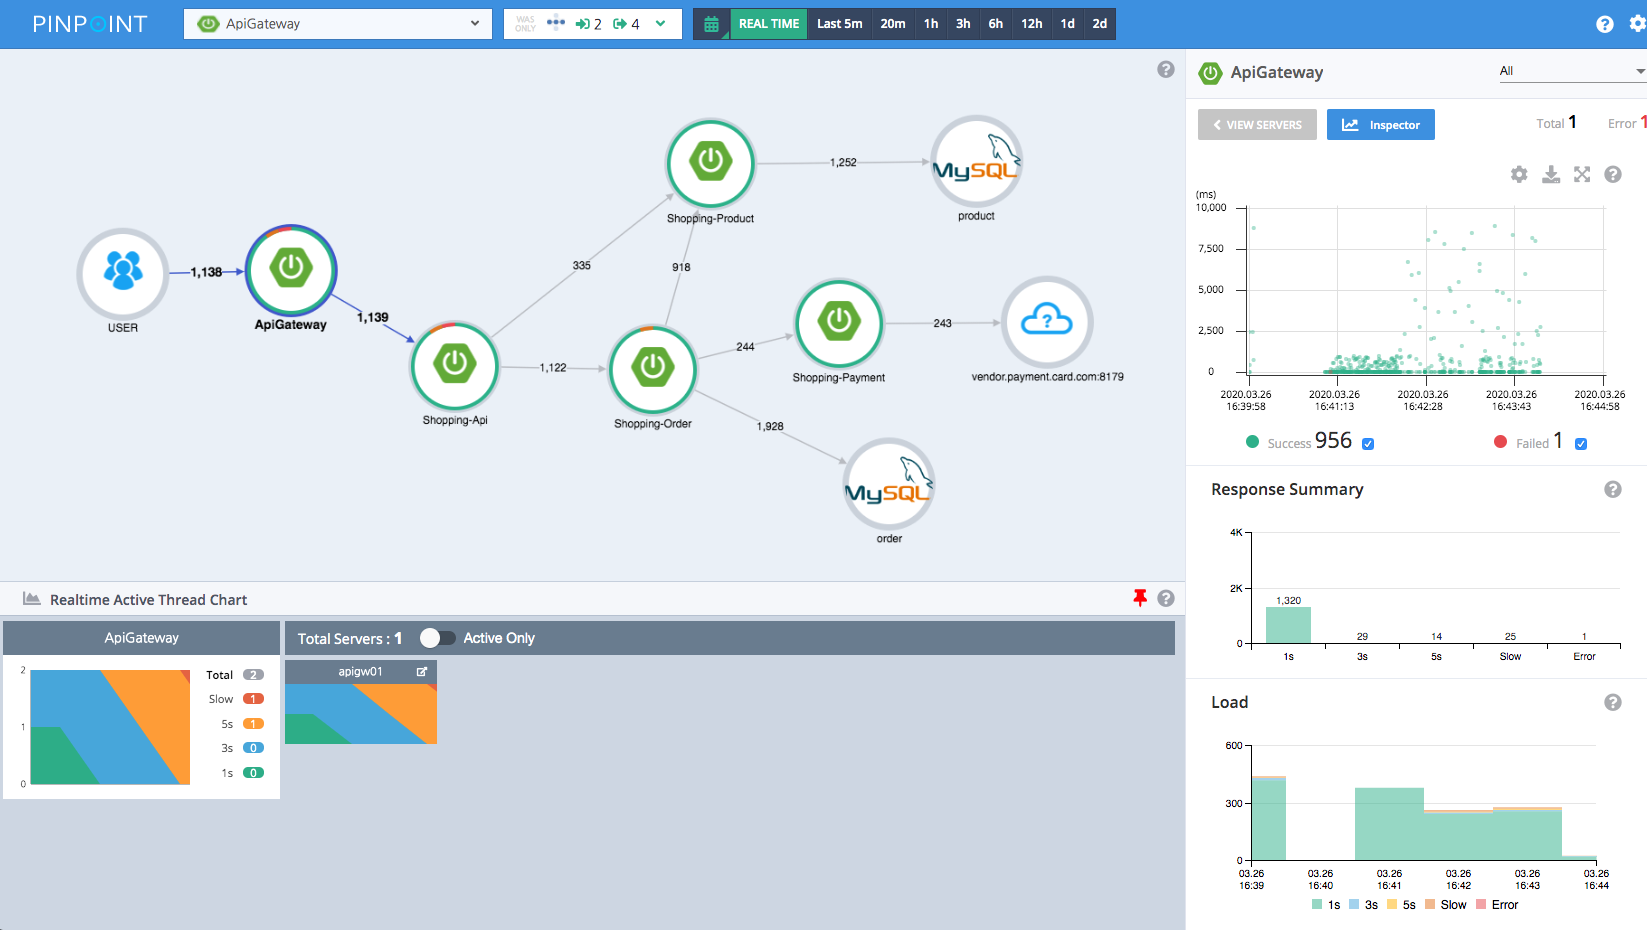
Pinpoint, which is written in Java and PHP, is made for large-scale systems. Inspired by Google’s Dapper, Pinpoint focuses on providing a general analysis of a system as a whole and how its components are connected.
Highlights
- Provides a general overview of your application topology
- Offers live, real-time monitoring of your applications
- Doesn’t require any change in your code to install and set up
Pros
- There are two methods to install Pinpoint. The first requires you to install and configure HBase as well as Pinpoint’s collector and web components, which makes it a job for a seasoned user. The second is a ten-minute installation process with Docker.
- Pinpoint dashboards are easy to use, clean, and intuitive. To see them in action, check the live demo.
Cons
- Pinpoint only targets three specific languages: Java, PHP, and Python.
- If you choose Pinpoint, make sure you consider the costs associated with maintenance and configuration.
Prometheus
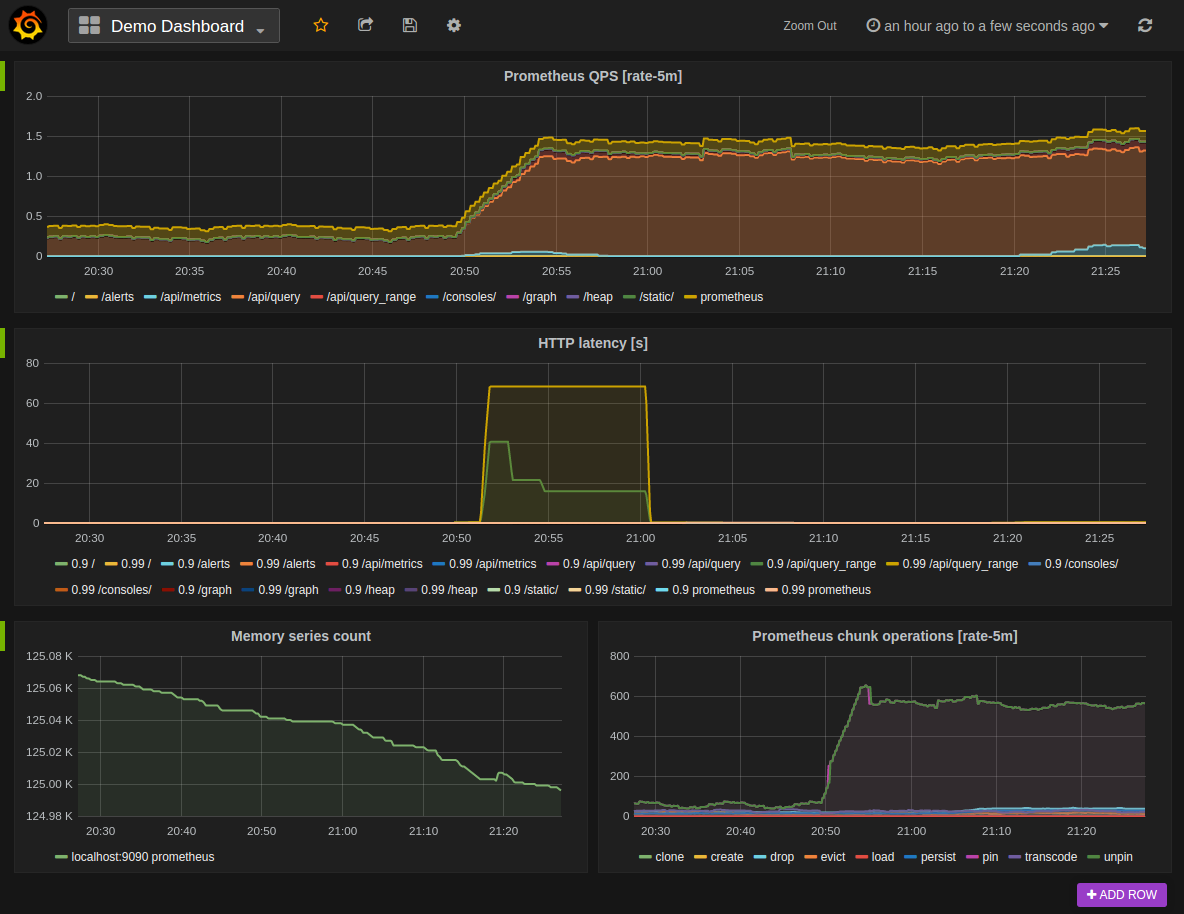
Prometheus was originally conceived in SoundCloud back in 2012. It was well received at the time and still enjoys an active community.
Highlights
- Offers multidimensional data model
- Offers custom query language PromQL
- Supports data aggregation; it can evaluate expressions and trigger alerts under specific situations
- Offers autonomous single server nodes
- Prometheus is commonly used for monitoring Kubernetes clusters
Pros
- Prometheus’ integrations make it an easy-to-use tool for data ingestion and alerting.
- Prometheus is configured through CLI and configuration files written in YAML format.
Cons
- Prometheus doesn’t provide visualization UI out of the box. Instead, the use of console templates is advised. Alternatively, if you want fancy dashboards you need to consider plugging in Prometheus with Grafana, as suggested in the documentation.
- You need to take costs associated with Prometheus hosting and maintenance into account. Custom dashboards might need development and/or Grafana setup, which also might be an additional cost.
Jaeger
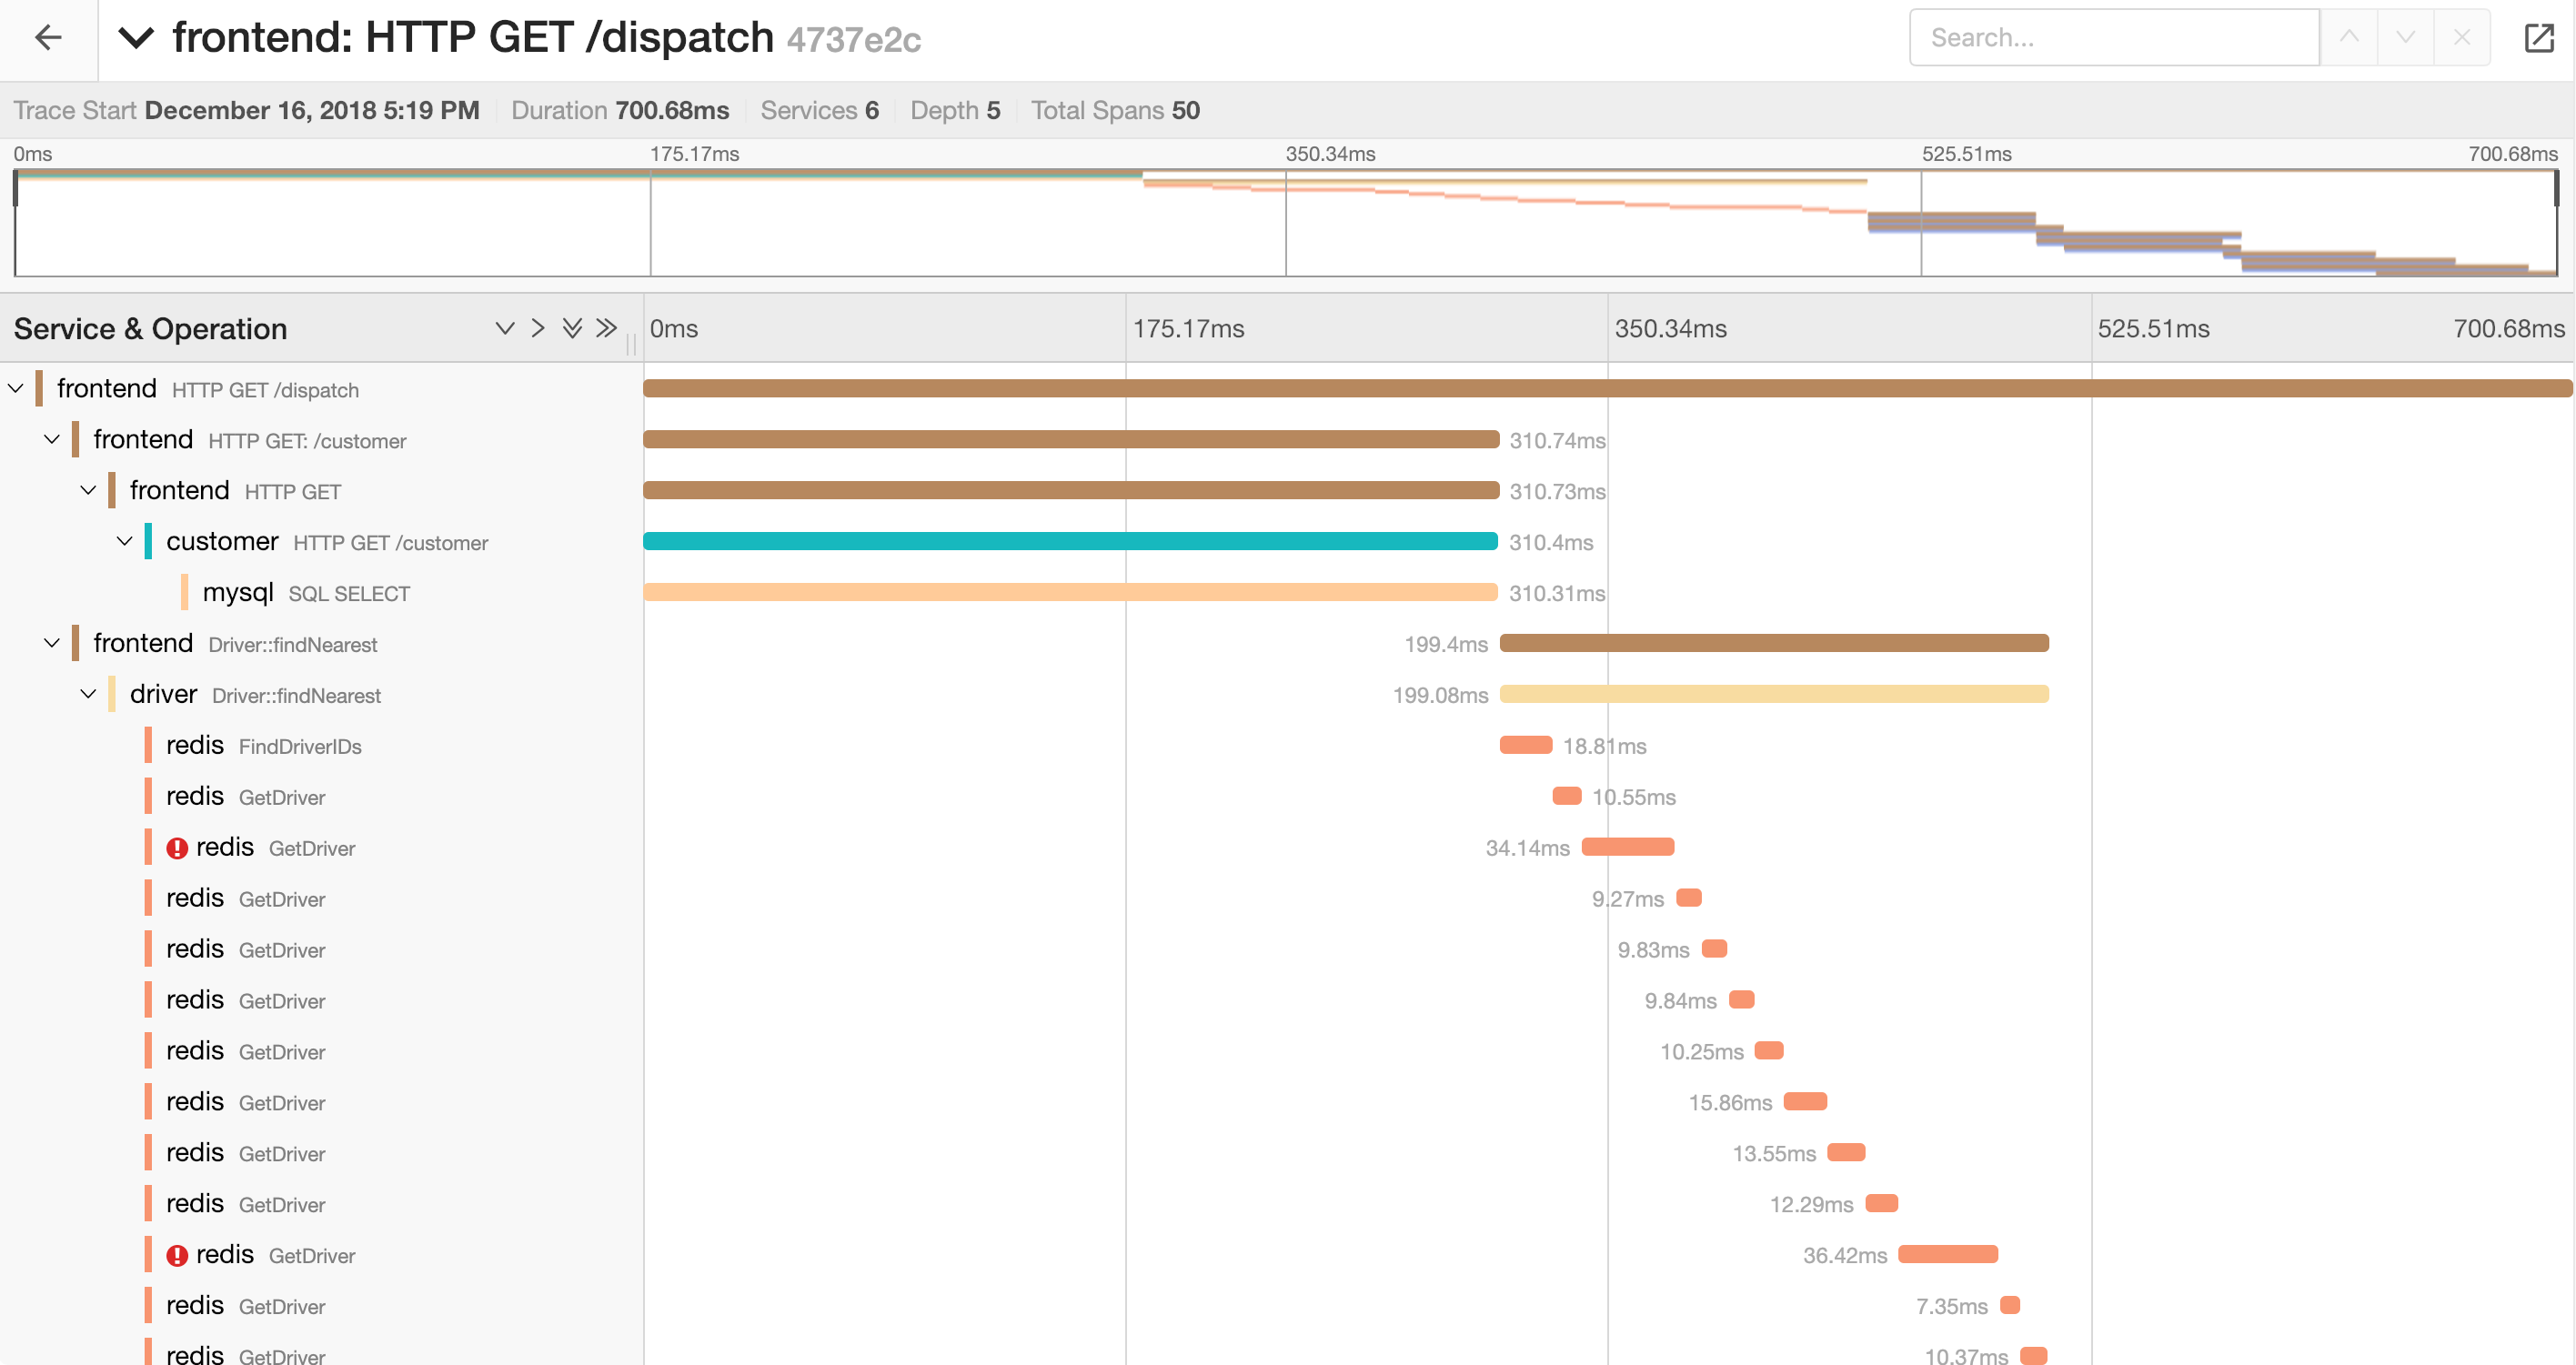
Jaeger is an open-source distributed tracing system created by Uber. It aims to solve problems related to performance, dependencies, and monitoring.
Highlights
- Offers native support for OpenTracing
- Offers several storage backends, especially Cassandra and Elasticsearch
- Offers web UI implemented with React
Pros
- Jaeger does one thing and it does that well: monitor and troubleshoot transactions in complex distributed systems.
- There are two ways in which Jaeger can be deployed:
- As a distributed environment, in which Kafka is used as an intermediate buffer. Typical installation places one Jaeger Operator per cluster. The Jaeger Operator is an implementation of a Kubernetes Operator.
- As a standalone all-in-one executable, in which Jaeger configuration is applied using the CLI, environment variables, or a configuration file. Jaeger has clean, well-organized documentation, which smooths the developer experience.
Cons
- As Jaeger is composed of different components working together, it’s possible that issues might occur among some of those components. Jaeger provides a list of helpful tips to troubleshoot potential problems.
- There might be costs associated with the maintenance of Jaeger and its components.
Glowroot
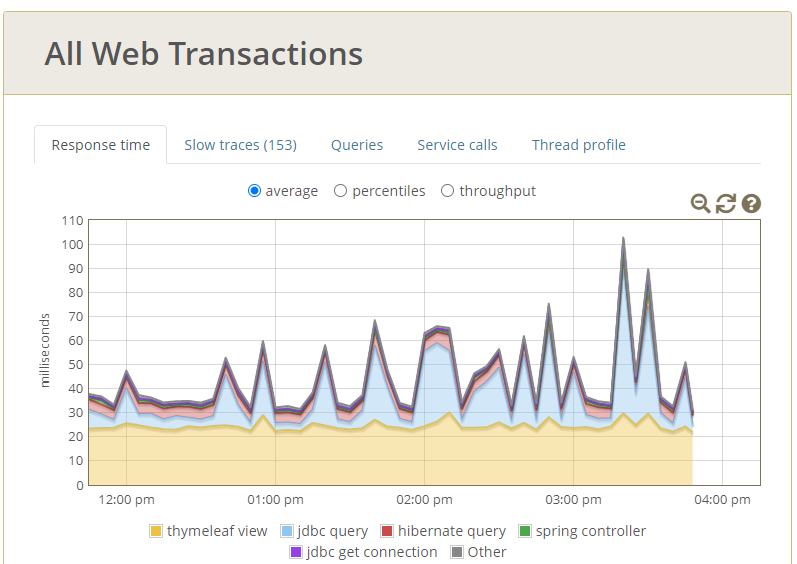
Glowroot is an easy-to-use Java APM that stands out for its simplicity.
Highlights
- Offers trace capture for slow requests and errors
- Offers response time breakdown charts
- Offers response time percentile charts
- Offers SQL capture and aggregation
- Offers service call capture and aggregation
- Offers configurable alerting
Pros
- Glowroot agents start collecting performance metrics the moment your application bootstraps.
- These metrics are available through another port in the same host that Glowroot is running.
- The UI is slick and intuitive, which makes it easy to find and graph all your metrics.
- Configuration is done through a JSON file.
- Glowroot DX is great if you are a Java developer.
Cons
- The total cost of ownership varies depending on the following factors:
- Number of clusters and nodes you want to monitor
- Maintenance, including regular upgrades
- It can only be used in Java projects.
Apache SkyWalking
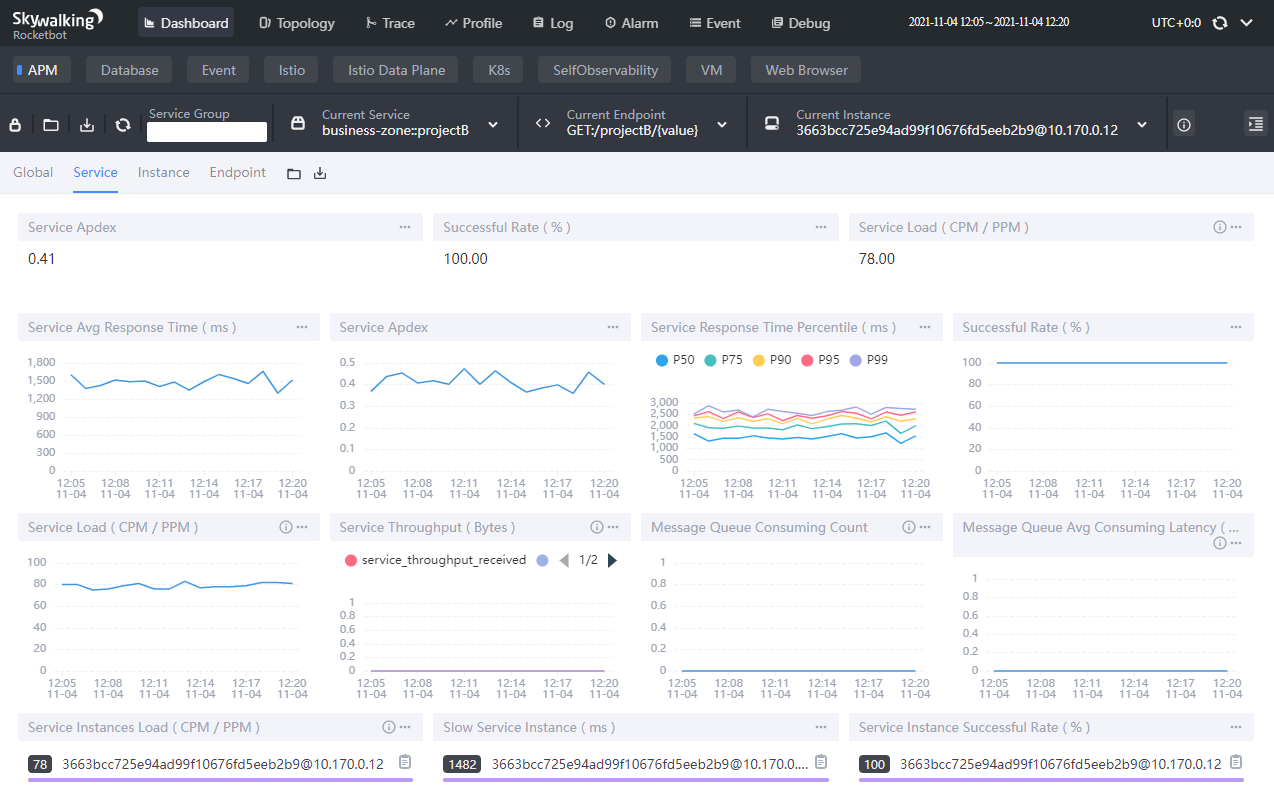
Apache SkyWalking is especially designed for microservices, cloud-native, and container-based (Docker, Kubernetes, Mesos) architectures. It bundles several APM capabilities, including monitoring, tracing, and diagnosis, and its active community has enabled support across multiple languages and platforms.
Highlights
- Cloud-native-architecture ready
- Collects telemetry (metrics, traces, and logs) data from multiple sources and multiple formats
Pros
- The SkyWalking dashboard concisely displays information, making it easy to use. It’s also highly customizable, allowing you to tailor your development experience to your needs. You can see all features in this demo.
- Installation varies depending on the application’s primary language. It has agents for Java, LUA, Kong, Python, and Node.js. It also has third-party agents for .NET, PHP, Go, and C++.
- SkyWalking is extremely configurable through YAML and XML files available for all modules.
- Primarily written in Java, SkyWalking also uses C for some native SDK integrations.
Cons
- The cost varies depending on the installation and maintenance of the APM. After setup, you need to set up cluster management to manage multiple backend instances.
Graphite
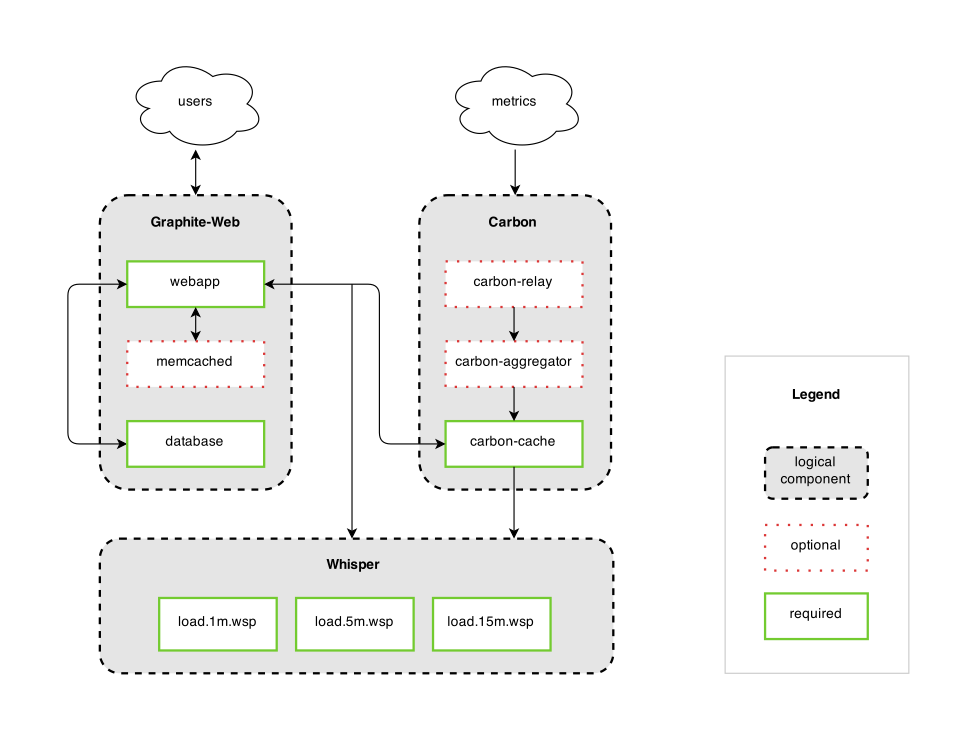
Graphite creates graph metrics that are easy to store and render. Numeric time series data, to be exact.
Graphite architecture consists of three components, which handle data ingestion, storage, and graphs.
Highlights
- Simple architecture
- Easy to use and install
- Language agnostic
Pros
- Once you complete the dependencies checklist, installation is straightforward. You can install it directly from the source using the GitHub repository, install it using pip, or install it in Virtualenv, among other options.
- Graphite is written primarily in Python and has an active community of contributors.
- Graphite can be installed and deployed with Apache or NGINX, and uses SQLite by default. This makes its deployment easy and lowers its cost of ownership, since maintenance and upgrades are easier than for other APMs.
Cons
- Graphite doesn’t collect data for you, although there are multiple ways to send data to it.
- Data ingestion needs to be considered.
- Typically, you’d need to plug Graphite into something else for more advanced monitoring or enhanced visualization.
Scouter
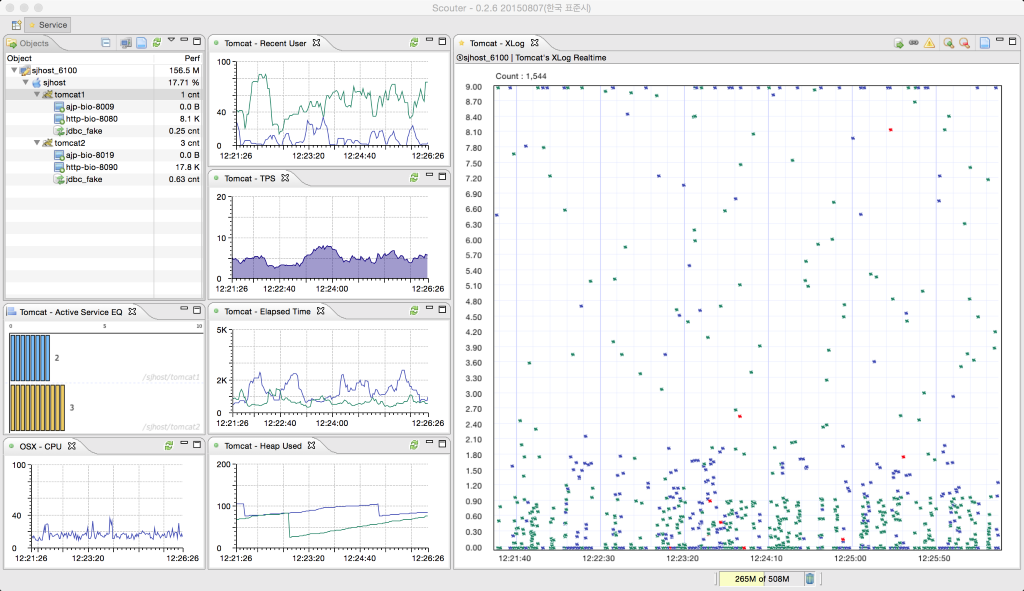
Taking inspiration from New Relic and AppDynamics, Scouter is a modular APM with four core modules:
- Agent gathers performance information and sends to the server
- Server (Collector) saves the performance metrics from Scouter agents or Telegraf
- Client (Viewer) is a program based on RCP (no support for OSX Big Sur)
- Web API (Since @1.8.0) gets counters, XLogs, profiles, and other performance metrics via HTTP protocol
Highlights
- Scouter is a standalone client, which enables it to collect a lot of data more efficiently
- Monitors each transaction and request individually
- Constantly analyzes thread-stacks for performance problems
Pros
- The installation is a straightforward process. All you need is to download and install Scouter, then run the client and host agent.
- Scouter is written primarily in Java.
- Scouter provides extensions to additional open-source projects, including Telegraf and Zipkin.
Cons
- Scouter collects data for you using the Collector Server, which needs to be installed and configured differently depending on the host.
- The cost of ownership relies on the different components you have to install, set up, maintain, and upgrade. These components include servers, agents, and a client.
Weave scope
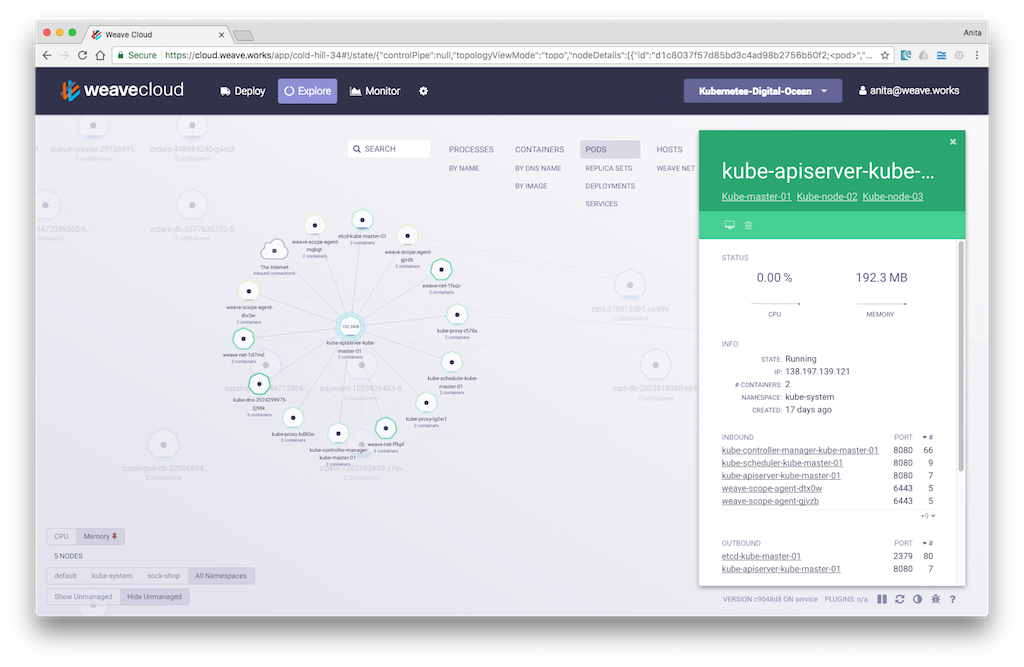
Weave scope is a monitoring tool developed by Weaveworks to work with Docker, Kubernetes, DC/OS, and AWS ECS.
Weave scope consists of two components—the scope app and the scope probe. The probe gathers data about the host on which it is running and then passes that data to the app. The app processes this information in a way that can be consumed by a UI.
Weave scope can be deployed in either a standalone or cloud version, but only the standalone version was evaluated for this article.
In standalone mode, each probe sends its data to a dedicated app. This means that both components need to be installed on each machine of the cluster.
Highlights
- Offers Docker Datacenter, Kubernetes, and Amazon ECS out-of-the-box support
- Offers topology mapping
- Offers views in scope
- Offers real-time app and container metrics
- Troubleshoots and manages containers
- Generates custom metrics using the plugin API
Pros
- The Weave scope dashboard is easy to use, with a visualization-first approach and a clean, intuitive UI.
- The open-source version can be installed on a single node or in a cluster.
- According to the documentation, once launched, Scope doesn’t usually require any other configuration.
- In case additional configuration is required, it can be done through YAML files.
Cons
- Scope must be installed onto every machine you want to monitor, and there are some Kubernetes-specific considerations that might add to your setup and maintenance costs.
- You have to add some integrations to ensure the security of scopes, as by default they don’t have any access or authentication management systems.
InspectIT Ocelot
Open-source Inspectit ocelot is an APM for monitoring and analyzing Java (EE) software applications.
Highlights
- Collects various types of metrics, visualized based on context
- Monitors connection between dependencies to discover which services interact
- Doesn’t require server restart for changes to the agent, including attaching or upgrading
Pros
- Inspectit ocelot requires no change in source code to install and monitor your application.
- It has a very well-organized and versioned documentation.
- It aims to provide a zero-configuration solution. However, you can configure it through Java Agent arguments, Java System Properties, environment variables, and file-based configuration that allows you to use YAML, JSON, or .properties files.
- A demo application is available, but no online version currently.
- inspectIT is written in Java.
Cons
- It only works for Java applications.
- You will likely need to integrate it with other APM tools like Prometheus or InfluxDB.
- Inspectit ocelot doesn’t provide a dashboard to visualize your data. You’ll need to integrate it with other tools like Grafana.
- As it typically needs to be coupled with other APM tools, its cost of ownership is likely higher than other solutions.
Final thoughts
Each of the open-source APMs presented here offers particular features and benefits, such as visualization, storage-only solutions, or hosted vs. cloud solutions. Which tool is best depends on your organization and the metrics you’re looking to monitor. However, you might prefer a fully managed, enterprise-ready APM solution to an open-source tool.
If you're looking for a maintenance-free, developer-first platform for monitoring your applications easily, then you should consider using Airplane. With Airplane, you build custom internal tools using Python scripts, SQL queries, REST or GraphQL API calls, and more. You can use Airplane Views to quickly build a React-based application monitoring dashboard. Airplane's out-of-the-box component library and template library make it simple to get started.
To build your first application monitoring dashboard quickly using Views, sign up for a free account or book a demo.


