


Poor system performance can affect the end-user experience, causing business disruption and loss of revenue. Monitoring tools help you proactively monitor your applications, databases, servers, and networks to ensure that they are always at peak performance.
Among the better-known tools is Datadog, which is used by IT and DevOps teams to view performance metrics. It provides a number of features for monitoring infrastructure and cloud services and can monitor services such as servers and databases too.
Datadog is one of the biggest players in the monitoring industry, but its pricing structure is more suitable for larger enterprises. This roundup will look at six Datadog alternatives based on cost, ease of use, developer experience, and features offered.
- New Relic one, a comprehensive alternative
- Splunk, a helpful tool for logs and more
- Prometheus, a popular open-source tool
- Dynatrace, an ai driven alternative
- Appdynamics, a well known cisco offering
New Relic One, a comprehensive alternative
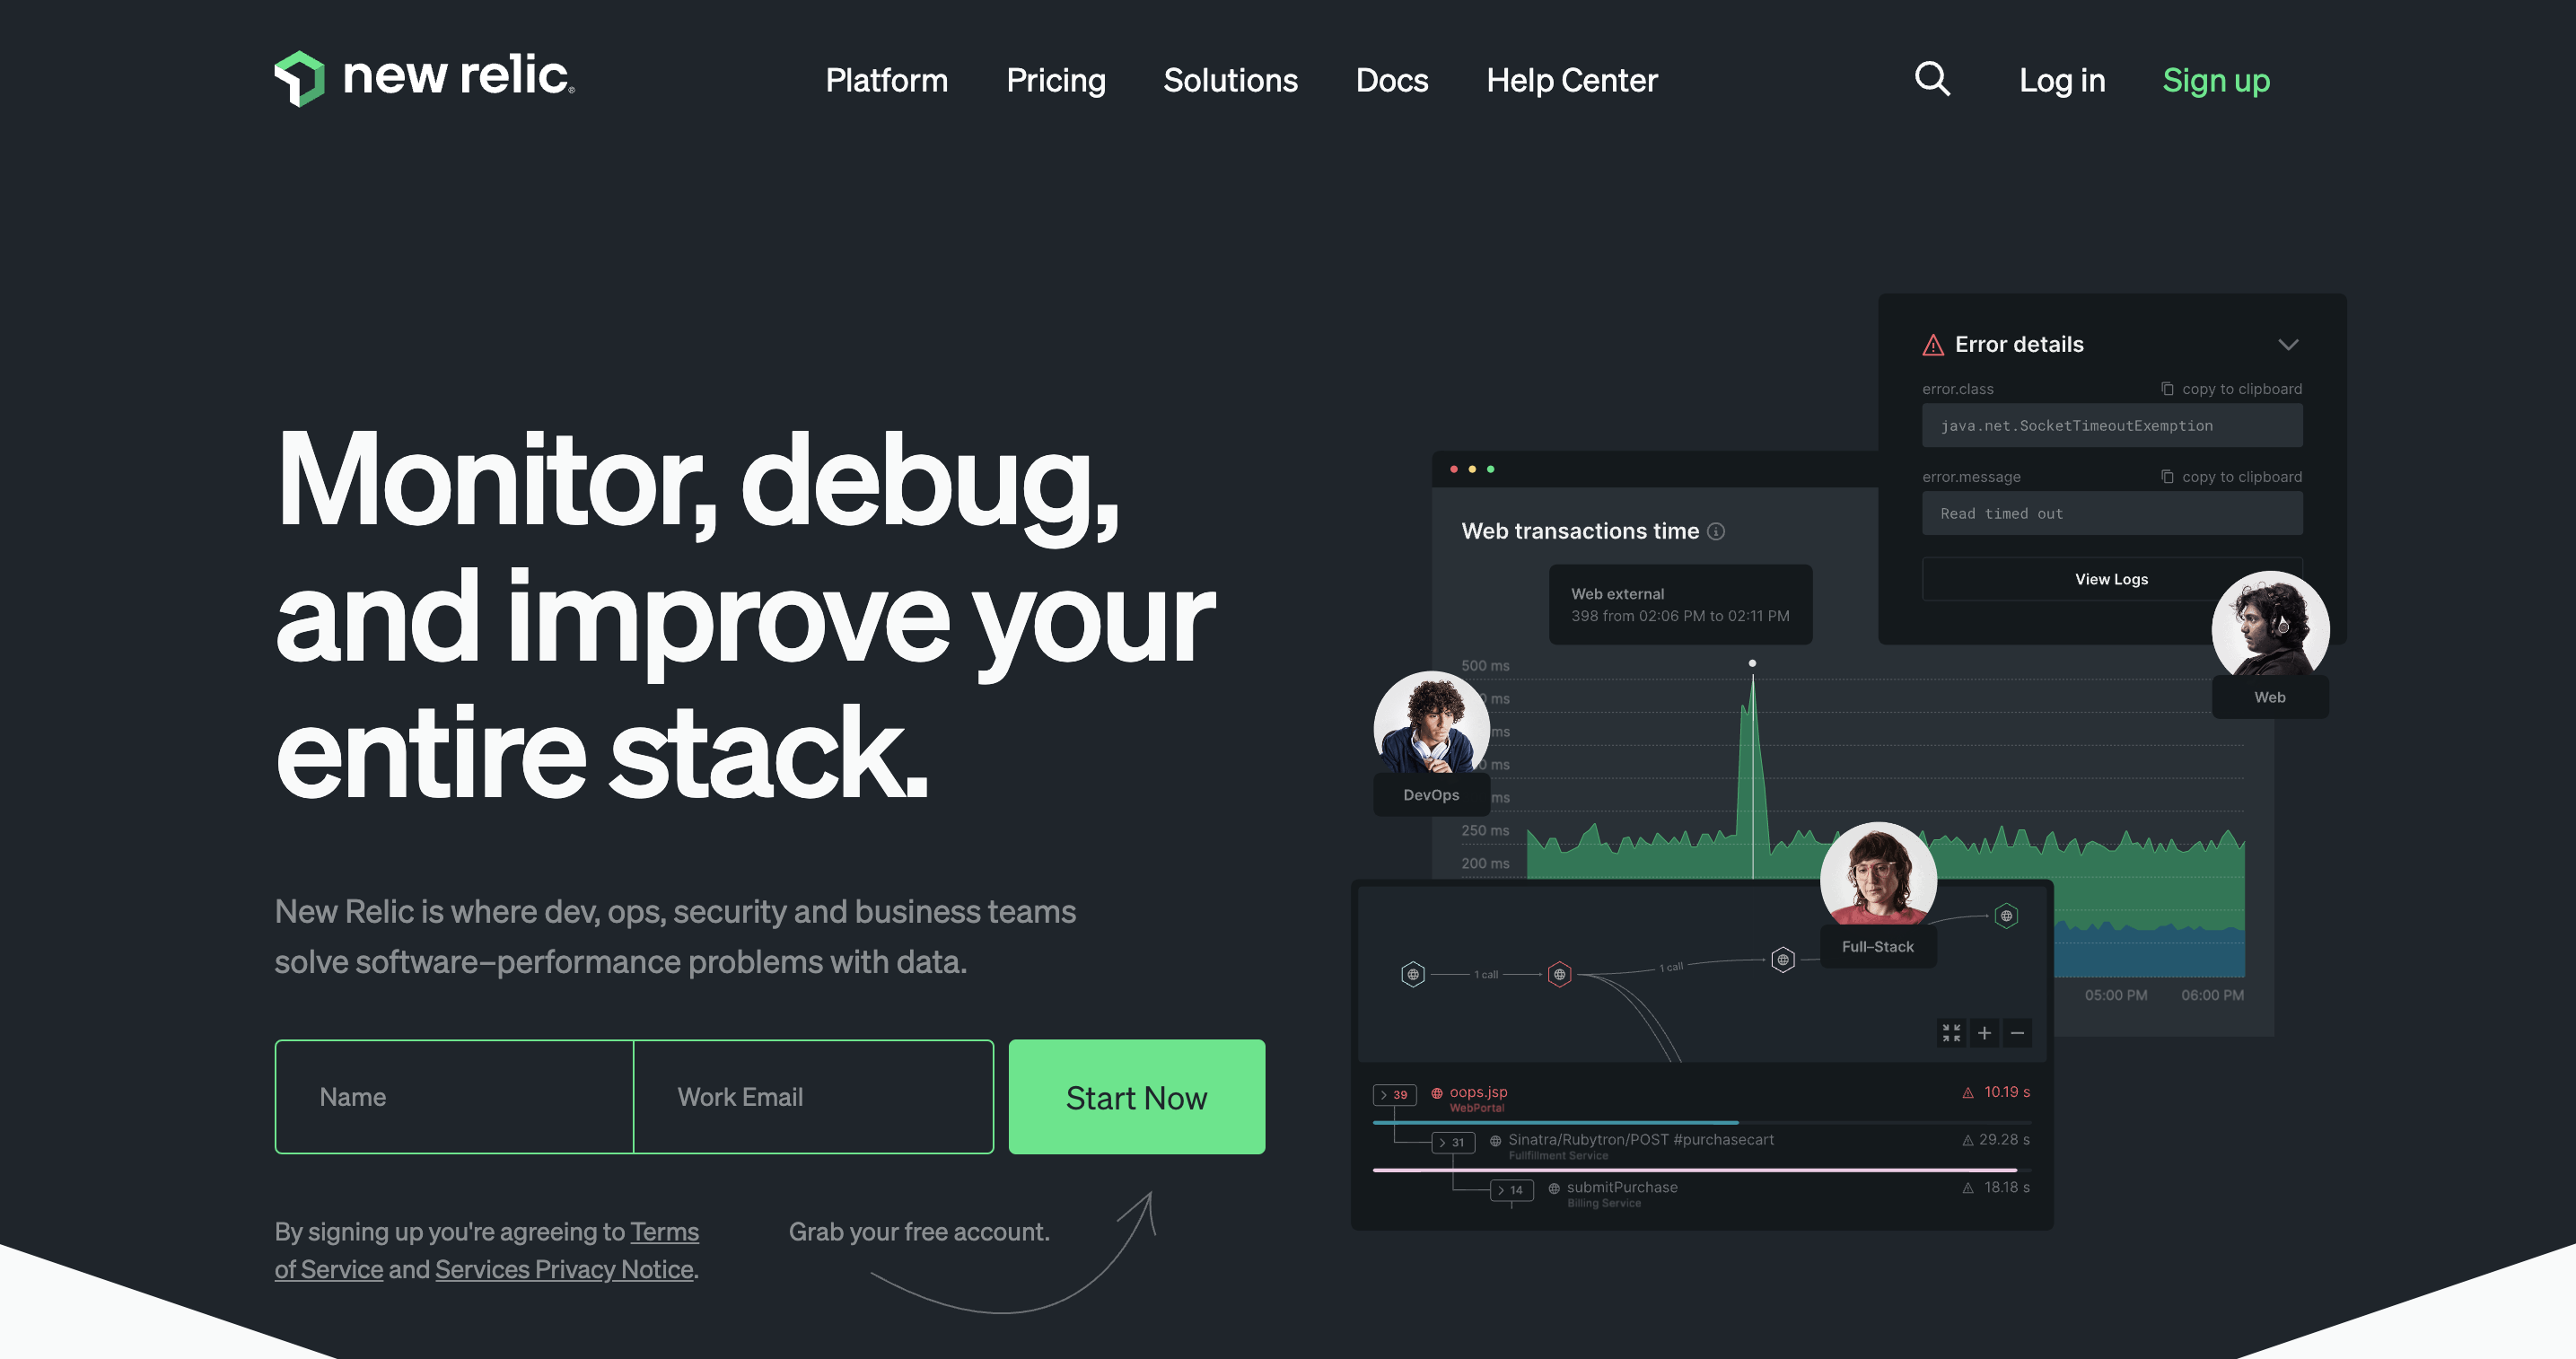
New Relic One is a Software-as-a-Service (SaaS)-based application performance monitoring (APM) platform for real-time monitoring of web and mobile applications. It can be deployed on-premises in a traditional data center or in a public or hybrid cloud environment, and it identifies issues and events for both frontend systems and backend infrastructure. New Relic provides a full range of observability tools for application, browser, mobile, synthetic, serverless, and infrastructure monitoring as well as log management. While Datadog is a strong infrastructure and log monitoring tool, New Relic focuses more on application monitoring and is a good choice if you need an all-purpose APM solution.
Cost
New Relic currently offers four consumption-based plans: free, standard, pro, and enterprise. You can add up to five full users to the standard plan for $99 per month each.
Ease of use
You don’t need to set up a lot of tools or configure servers to start monitoring and debugging your application environment with New Relic. Its SaaS platform is designed for fast and easy setup with auto-instrumentation and out-of-the-box views.
New Relic also recently introduced Instant Observability, an open-source catalog with over 400 quick starts for alert configurations, pre-built dashboards, and guides contributed by experts from around the world.
Developer experience
New Relic lets you combine information from your applications with data from services, data stores, and hosts for a comprehensive view of your entire IT environment. You can also observe the impact of code and configuration changes on application performance.
The platform includes monitoring capabilities for Kubernetes that allow you to troubleshoot, access, and analyze metrics across applications and infrastructure; create dynamic alerts; and build custom integrations using SDKs.
Available features
- Application performance monitoring
- Log management
- Error tracking
- Infrastructure monitoring
- Network performance monitoring
- Browser monitoring
- Mobile monitoring
- Synthetics monitoring
- AIOps: Alerts & AI
Here is a full comparison of New Relic to Datadog.
Splunk, a helpful tool for logs and more
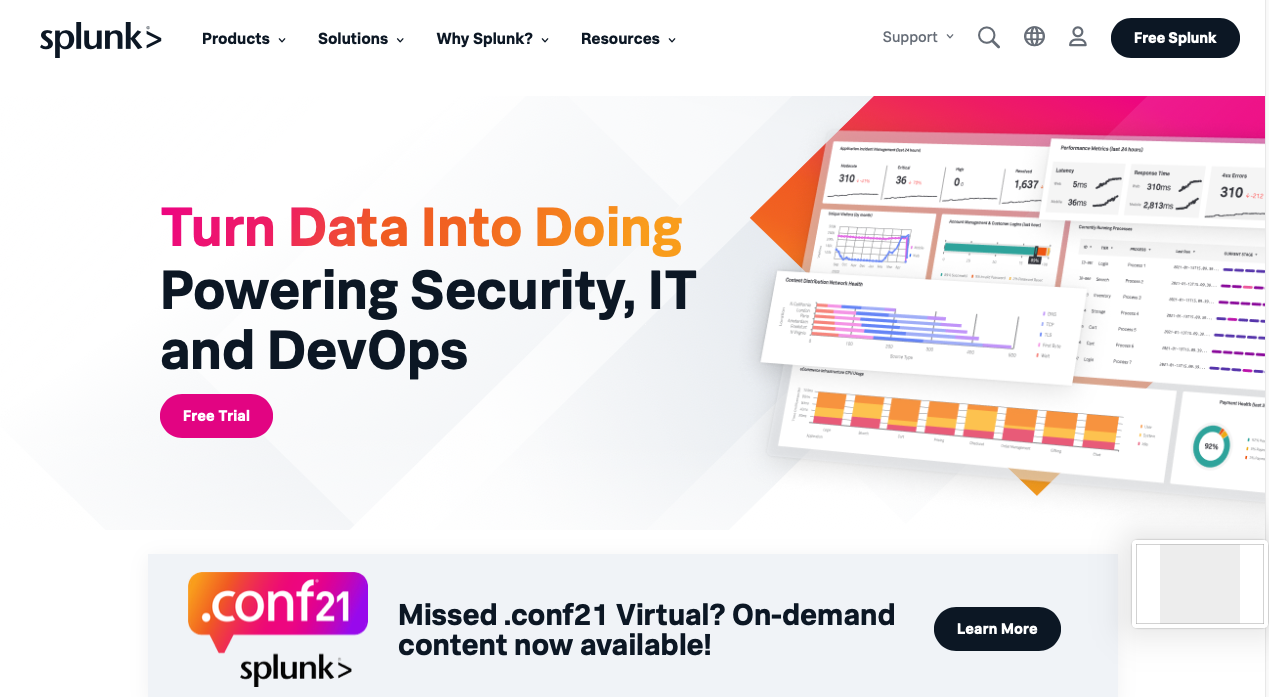
Splunk is a popular log management tool used to monitor, search, analyze, and visualize machine-generated data. It captures, indexes, and correlates raw unstructured data generated from devices in real time to convert it into more digestible formats such as dashboards, graphs, and visualizations.
It gives you access to all log data in one place for easy analysis, troubleshooting, and diagnostics, while retaining 100 percent of metrics, traces, logs, and streaming analytics for end-to-end insight across multiple environments.
Splunk is well suited for analyzing data generated from machines and devices and, unlike Datadog, supports multiple data formats including CSV, XML, and JSON files.
Cost
Costs start at $65 per host per month, billed annually.
Ease of use
Splunk provides an easy-to-use, centralized dashboard as well as visualizations to understand the generated reports. Its features allow you to query logs across various infrastructures and configure and schedule alerts based on log data.
You can create three types of dashboards for easier observability: scheduled dashboards, dynamic form-based dashboards using input values, and real-time dashboards that display real-time alerts and indicators for rapid issue identification, prioritization, and resolution.
Developer experience
Splunk supports DevOps with options for infrastructure monitoring, application modernization, and incident response. Real-time visibility gives developers insight into the impact that user experience and code changes have on site performance, while streaming analytics are useful for detecting potential issues and root-cause analysis. Splunk supports multiple types of data formats, including XML, CSV, and JSON files; provides AIOps (Artificial Intelligence for IT Operations); and integrates well with most security tech stacks.
Available features
- Infrastructure monitoring
- Application performance monitoring
- Log observer
- Real user monitoring
- Synthetic monitoring
- Automated incident response
Prometheus, a popular open-source tool

Prometheus is a monitoring and alerting system, released as an open-source project in 2012 by SoundCloud, that is especially useful for tracking application metrics in Kubernetes-native systems.
Designed to provide unified observability for cloud-native workloads, Prometheus captures and accumulates time series data, ie, metric data stored with a timestamp and optional key-value pairs called labels.
Prometheus comes with PromQL, a powerful query language for exploring metrics and drawing simple graphs. It is built both for system monitoring and dynamic service-oriented architectures and focuses on reliability, multidimensional data collection, and visualization.
While both Prometheus and Datadog can monitor Kubernetes clusters, if you only need time series for Kubernetes, Prometheus is your best choice. It’s also simpler to use than Datadog.
Cost
Prometheus is open source and free. Some SaaS vendors provide Prometheus as a service, which often includes hosted Prometheus, Graphite, and Grafana.
Ease of use
Actual installation is quick and easy, but Prometheus doesn’t provide any production-grade scalability out-of-the-box. This means that configuring and deploying it in an enterprise environment can be complicated. You’ll need to implement your own external storage solutions and add-ons. Since Prometheus is open source, you’ll also need to write code and create configuration files, which could be difficult for beginners.
Developer experience
There is no commercial support if you’re using Prometheus as a strictly open-source product. However, as a Cloud Native Computing Foundation project, Prometheus has an active developer and user community. Commercial support is available through platforms like Container Solutions, Grafana Labs, and PromLabs.
Prometheus integrates with over 150 add-ons, including Grafana, which adds functionality to Prometheus’ basic built-in visualization features to create dashboards with intuitive graphics and charts. Prometheus has no built-in authentication or authorization features and must be integrated with other tools to provide access security.
Available features
- A multi-dimensional data model with time series data identified by metric name and key/value pairs
- PromQL, Prometheus’ query language for querying collected time series data
- A built-in Alertmanager for managing notifications and silencing
- A basic virtualization layer with a built-in expression browser
- Multiple modes of graphing and dashboarding support
Here is a full comparison of Prometheus to Datadog.
Dynatrace, an ai driven alternative
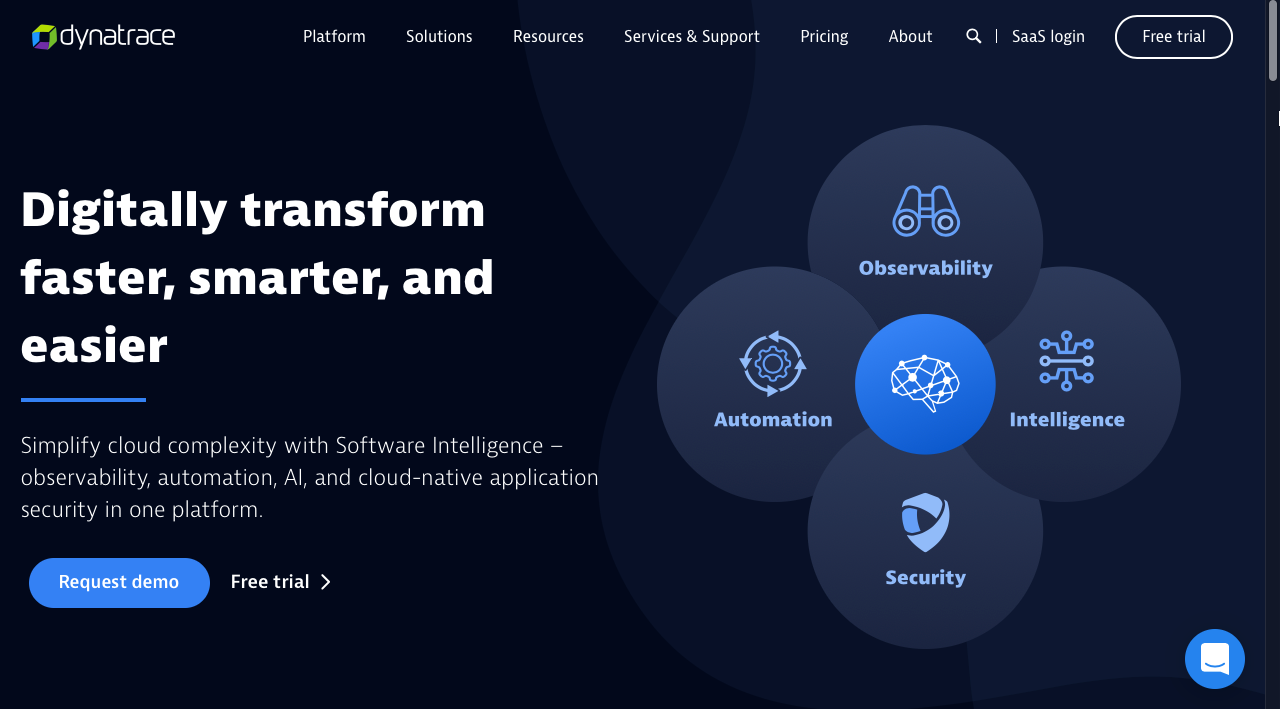
Dynatrace is an all-in-one monitoring solution that uses artificial intelligence to monitor and analyze application performance and provide useful insights. It provides complete application and database coverage and offers features for observability, intelligence, automation, and security in cloud-based environments.
Once installed on a host, Dynatrace OneAgent collects metrics for performance analysis of all application user requests as well as for root cause analysis; it also monitors all cloud, virtual machine, network, and server-side services plus any containerized environments.
Datadog generates lots of data but Dynatrace goes a step further, using AI to provide deeper insights for precise root cause analysis, anomaly detection, and decision making.
Cost
Full-stack monitoring for apps, microservices, and infrastructure with AIOps included is available at $69 per month per 8 GB per host billed annually.
Ease of use
Dynatrace displays all information on a centralized dashboard for easy management. The auto-discovery feature populates the topology map and detects your applications, containers, processes, and infrastructure as soon as you begin to use it. Automatic baselines detect and define normal performance and alert you to anomalies in your IT environment.
Developer experience
Useful features include a real-time topology map of your network, cloud applications, metrics, logs, and other data. Developers can map the causal relationships that allow you to see how one part of your system affects another. Dynatrace also provides machine learning features and links infrastructure-based metrics with customer experience and sales data to show conversions, orders, customer segments, release validation, and other useful information. You can use the data to evaluate application performance and digital experience, and determine if they’re in line with your business goals.
Available features
- End-user experience monitoring
- Component deep-dive monitoring
- Transaction profiling
- Synthetic monitoring
- Real-time user monitoring
- Network monitoring
- Application performance monitoring
- Analytics and logging
Appdynamics, a well known Cisco offering
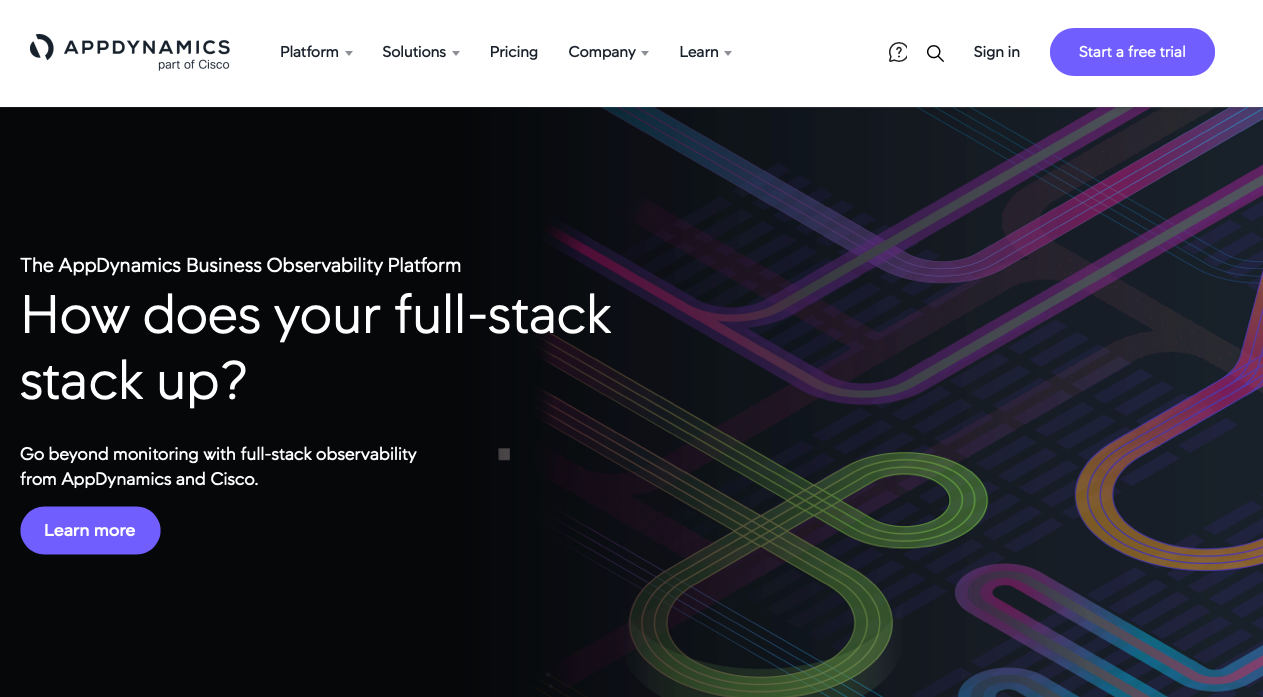
AppDynamics is an application performance management system that helps you monitor the health and performance of your business applications in real time. It provides full infrastructure visibility for troubleshooting servers, networks, and databases and managing complex distributed applications.
AppDynamics’ popular end-user monitoring (EUM) feature studies end-user interactions for errors, crashes, page-load details, and other useful metrics to help you provide a better customer experience. It also supports AIOps with its Cognition Engine, which identifies unusual performance behaviors and automates analysis.
AppDynamics combines several monitoring applications with Unified Monitoring to provide complete visibility, including end-user monitoring to help you quickly identify and resolve customer issues.
Cost
Pricing ranges from $6/month per CPU core for the infrastructure monitoring edition to $90 per month per CPU core for the enterprise edition.
Ease of use
AppDynamics has an easy-to-use interface where users can view errors and set automatic alerts. Machine-learning capabilities include regression and anomaly detection that helps users to monitor for vulnerabilities and identify potential security breaches.
Developer experience
AppDynamics provides several features to help developers monitor and troubleshoot application performance, including component deep-dive monitoring and end-user monitoring. Component deep-dive monitoring captures stack traces to collect data from iOS, Android, C/C++, Node.js, Java, .Net, PHP, and Scala performance metrics.
End-user monitoring features such as real-user monitoring allows developers to capture end-user browser experiences to observe user transactions and find performance problems. With synthetic monitoring, you can fake browser traffic to troubleshoot application crashes or perform stress testing.
Available features
- Runtime architectural discovery
- User-defined transaction profiling
- Application performance management
- Infrastructure visibility
- Business performance monitoring
- Code-level visibility
- Synthetic monitoring
- Mobile real-user monitoring
Final thoughts
As you’ve seen, these alternatives to Datadog can help you proactively track errors and issues in order to build better applications. In this article, we compared each alternative based on cost, ease of use, developer experience, and available options, but the right tool will be the one that best suits your business needs.
If you are looking for additional information about tooling, these guides are helpful for continued reading:
If you're looking for a code-first, maintenance-free platform that makes it even easier to track errors and issues in real-time, then Airplane is a good fit for you. With Airplane, you can build custom internal workflows and UIs within minutes. Airplane Tasks are functions that anyone on your team can use. Airplane Views is a React-based platform for building UIs quickly. Use Views to build a tracking dashboard to track and manage the health of your applications easily. Airplane also offers strong audit log capabilities, making it easy to track errors that may arise.
To build a monitoring dashboard using Views and track job executions with audit logs, sign up for a free account or book a demo.


