Resource allocation is an essential consideration when you’re running Kubernetes. When a pod is created on Kubernetes, you need to ensure the containers have sufficient resources to run. The CPU and RAM are two of the most critical cluster resources, and they need to be specified and allocated correctly.
Kubernetes provides a number of ways to configure CPU and RAM resource usage parameters. Setting up these usage parameters and limits ensures you don’t exhaust resources, starve out your apps, or incur high operational costs. It also helps to prevent resource-hogging and out-of-memory (OOM) errors that may affect cluster health.
Additionally, if an application exceeds its CPU limit, it’s throttled, which affects the response rate and can cause problems.
In this article, you’ll learn more about Kubernetes CPU limits and throttling, why they are relevant, and how you can implement them.
What are CPU limits and requests?
There are several ways to manage resource consumption in Kubernetes, which include assigning priority to pods to avoid kernel termination when resource limits are reached, using namespaces and resource quotas, setting network policies, and configuring storage.
To define how many resources will be allocated to a container, Kubernetes uses the concept of requests and limits.
Requests determine how many resources a container will receive during deployment. When the usage request is defined, Kubernetes only schedules the container on a compute node that can provide the resource it needs.
Meanwhile, limits represents the highest possible value a container is permitted to receive before it’s restricted, which ensures that the container never goes above that value. This is illustrated in the diagram below.
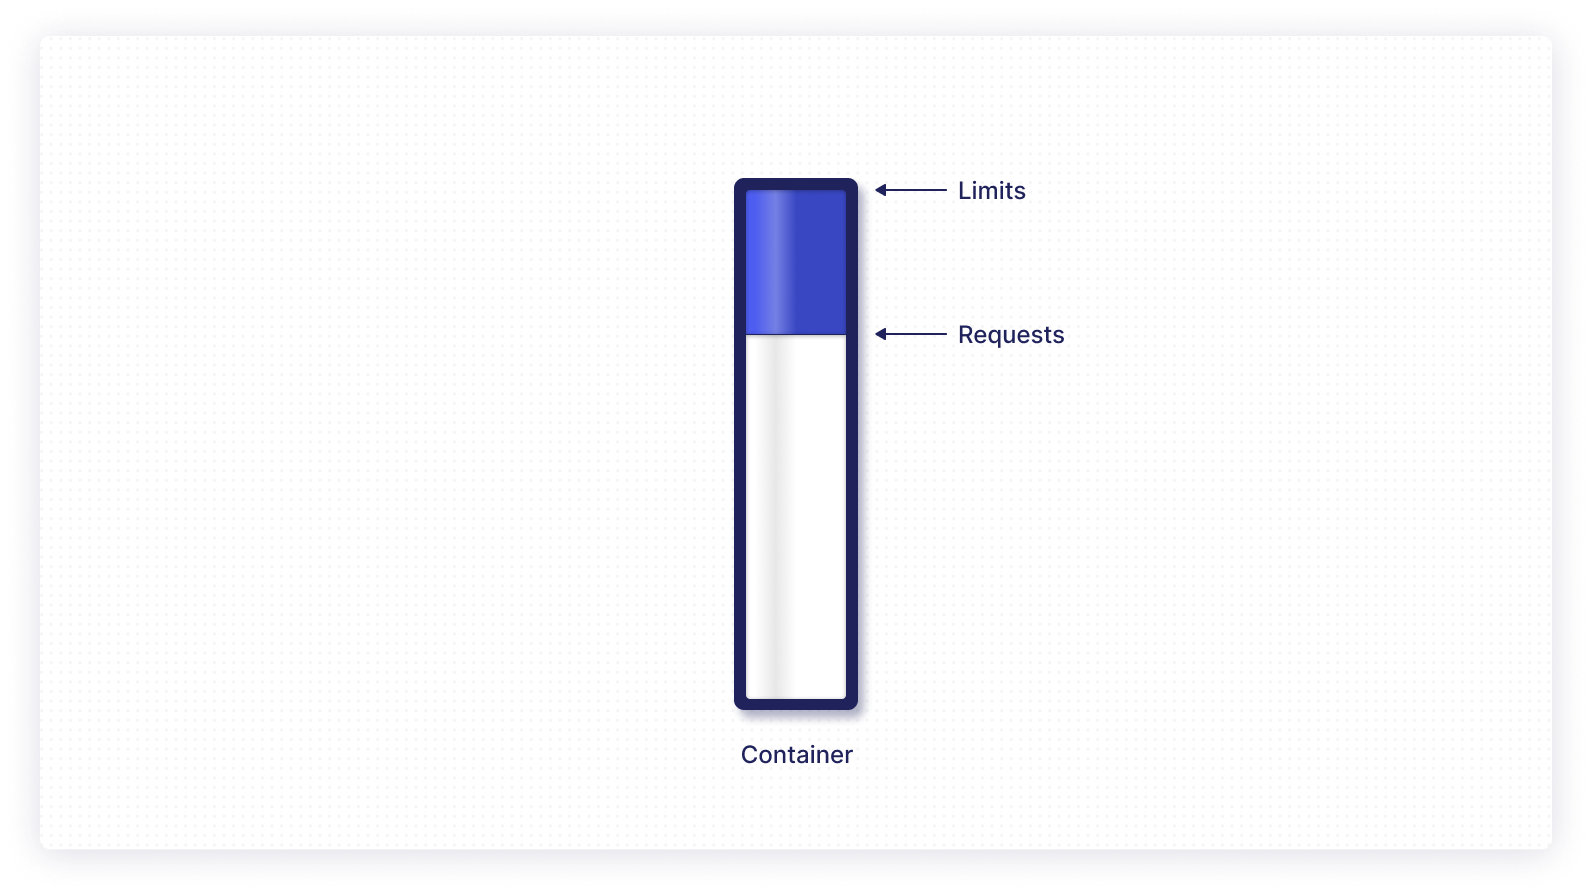
Take note, however, that the value for a container request should always be less than that of the limit. Otherwise, you’ll get an error that prevents you from running the container.
CPU throttling and OOM Killed
Many enterprises today run their business-critical workloads on a Kubernetes multi-tenant environment. These multi-tenant environments use limits to regulate tenant workloads or chargebacks.
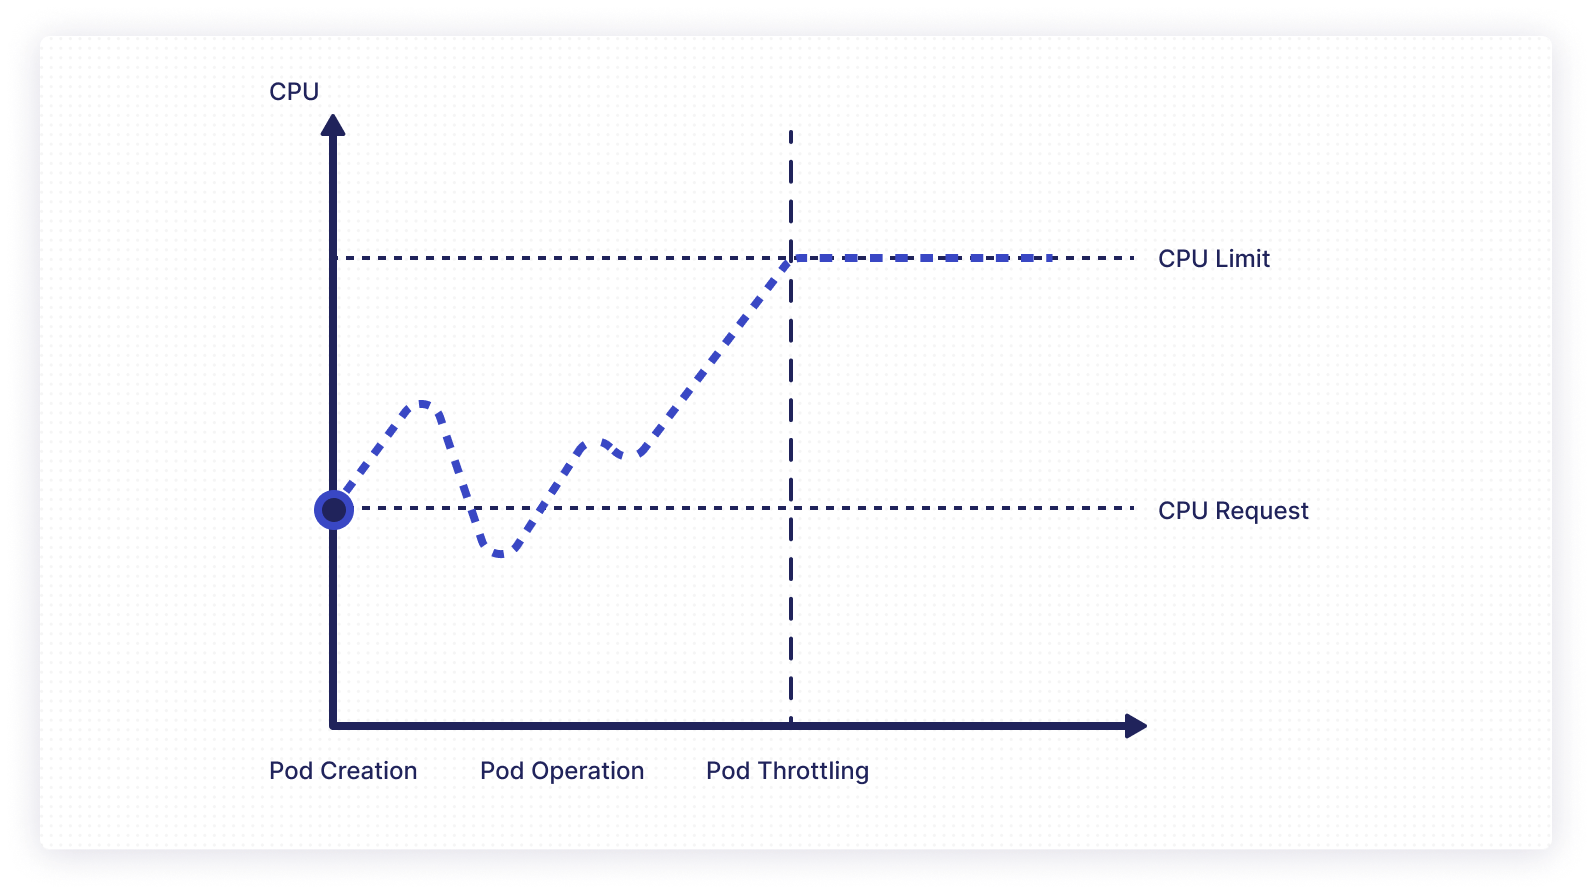
CPU throttling is an approach to automatically slow down the CPU so as to consume fewer resources, and is a side effect of setting resource usage limits. Whenever an application is running close to the maximum CPU utilization that it’s permitted, it is throttled. This cuts down the CPU cycles and slows down the response rate.
Additionally, if you’re running a resource-intensive application on a node with low resources, there’s a chance the node will exhaust its CPU or memory resources and shut down. The process in which pods are terminated when they use more than the allocated memory resources is known as out-of-memory termination, or OOM Killed.
In essence, the OOM Killer monitors memory usage, identifies processes that use up too much memory, and terminates them. Note, however, that the OOM Killer can terminate a process even when there is memory available.
An application failure resulting from an OOM error can trigger a snowball effect that affects the entire cluster, making resource management a critical aspect of Kubernetes.
The risks of operating Kubernetes without limits
The following are the typical errors that happen during limitless execution without any limits:
- OOM errors: As explained earlier, out of memory errors can occur when you don’t set a specified limit, and the node ends up exhausting all the resources available. This causes the node to be shut down, and negatively impacts the cluster stability and health.
- Excessive resource use: If a maximum CPU limit is not specified, a container can use the full CPU capacity of the node. Excess resource usage will slow down other containers on the same node, and can even cause Kubernetes core components like kubectl, the control panel, and kube-proxy to become unresponsive.
- Increased expenses: This is mostly due to overutilization or underutilization of computing resources. For example, when you operate without any resource requests or limits, even if you’re running out of resources, you won’t get any errors or stopgaps. This can quickly lead to a costly, overprovisioned cluster.
- Resource hogging: Without any limits set, you may end up with a resource-intensive application that consumes too many resources. This resource-hogging affects other applications, starving them of resources, making them slow and sometimes unresponsive.
Side effects of setting wrong resource limits
Using resource limits doesn’t come without potential complications. If you provide insufficient CPU resources, then the application service may have high latency, because the kernel will spend most of its time switching contexts at the CPU core.
If the requested CPU resource limit is too high, it may lead to underutilization of resources, artificially inflating the cost of running the cluster. Because of this, it’s strongly advised not to use configuration values that are too high, affecting stability, or too low, wasting resources.
How resource requests and limits work
Each pod or container can select one or more of the configurations in their deployment YAML files to achieve resource limits, such as CPU limits, CPU requests, memory limits, and memory requests. A typical sample YAML file is shown below, where pod resource limits and requests are specified:
The pod reserves 64 Mi of RAM and 0.25 CPU units, but can use up to twice the RAM and an entire CPU.
How to set resource limits in Kubernetes
Kubernetes provides an excellent way to limit resources in nodes, pods, or containers. It is called LimitRange.
With LimitRange, you can specify the upper and lower threshold limits of resource consumption. The default in Kubernetes is to allow containers to run with unlimited computing resources. LimitRanges allow you to restrict how much CPU and memory a pod can consume.
A Limit Range provides constraints in the following ways:
- Minimum and maximum resources
- A ratio of demand to limit for a resource in a namespace.
- Enforcing a default demand and limit for computing resources
In the following sections, you will create a limit range in the local Kubernetes cluster and set CPU limits (minimum and maximum), which the containers and pods will use.
Prerequisites
To follow along with this tutorial, you’ll need the following:
- Kubernetes cluster with at least one worker node; eg something like MiniKube
- kubectl command-line tool
The following steps will be performed in the cluster:
- Set up a LimitRange in the default namespace
- Deploy pods with assigned CPU Limit Range
Set up a LimitRange in the default namespace.
Create a YAML file to define a limit range in the default namespace with the following name and content:
Name: set-limit-range.yaml
Content:
Run the following command to create a LimitRange in the cluster:
To confirm that the LimitRange was successfully created, enter the following command:
On successful execution, it will display a limit range that defines the CPU as “Min=50m” and “Max=100m” in the terminal.
Deploy pods with LimitRange in the default namespace
In this section, you’ll create a pod definition that consumes a CPU greater than 50m and less than 100m within our defined namespace.
Create a file called pod-with-cpu-within-range.yaml, and paste in the following contents:
Now apply the YAML file you created above to create a pod in the cluster, and subsequently view the pod details using these commands:
Once executed, you’ll see that the pod was created with a CPU resource request and limit. However, Kubernetes will never allow this pod to request resources more than its defined limit at any time.
You can also check the CPU usage using the inbuilt Kubernetes dashboard. Enter the following command to use the dashboard.
If you navigate to Workloads > Pods, you can see the complete CPU and memory usage.
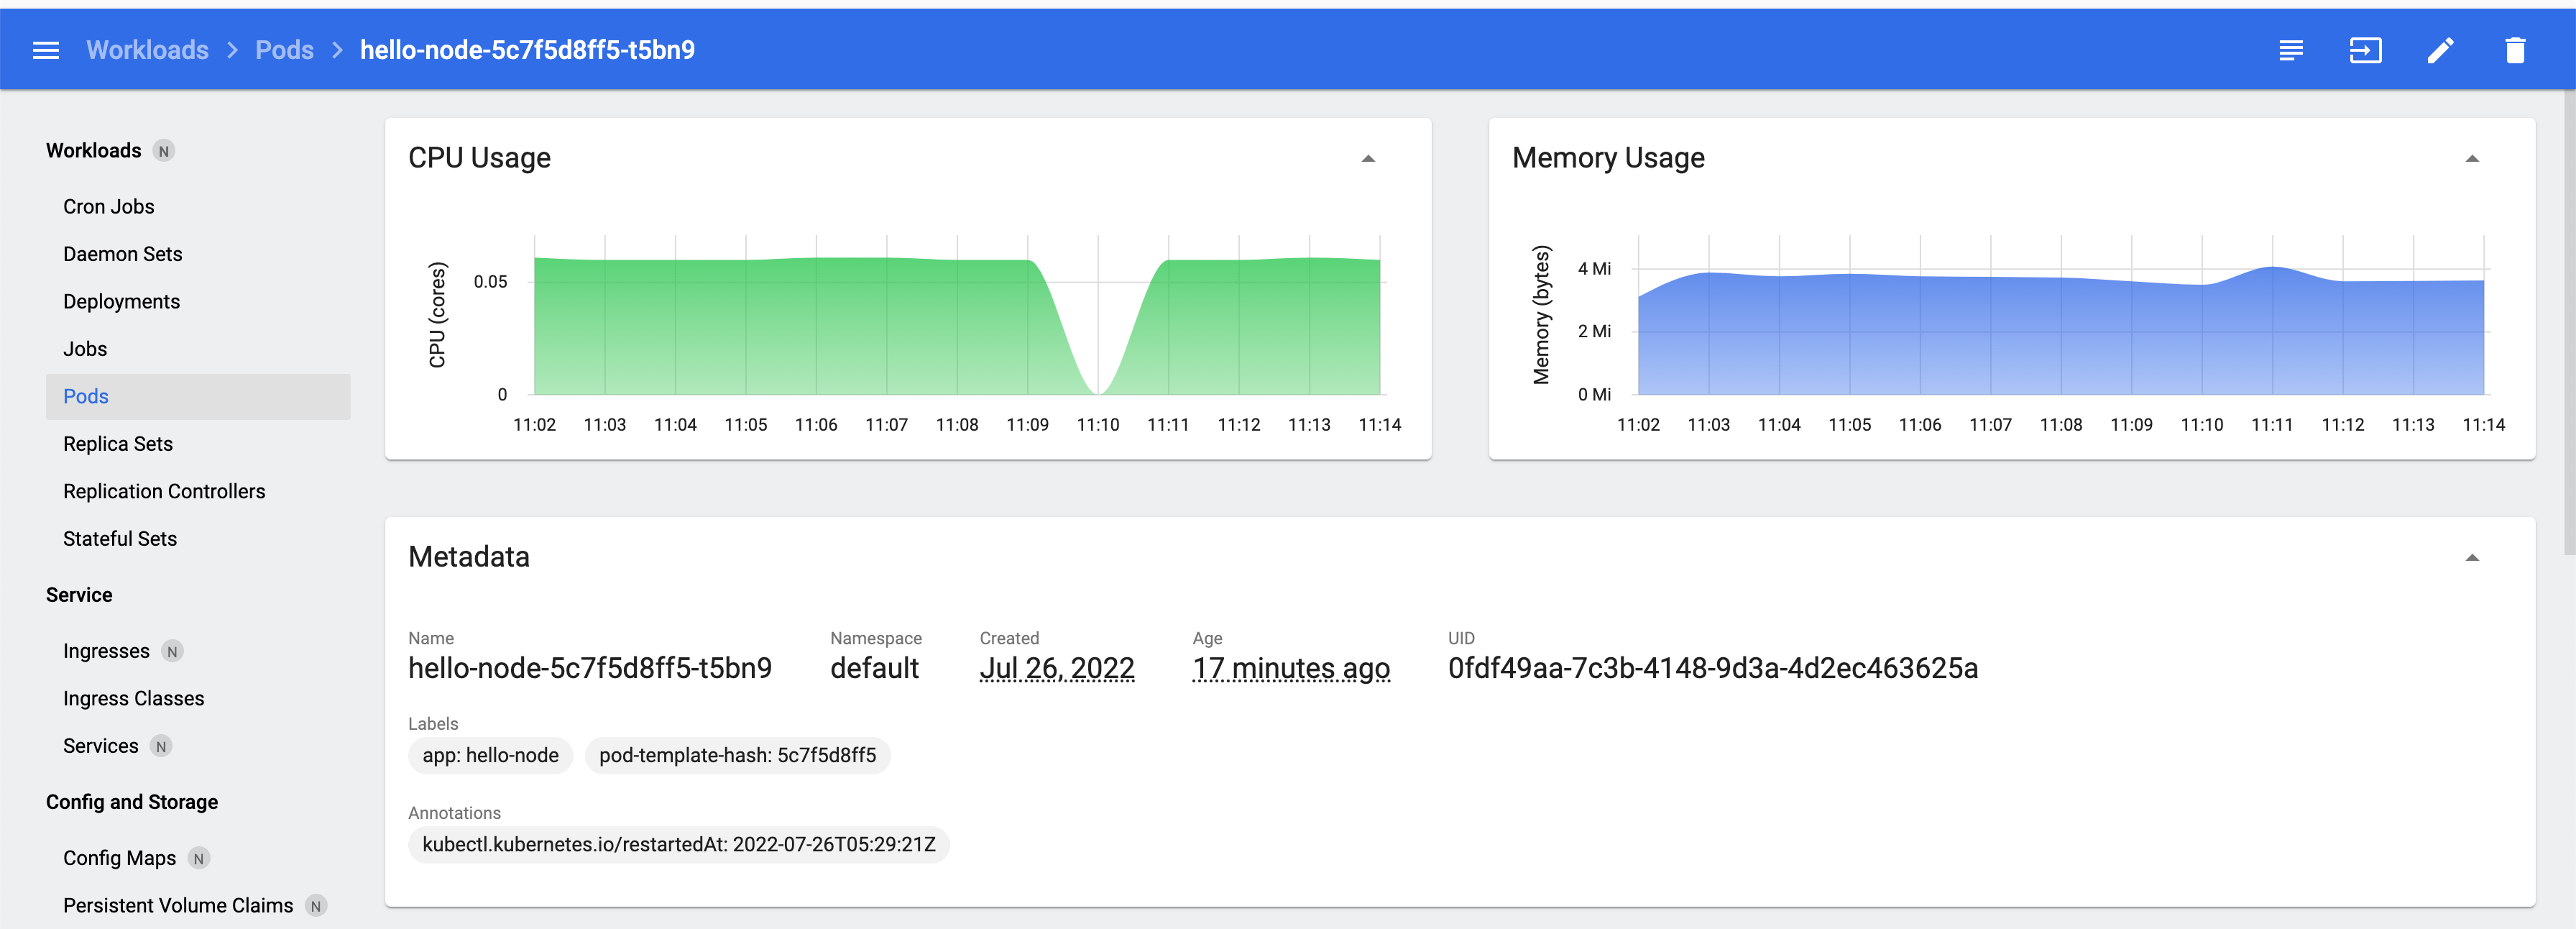
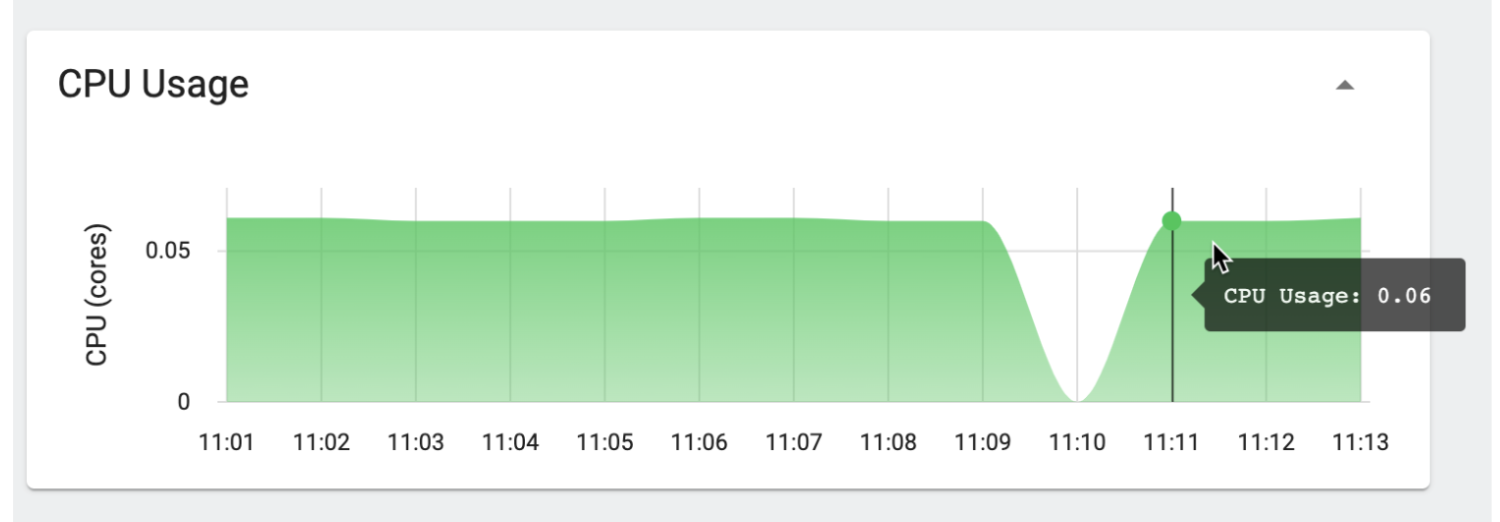
As shown in the CPU usage dashboard below, Kubernetes was throttling it to 60m, or .6 CPU, every time consumption load increased.
The image below depicts the HTTP response time after CPU throttling. The first section of the graph represents how API response times exponentially increase when the CPU is throttled. For API consumers, this will lead to service degradation.
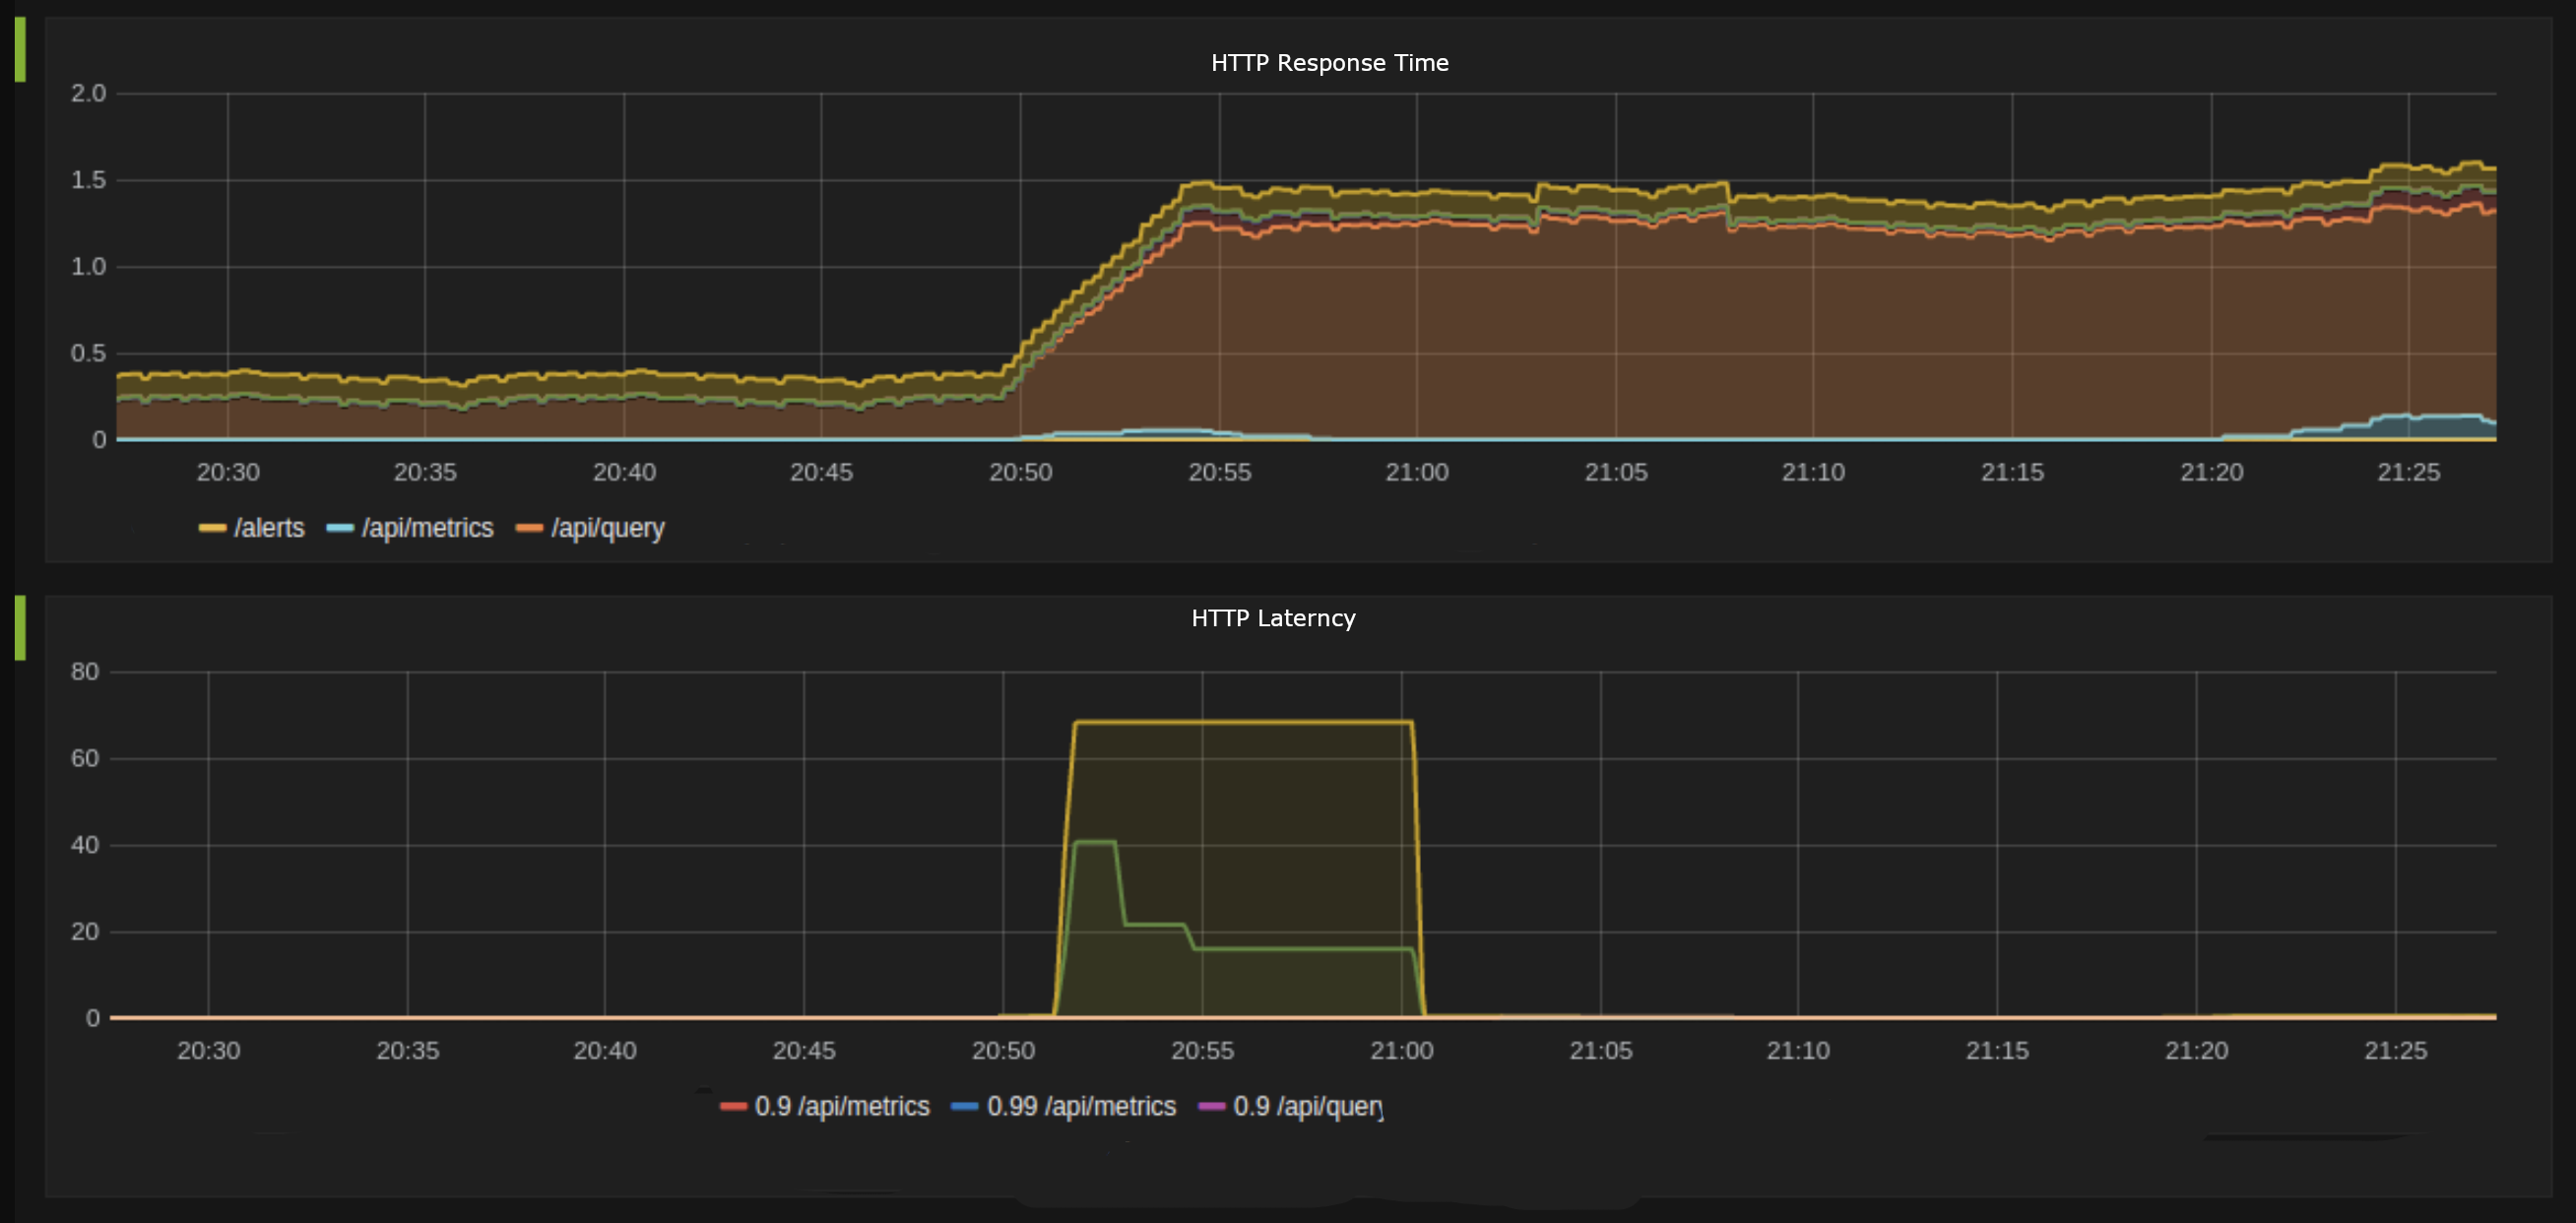
In the second section, API latency becomes zero as soon as it exceeds a certain threshold. In other words, CPU throttling causes some API requests to get timed out right away.
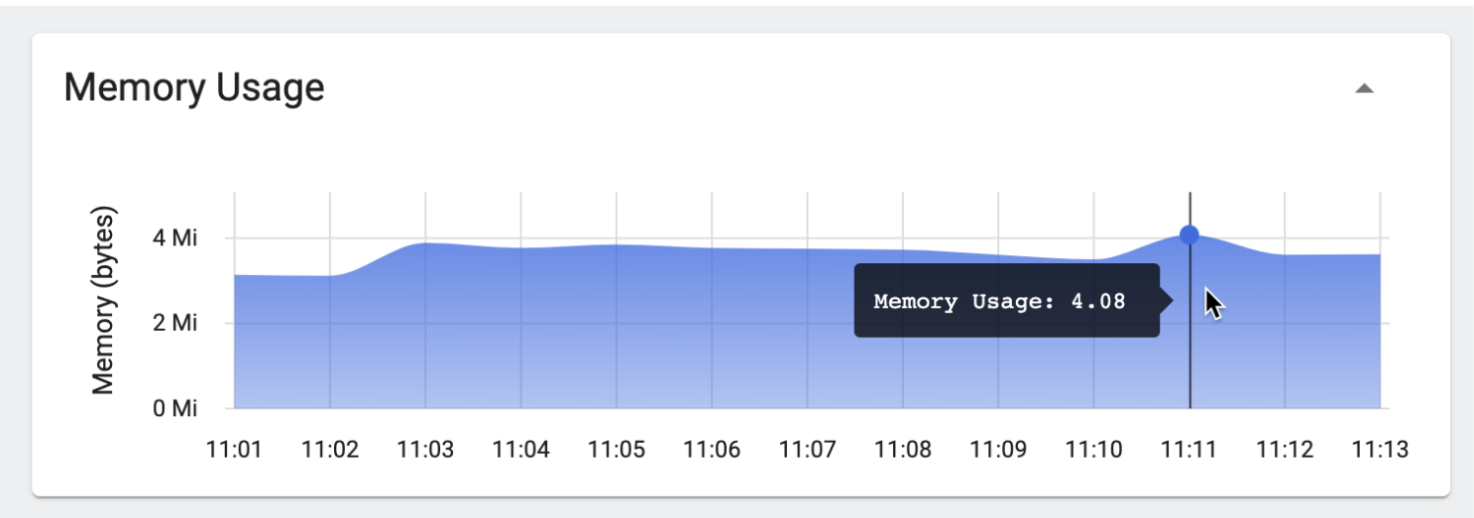
Similarly, you can set the memory limit to the namespace as shown below:
With this change, Kubernetes will never allow this pod to request resources with more memory than its defined limit at any time. In the image below, you can see how the pod was limited to 4.08m memory usage every time.
Final thoughts
While a simple Kubernetes cluster may function fine without limits and resource requests, you may start experiencing stability issues as your application complexity and workload grows. Setting up limits in an effective manner helps the cluster function properly without compromising the health of one or more workloads. Because there are multiple abstraction levels in the Kubernetes ecosystem, troubleshooting becomes a lot more difficult without proper tools. Having the ability to set up custom alerts, monitor container health, and track consumption is essential.
Unlike traditional infrastructure, a Kubernetes cluster’s resources are dynamic and constantly evolving, making real-time Kubernetes monitoring a necessity. With a comprehensive alert and monitoring tool, you can get unique and clear insights into cluster health and performance with metrics such as logs, events, latencies, and traces.
If you're looking for an efficient and effective way to monitor your Kubernetes clusters in real-time, consider Airplane. Airplane is the developer platform for building internal tools. With Airplane, you can create a custom dashboard to monitor your applications and get notified of errors. Getting started is easy, with an extensive component and template library available. You can also build complex internal tools that support your other engineering workflows.
To build your first monitoring dashboard within minutes, sign up for a free account or book a demo.