Prometheus, an open-source solution for metrics and alerting, was originally developed by SoundCloud in 2012. Today, the number of companies using Prometheus has grown dramatically. According to GitHub, Prometheus is used by more than 1,700 companies, and more than 700 individual contributors have contributed to the project.
Prometheus is a popular first step for companies looking to collect metrics and configure alerts, and it is commonly used by companies who are running workloads on Kubernetes. Prometheus is often self-hosted but can also be used as a managed offering through most of the major cloud providers, including Amazon Web Services (AWS) and Google Cloud Platform (GCP).
Prometheus has many advantages — such as its highly dimensional nature, its useful querying capabilities with PromQL, and the fact that it allows teams to configure highly customizable alerts with Alertmanager. Prometheus also has some visualization capabilities, and it’s often paired with Grafana for extended visualization.
However, Prometheus also has its limitations. And companies often look for alternatives as they start to scale or as they look to reduce the amount of engineering time required to maintain their monitoring toolset.
In this article, we’re exploring six popular alternatives to Prometheus: three open-source options and three commercial solutions.
- InfluxDB with Kapacitor
- Nagios core
- Sensu
- Datadog
- Last9
Three open-source alternatives
Open-source tools have many advantages. And for engineering teams looking to stick with an open-source solution, these three open-source projects are worth considering.
InfluxDB with Kapacitor

Launched just a year after Prometheus, InfluxDB is a popular open-source time-series database. InfluxDB and Prometheus are often compared to each other due to a shared set of goals, but the two technologies differ in a number of ways and serve different use cases.
On GitHub, InfluxDB has garnered an incredible amount of support. As of this writing, there have been more than 400 contributors to the project and more than 35,000 commits.
InfluxDB was launched to be a high-performance time-series database. And to most closely compare InfluxDB to Prometheus, you should consider using Kapacitor with it. Kapacitor, another open-source project, enables teams to monitor and alert on the data collected in a time-series database. Using Kapacitor provides functionality similar to that of Prometheus’s Alertmanager.
Like Prometheus, InfluxDB has a large number of integrations available. You can also integrate Prometheus and InfluxDB!
For engineering teams who need event logging, InfluxDB is likely a better solution. InfluxDB uses a variant of a log-structured merge tree for storage with a write-ahead log, shared by time, so it is a better choice for event logging than Prometheus, with its append-only file-per-time-series approach
There is a commercial offering available for both InfluxDB and Kapacitor. The commercial offerings might make sense for teams that have redundancy and long-term storage, and for those who need to scale horizontally.
Nagios core
Nagios, originally launched in the 1990s, is a well-known platform and provider of tools for monitoring. While there is some overlap between Prometheus and Nagios, the two technologies are quite different in their approach and capabilities.
Nagios core has a relatively old community, and contributions to the open-source project have slowed — whereas Prometheus has a very active and growing community behind it. Prometheus is largely a more robust and current solution for this generation of technology companies. Prometheus is clearly the superior solution in that it offers more integrations and better alerting capabilities, and it is easier to use.
However, there are some areas where Nagios might be a good alternative, especially for companies struggling to scale Prometheus to large systems.
Nagios is more focused on application network traffic and security, whereas Prometheus is more focused on the applications and the infrastructure itself. Perhaps the biggest benefit that Nagios offers is its ability to scale out of the box. However, if you’re using Prometheus alongside a long-term data store, like Thanos, the benefits will seem relatively small.
Nagios offers some basic visualizations out of the box. But the offering is lackluster when compared with using Prometheus alongside a dedicated visualization tool like Grafana.
Sensu
Sensu was originally launched as an open-source set of monitoring tools in 2017. The company went on to launch a commercial offering, too, and was acquired by Sumo Logic in 2021. Today, Sensu offers both open-source and commercial tools for monitoring. Sensu’s open-source offering is often compared to Prometheus, and it has a number of advantages, as well as a few important differences, including:
- Sensu, like Prometheus, allows for time-series metrics; however, Sensu allows for status, tracing, and any other JSON-encapsulated data, too.
- Sensu uses an extensible data model which allows for more than just metrics-oriented monitoring.
- Sensu’s structured data approach supports high-cardinality observations, including key-value metadata and rich service health status information, as well as raw metrics.
- Sensu is flexible, in that it supports many sources of data including Prometheus, StatsD, and Nagios.
- For larger companies with complex rundecks and remediation processes, Sensu offers a number of important integrations like PagerDuty, ServiceNow, and Jira.
- Sensu offers tools for automated remediation and allows engineering teams to get more context when troubleshooting, by enriching Prometheus endpoint data alongside other metadata.
The Sensu agent can be deployed as a sidecar or as a DaemonSet. And users are able to use a number of different datastores including InfluxDB, Elastic, and more.
To get started with Sensu, checkout the GitHub repository.
Two commercial alternatives
While using an open-source toolset has many benefits, there are often efficiencies for teams using a paid or commercial offering. Here are two paid solutions that might be good alternatives for metrics and more.
Datadog
Introduced in 2010, Datadog is a popular and widely used tool. Datadog, like Prometheus, allows users to capture critical information including metrics. Datadog is a managed SaaS offering that collects core metrics for virtually any system or service.
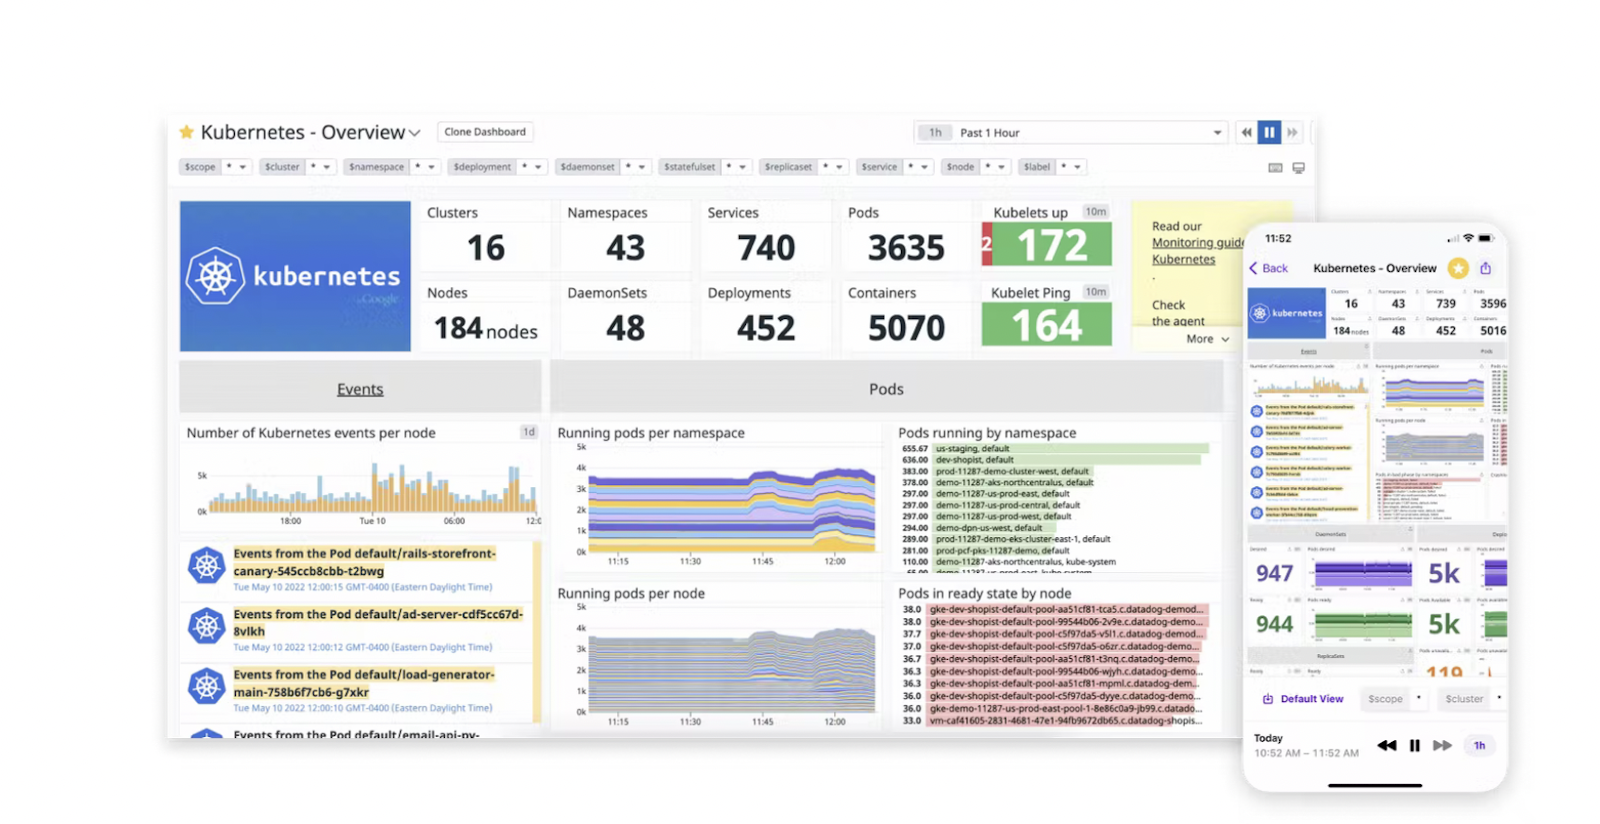
With Datadog, users are able to monitor and visualize usage metrics across their entire environment. Datadog allows companies using Kubernetes to visualize their Kubernetes clusters with pod and node-level views. You can quickly toggle between pods and nodes to see usage at points in time, and view averages over longer periods of time.
Custom metrics are available, and 100 are included per host per month.
And like Prometheus Alertmanager, Datadog allows users to create alerts based on changes or disruptions to particular services. Datadog also has a number of intelligent alerting capabilities. Using machine learning, Datadog is able to automatically create alerts for customers using the Enterprise plan.
Datadog also gives users the ability to detect anomalies automatically and forecast metrics based on past performance. Datadog’s outlier detection is helpful when troubleshooting issues on the fly. And when using the correlations feature, users are able to correlate metrics to other helpful pieces of information.
In addition to metrics, Datadog offers other helpful tools like logging, security, and APM.
Datadog has a free tier that allows users to collect metrics for as many as five hosts, and to view the data for up to 24 hours. Datadog also offers a number of paid plans and features. For metrics, Datadog offers Pro and Enterprise plans:
- Pro: $15 per host per month when billed annually, or $18 on-demand, 15-month metric retention
- Enterprise: $23 per host per month when billed annually, or $27 on-demand, 15-month metric retention as a base, with customizable retention offered
To get started with Datadog, users are able to create an account on their website. You can also contact Datadog if you would like to see a product demo.
Levitate by Last9
Last9’s Levitate platform is a commercial time-series database that was built to offer performance at a scale. The company, which was founded in 2020, offers a unique feature set for teams dealing with the challenge of using Prometheus with very large systems.
As you may know, scaling Prometheus with large workloads introduces a number of challenges including slow queries, high costs, and an increasingly large amount of time that needs to be dedicated to monitoring Prometheus itself.
With Last9, users are able to tackle high cardinality, speed up query times, and reduce the costs of storing large volumes of metrics. Last9 allows users to easily create retention policies that help to de-prioritize unhelped and outdated metrics that would otherwise lead to slowdowns and ever-increasing storage costs.
The company is PromQL-compatible, which is good for teams who have experience with the popular query language. And users are able to configure alerts across the platform and take advantage of a number of unique alerting capabilities. For example, with Last9, users are able to see the changes that happened within a system leading up to a particular issue or alert. And the anomaly detection and forecasting tools can help engineering teams get out in front of potential issues before they cascade. This makes debugging more efficient and can help to reduce alert fatigue.
To get started with Last9, users must first book a demo via the company’s website. The company offers a free trial, but how long the trial will last is not specified. The company does not provide pricing on its website.
Final thoughts
Prometheus is a widely adopted and mature solution for metrics. However, in some cases, using Prometheus might not make sense for your company. There are a number of open-source alternatives like InfluxDB with Kapacitor, Nagios, and Sensu. These open-source alternatives are similar in terms of functionality but may offer additional benefits for companies with large-scale systems, or for those who need additional capabilities.
There are also a number of commercial offerings available. We highlighted Datadog, a popular choice for larger companies, and Last9, which is a newer offering for the largest of companies who are having trouble scaling. Finally, it’s important to remember that Prometheus can be used alongside and integrated with many of these open-source and commercial offerings.
If you're looking to build a metrics dashboard in an easy and efficient manner, then check out Airplane. Airplane makes it easy to transform scripts, queries, APIs, and more into powerful internal workflows and UIs. You can get started easily by using pre-built components and templates, such as the AWS ECS dashboard and the customer insights dashboard to build metrics UIs. Airplane also offers notifications, making it easy to get notified of issues and errors in real-time that may arise.
To test it out, sign up for a free account or book a demo.