The cloud native industry relies heavily on Kubernetes, a well-liked container orchestrator, to manage and automate container deployments. Kubernetes ensures that your applications are resilient and that users can always access the requested services, but what if you deploy a new object and it crashes?
To find out why, you’ll need to get your hands dirty and use the command kubectl logs to follow the log trail your container leaves behind.
In this tutorial, you’ll learn about the log command using a live application. You can follow along locally on a minikube cluster. By the time you’ve finished, you’ll be able to troubleshoot and debug your applicationwhenever things go haywire.
Understanding kubectl logs
Logging helps you track events in your application, which can be very useful for debugging purposes and understanding why your application is behaving the way it is. These logs can be checked when the application crashes or behaves differently than expected.
Pod logs
kubectl logs let you print the logs from a running container to a standard output or error stream, and comes with many flags that can help you with your specific purpose. For example, the logs can be timestamped, follow a specific container, or prefixed with log name or container name, which makes these logs very detailed and can help you debug the pods.
To print the logs from a container, use the following command:
Let’s take an example of when logging is helpful. Suppose you have a Flask web app, many users visit you, and all the user requests and responses are logged.
Everything’s going well, until suddenly, many users are suddenly complaining about latency. In this situation, opening up the logs will help you understand the underlying cause of their problems. You can check for the slowest requests, see what users are making the slow requests, and then resolve the issue.
Aggregating all the logs can help you keep track of all the user requests and responses, which will help you understand what happened and why. It also makes it easier to visualize, such as with a Grafana dashboard, to identify potential issues.
Owner object logs
Kubernetes is a mature system, so the logs aren’t just limited to pods. The logging mechanism also supports logs from deployment and job objects:
By default, only the logs from the first container are printed on your stdout, but using the --all flag will allow you to list all the logs in the given deployment or job.
In Kubernetes, the owner object is the deployment, and the dependent object is the ReplicaSet. An owner is an object that creates or deletes a dependent object. A dependent is an object that depends on another object for its existence, but can exist individually as well.
The owner object logs helps you see all the dependent logs, which is sometimes very helpful. It can be hard to identify which pods the user request goes to when there’s a ReplicaSet. Logging the entire parent gives you all the details you need.
Practical example of log use
In this section, you will build a sample Flask application, then configure it to run on a local minikube cluster so you can begin examining logs with the kubectl logs command.
Prerequisites
You’ll need to install the Flask package before you can develop a Flask application, so make sure you have access to Python 3 and pip using the commands below:
For Windows users, use python instead of python3; you can find additional information about installing Python and pip in the official documentation for each tool.
Make sure you have installed Docker following the Docker documentation, as you will be running this application on a Kubernetes cluster, and you need to pack your application inside containers to run in the cluster.
For this tutorial, you’ll use minikube to build a local Kubernetes cluster. Follow the minikube documentation to install minikube locally on your own machine.
Finally, you’ll need to have a working knowledge of kubectl, Flask, and Docker.
Flask application
For this demo, you’ll have a Flask application with two endpoints, which will offer better log visibility. If you’d like to see the source code for the entire application, you can do so in this GitHub Repository.
Import the necessary packages
Flask is a lightweight Python web framework enabling you to create web applications quickly and easily. Install Flask using the pip command:
Import the Flask package to use them in your app:
Create a Flask application
The following code creates the Flask class with the name of the module ( __name__):
Create the status endpoint
Flask uses @app.route() decorator to bind a function to a URL.
The healthcheck route is an endpoint that can be accessed by making a GET request to /status. When this route is accessed, a response is returned that contains a JSON object with a key of “result” and a value of “OK - healthy”. The status code for this response is 200, which indicates that the request was successful.
Create the primary endpoint
Now you’ll create a primary endpoint containing the default landing page:
The above code defines a route, “/”, which accepts GET requests. When a user sends a GET request to the “/” route, the “hello” function is executed and the string “Hello World!” is returned.
Start the flask app
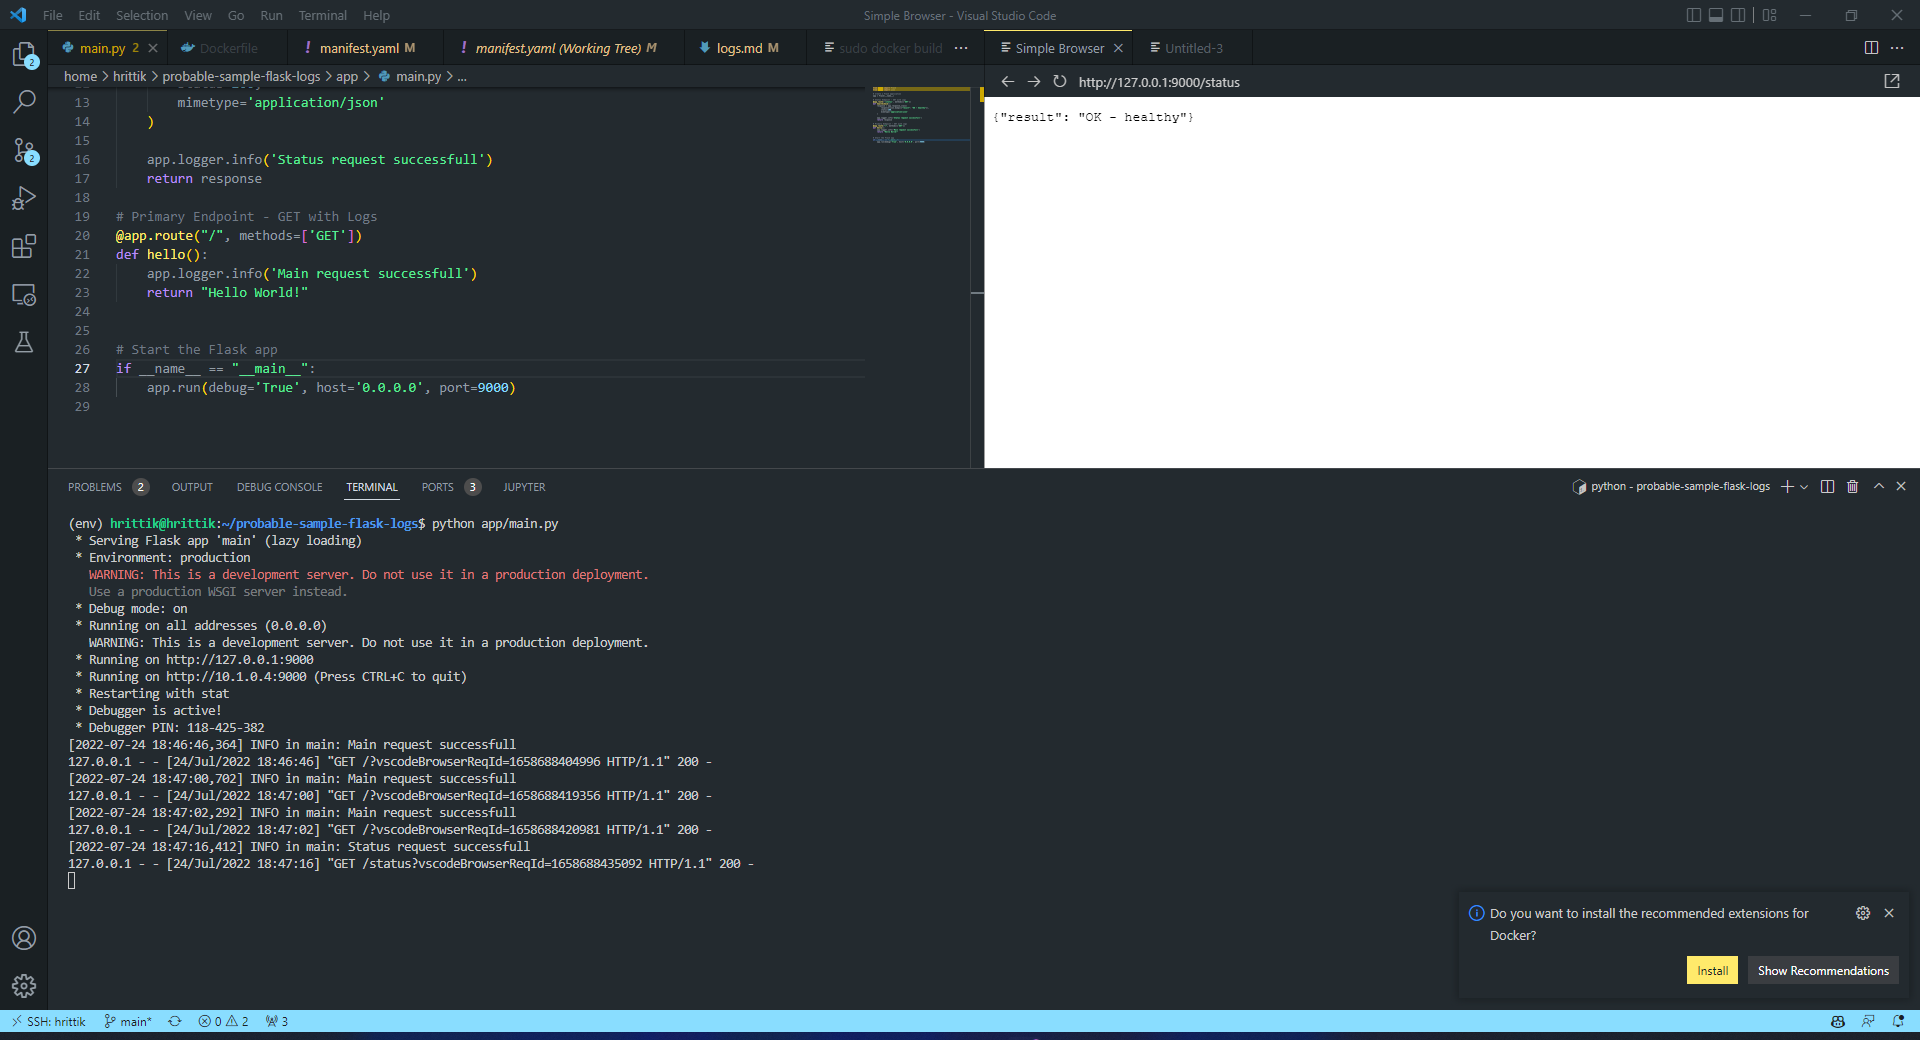
This last line of code tells your server that it should start itself. It also defines the debug option. Enabling debug mode allows you to see full error messages in the browser. The host and port options tell the server to listen to all requests coming in on port 9000 on any network interface:
Test the application
Run the app using the following command:
Test the app in your browser at http://localhost:9000/. You should see the message “Hello World!”. Visit the /status endpoint to see the status of your application and the logs that have been generated on your console.
Requirements file
A requirements.txt file is a list of dependencies for a Python project. It’s usually generated by a package installer like pip, and the content is just a list of package names and version numbers. The command to generate the file is using pip freeze > requirements.txt which tells pip to look at your current environment and create a file with all the dependencies and their versions.
The file comes in handy in the creation of a Docker container or virtual environment, because it allows you to install all the dependencies in the file with one simple command rather than running commands manually, one after one.
Building the Docker image
To run the Flask application in a Docker container, you need a Dockerfile to build a Docker image for the application. You can use the following as your Dockerfile:
The docker build command uses the specified Dockerfile to create a new Docker image. The example below will create the new image from the Dockerfile in the root directory. The new image will be tagged with the name hrittik/sample-flask:
Testing the image
The docker run command will create a new container from the “hrittik/sample-flask” image.
The container will be running in the background, as indicated by the flag -d, indicating detached mode, and port 9000 will be mapped to port 9000 on the host machine (-p 9000:9000), which you can access the same way that you’ve accessed the application in your browser previously. This time, though, the content is served from a container!
Running minikube cluster
Minikube is a tool from CNCF that makes it easy to run Kubernetes locally. Users can use Minikube to run a single-node Kubernetes cluster on their laptops with the minikube start command.
Because you’re running a minikube cluster locally, you don’t need to upload the image to an artifact repository, and can simply pass the image to your cluster using the following command:
Running the application
The manifest defines a deployment named sample-flask that creates pods running the hrittik/sample-flask container image. The container exposes port 9000, which you can externally expose for your application to be viewable in your browser:
After you have created the manifest, you can run it using the following command:
After your pods have been deployed, you are ready to access the app. You must forward traffic from port 9000 on your local machine to port 9000 on your deployment. With the port exposed, the user can access the application running in the deployment by visiting http://localhost:9000 on your web browser.
Monitor logs with the kubectl logs command
As your cluster and pods run, you can watch your pod, deployment, or job log. In this tutorial, you’ll be focusing on deployments and pods only, though it’s worth noting that jobs work the same way as deployments.
To get started, you can use the kubectl logs pod-name to get all the logs generated through the pod to standard output or error stream.
In a deployment, there may be many pods. If you’d like to specify a pod, you can first get its name by using the kubectl get pods, and then locate the pod you want to view the logs from, and replace pod-name with the name of the pod. In the below example, the pod’s name is sample-flask-7cf5758669-hh5l5.
Get recent logs
Most of the time, you won’t need all the logs your objects have ever produced. The ‘–since’ flag allows you to obtain logs since that time, and also supports RFC3339-compliant timestamps:
Show a specific number of lines of the log
To see the latest events, you may want to look at what has happened in the last few lines of logs. To do this, replace pod-name with the name of your pod, and <nr-of-lines> with a number, such as 10, which will allow you to see the last ten lines of your log stream.
Accessing the logs from other resource types
Sometimes, there might be more than one container in your pods. You can get logs of a specific container inside a specific pod by using the following kubectl logs command:
A list of deployments or jobs can be retrieved with kubectl get deployments and kubectl get jobs.
You can then retrieve the logs of a deployment with the following:
For jobs, you can use:
Advanced logs search with grep
You can search for very specific occurrences if you pipe the kubectl and grep commands together.
The kubectl logs command searches through all of the logs for a given pod and returns any lines that match the grep string. This is a handy way to troubleshoot errors in your application, as you can quickly search through all of a pod’s logs for any lines that contain the specified error string.
For example, if you want to search logs for a specific endpoint or user, you can include it in the search expression:
An example of this command in action would be using it to find all 200 successful requests, as below:
Get logs of a specific pod and all its containers with timestamps
To get logs of a specific pod and all its containers with timestamps, use kubectl logs with the timestamps flag enabled:
This command will return logs with timestamps:
Final thoughts
In this piece, you’ve learned why Kubernetes logs are vital, and how you can use them to troubleshoot your application. Once you have mastered it, Kubernetes logging will continue to help you by making it simple to monitor the health of your application and troubleshoot as necessary. In addition to application logs, you also need cluster-level logging, which will assist you in situations such as node failure or pod removal. A solution with separate storage and a lifecycle logging system that is not dependent on your nodes, pods, or containers is vital.
If you're looking for an easier way to monitor your Kubernetes containers, try using Airplane. With Airplane, you can build a powerful internal dashboard that allows you to monitor and troubleshoot your applications in real-time. Airplane also offers robust audit logging that makes it simple to monitor your application's health and easily fix issues.
Airplane also offers engineering workflows, a solution to help with your engineering-centric use cases.
Getting started with Airplane is easy. Sign up for a free account or book a demo and build your first troubleshooting dashboard within minutes.