


Logs are particularly valuable for engineering teams that are looking to learn more about what is happening inside their Kubernetes cluster. And the good news is that containerized engines are designed to support logging.
During both periods of calm and during crises, logs become an important tool for every engineer. Logs are extremely helpful when debugging issues but can also be a helpful tool in revealing areas for improvement — both obvious and obscure. Logs become even more valuable when paired with metrics, events, and alerts. There are many ways you can collect and view logs within Kubernetes.
This guide breaks down the particulars of Kubernetes logging to help steer you in the right direction. You’ll learn about methodologies, tools, and more to better manage your Kubernetes cluster.
What’s logged in Kubernetes
Kubernetes by default does not provide a native full-fledged logging solution. Instead, you are expected to extend the logging functionalities using a third-party solution like New Relic, Splunk, or Datadog. Nonetheless, Kubernetes generates certain types of logs that can be viewed using kubectl, and it also exposes certain data about the objects that can be leveraged by third-party tools to provide a complete logging solution.
The built-in logs generated by Kubernetes can be broadly classified into four different categories: application logs, cluster logs, event logs, and audit logs.
The different types of logs are stored differently, and the way you access them varies significantly depending on what Kubernetes distribution you’re using. A third-party tool can collect these logs and organize them in one place, making it easier to utilize the logs for their intended purpose.
Built-in logging options
The different categories of logs in Kubernetes are as follows:
- Application logs
- Cluster logs
- Event logs
- Audit logs
Application logs
You’ll want to know what’s happening to your specific applications. Application logging is crucial for processes like debugging or monitoring activity across clusters. Luckily, the majority of today’s applications do include some sort of logging functionality, which really helps out developers and administrators alike.
Container engines support continuous logging. These logs are written to streams, which automatically transport data from source to repository. Standard output and standard error are the most common and simplest streams available for applications.
However, no system is perfect. Native logging lifecycles are tied to nodes, pods, and containers. Should these terminate, fail, or get deleted, those logs are possibly lost forever. This isn’t ideal, as it puts an unpredictable expiration date on all log files contained within. You might very well miss opportunities to debug or conduct a thorough investigation into crippling issues.
Cluster-based logging is a solution to this and can provide an answer to this problem, as the status fate of those logs is independent of the components they’re tied to. You have to supply your own backend to make this possible; Kubernetes does not provide a default or a baked-in storage solution.
Cluster logs
Divorced somewhat from your applications are the Kubernetes system components. These are the default components that drive the system’s overall functionality. Some run in containers (ex. kube-proxy and the Kubernetes scheduler) while others don’t (ex. kubelet and container runtime).
There’s no central place defined for the storage of these logs. Each component (kube-apiserver, kube-scheduler, etcd etc.) stores its logs in the server it’s running on. This is usually the master node for most components. But since Kubelet runs on worker nodes, each worker node will generate its own Kubelet logs.
Where are system component logs stored? That answer depends on the type of machine you’re running.
- Those with
systemdusejournaldas a logging destination, which kubelet and container runtime write to. - Otherwise, machines will create
.logfiles within the/var/logdirectory. System components send logs to the same location but instead use theklogmechanism to get this done. Default methods are ignored in these cases.
Because of the lack of a centralized location for storing cluster logs, efficiently utilizing the logs requires a little bit of creativity. You might run a node-level logging agent on each node, implement a logging sidecar container, or push logs to a dedicated backend. These are reliable ways to moveshift information back and forth, while retaining it for later analysis.
Once logs are stored, they don’t simply stagnate. It’s the responsibility of your configuration to rotate these periodically, or once they surpass the 100MB size threshold. These files are compressed, relocated, renamed, or deleted automatically to counteract gradual bloating. Just imagine if you run hundreds of containers or nodes—those file sizes would add up quickly!
Event logs
By default, your Kubernetes system will self-monitor for any notable events that occur throughout uptime. Because there are different events that hold meaning at unique levels of the system, Kubernetes uses a logging architecture to keep things organized. You can leverage logging at the container, node, and cluster during operation, or after a set point, using kubectl.
Let’s take nodes, for example. Many pods live on each node and carry out processes; when these processes are completed—or resources become scarce—those pods are terminated or evicted. This is an event worthy of investigation, since it may indicate a systemic problem. Perhaps better provisioning is in order.
Similarly, the Kubernetes log might also track different scheduling behaviors as they occur throughout the environment.
You’d want to hear about a FailedScheduling event and understand why it occurred. Rebooted, NodeNotReady, and HostPortConflict are usually quite important too. You can view all Failed events, Warnings events, and more within your logs.
However, this might not display as you’d expect. Kubernetes doesn’t default to a GUI where you can search through logs visually. Instead, you’d use kubectl commands to get log files from the Kubernetes “black box”—choosing filters or other criteria with significance to your deployment.
Audit logs
Kubernetes can be configured to monitor and log requests to the apiserver. These logs provide greater visibility into the actions that happen in the cluster. The audit logs record the actions initiated by the users, by applications using the Kubernetes API, or by the control plane itself. The audit logs can tell you which actions have taken place in the cluster, who or what initiated it, when and how did it happen, and where did it happen.
Audit logs are extremely important for detecting security issues by looking for unusual behaviors or troubleshooting issues with API requests. These logs are not enabled by default. When enabled, Kubernetes provides two backends out of the box that can route the audit logs to either a log file or a webhook.
How to collect logs
As mentioned above, there is no centralized method for collecting logs out of the box. Depending on the type of the log - whether it’s application log or cluster log - the method is different. In this section, two methods of collecting logs are shown. The first method is for collecting application logs using the standard output, and the second method is for collecting cluster logs.
Logging via standard output
This is the most basic form of logging from inside an application. Simply print the logs to the standard output or standard error and they can be viewed using kubectl.
As an example, consider the following specification file, saved in bugger-pod.yaml:
This file uses a busybox container to run a simple shell command. The argos field denotes the command that is to be executed. In this case, the command prints the current date to the standard output every 5 minutes
Next, you’d want to run this pod by invoking the following command: kubectl apply -f bugger-pod.yaml. A confirmation message will appear signifying successful pod creation.
From there, grabbing the pod’s logs is quite easy:
Your output might resemble the following if you choose to write a log every five minutes:
| 0: | Tue | Jun | 8 | 00:00:01 | UTC | 2021 |
| 1: | Tue | Jun | 8 | 00:00:06 | UTC | 2021 |
| 2: | Tue | Jun | 8 | 00:00:11 | UTC | 2021 |
| 3: | Tue | Jun | 8 | 00:00:16 | UTC | 2021 |
However, you must incorporate a third-party solution in order to collect (and view) these logs effectively. DevOps teams regularly turn to solutions like Prometheus, Grafana, the ELK Stack, and Fluentd (among others) for comprehensive monitoring.
Not only do these tools link with storage databases, they also include visualizations and processing functions to simplify digestion. Google Cloud’s operations suite (formerly Stackdriver) is another popular freemium tool for monitoring memory and CPU usage across your clusters.
Cluster level logging
Since the different components of a cluster have different places where they store their logs, you’d want a way to bring these logs to a centralized location. For that, you can either run a node logging agent on each node that can collect all the logs from the different components running on the node and push them to a central location, or you can run a dedicated sidecar container within the application pods that can pick up logs from the application containers.
Using a node logging agent
A node logging agent is usually a container, or DaemonSet, that runs on each node and has access to the log directory. Its job is to collect the logs from various application containers running on the node and pass them to an aggregation tool and database of your choosing that interfaces with Kubernetes.
Because Kubernetes cannot rotate created logs by default itself, engineering teams must implement some sort of log rotation solution to remain storage conscious. Thankfully, the logrotate tool automatically runs every hour within a given cluster, should you enable it. You might also accomplish this via container runtime. For management purposes, the configure-helper and kube-up.sh scripts are highly useful.
Be sure to run each logging agent as a DaemonSet since they’ll be running on every node. This logging is considered a recurring background task, hence why these DaemonSets are appropriate.
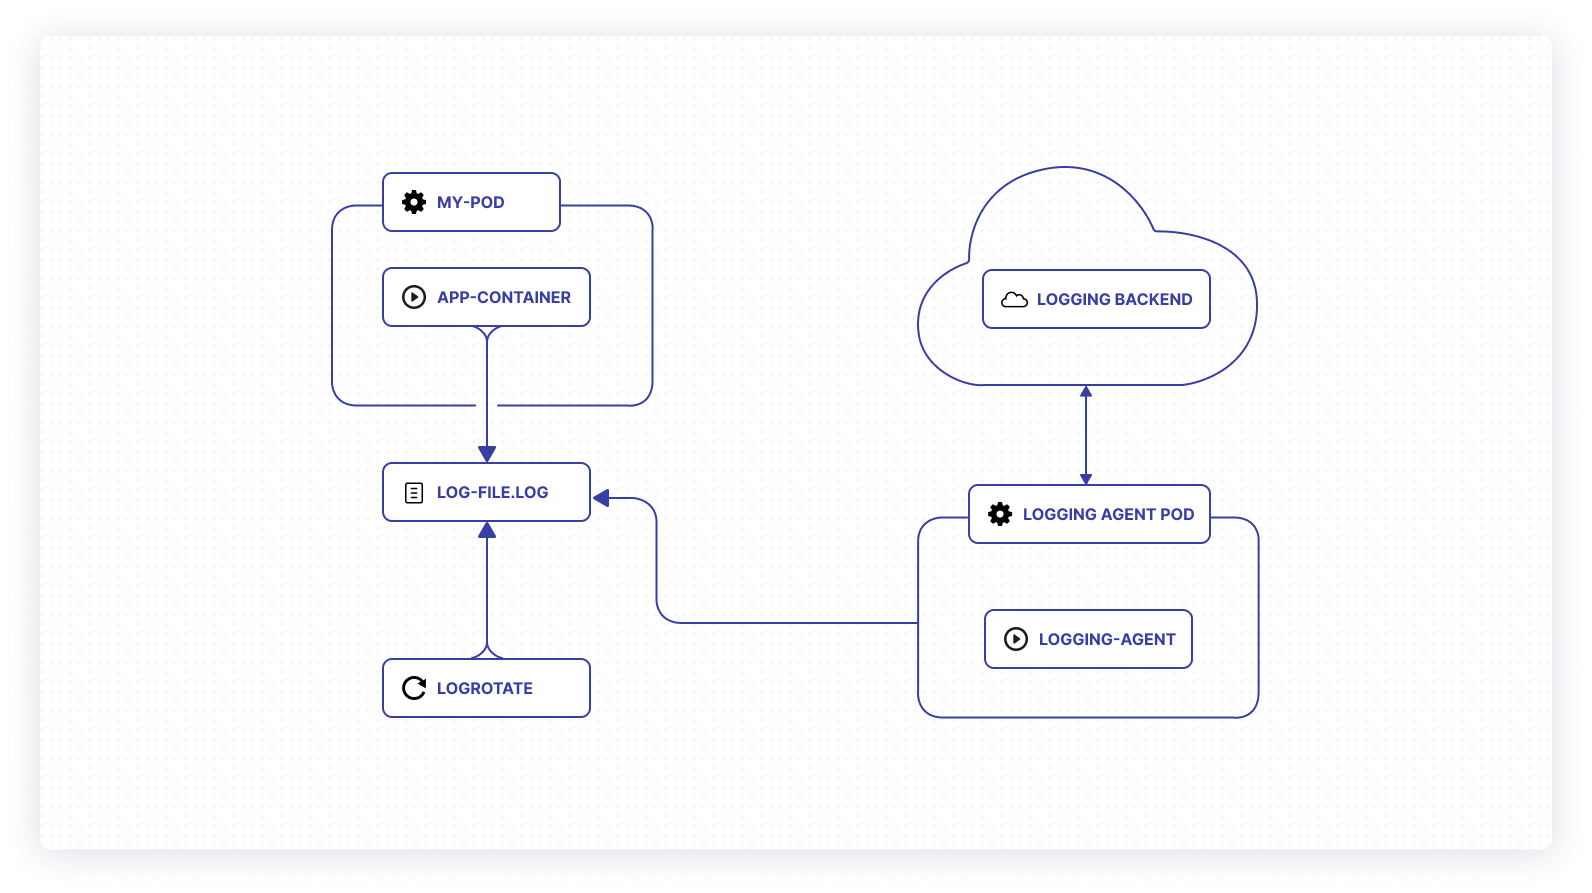
The node logging agent has five moving parts that interact seamlessly: pods communicate runtime information via stdout and stderr and compile it into a log file. A rotational tool interacts periodically with these logs to keep things fresh and optimized. A logging agent writes directly to the log directory without an intermediary, while communicating back and forth with an established backend.
Using sidecar containers
If you want to add a sidecar container, this container would coexist with a given app container in the relevant pod. Your app container communicates with the sidecar, and vice versa, enabling an ongoing exchange of information. This allows your node’s kubelet to do some heavy lifting, while the sidecar redirects logging information via its own standard output and error streams.
This segregation allows for the organization of logs and compartmentalizes certain application pieces as needed. One stream of data might have standalone importance. Additionally, not all application parts can write using the default stdout and stderr pathways.
The stdout and stderr stream from the sidecar container can be picked up by the node logging agent and synced to your external backend. You can also run a sidecar container that can directly communicate with the backend, eliminating the need for a node logging agent. Furthermore, since the sidecar logs are just printed to the stdout and stderr, they can be viewed using kubectl as mentioned in the next section.
Viewing logs with Kubectl
There are a number of commands you might use to access log files. Varying widely in complexity, each taps into background details on specific resources within Kubernetes. That might include simply grabbing a log for a single pod or something relatively complex, like leveraging arguments to access labeled logs for pods sharing multiple containers.
Let’s tackle the first example via the following command:
This effectively summons any relevant system logs for a specific pod. kubectl outputs the result of that command immediately beneath it. Thankfully, Kubernetes is pretty good about spitting this information out in a format that’s human-readable:
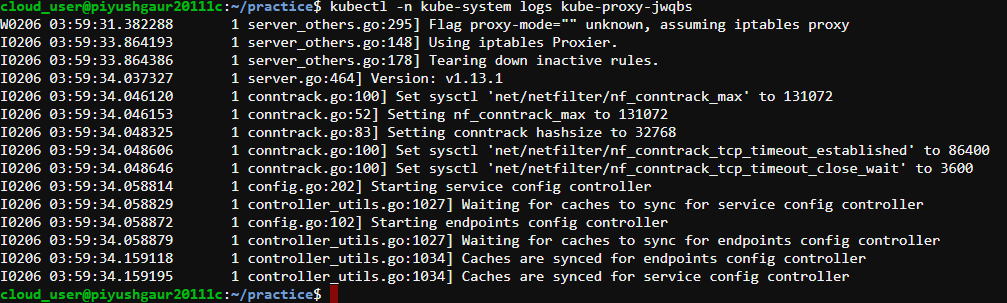
The readability of these results makes it much simpler to understand your system’s inner workings. It’s typically assumed that Kubernetes will produce a log reliably during a given period of time. However, that’s not always the case.
It’s possible that time elapses where no critical events—or processes—are observed. You might see this when attempting to view logs during a predefined window of time. The terminal window will be blank to signal this result.
The kubectl logs command supports multiple flags that can be used to fine-tune the search for logs. The most important one is --since. Using the --since flag, you can specify a window of time for viewing the logs. For example,
The above command would pull all logs for the pod, hyperpod2, from the last two hours. Again, when applying this to a legitimate Kubernetes setup, there may or may not be a relevant output.
Closing thoughts
Logging in Kubernetes is undoubtedly essential. The process unlocks greater visibility into your system and allows for much faster issue remediation than if you were flying blindly. While Kubernetes native logging does present some unique challenges, there are multiple ways to approach logging that are both reliable and relatively user-friendly.
Both cluster health and application monitoring practices can sharply improve via intelligent logging. By using the tools available—externally and internally—you’ll be on your way to maintaining a performant, stable application infrastructure in the long term.
If you're looking for a maintenance-free platform that makes it easy to monitor your application health, consider Airplane. Airplane is the developer platform for building internal tools. With Airplane, you get powerful built-ins, such as audit logs that make it easy to track your run executions and troubleshoot errors. In addition to audit logs, you get permissions settings, job scheduling, and more.
To try it out and utilize powerful built-ins when creating custom internal tools, sign up for a free account or book a demo.


