


When something goes wrong, it’s often the DevOps engineer who’s responsible for detecting and solving the issue immediately. While Kubernetes has many benefits when it comes to speed and resource efficiency, its added complexity can make debugging more difficult. In order to resolve problems efficiently and avoid interruptions for end users, it’s vitally important that you understand how to debug a Kubernetes cluster.
In this article, you’ll learn how to quickly and effectively debug your cluster, nodes, pods, and containers.
Cluster level debugging
Let’s say there’s an issue with your Kubernetes cluster. Because these clusters are made up of several components like nodes and control planes, any problem with them can lead to issues with your cluster. To successfully debug the cluster, you can try one of the suggestions in the following sections.
Obtaining information about your clusters
The first step toward debugging your cluster is to gather more information about its components. Run the following command:
The kubectl cluster-info command outputs information about the status of the control plane and CoreDNS. As seen below, the command shows there are no issues with the control plane of the cluster and the CoreDNS is running correctly.
To get more detailed information about your cluster, you can run:
The output of the previous command was not included due to its length.
The kubectl cluster-info dump command gives detailed information about your cluster and activities carried out on the cluster.
Getting the status of your node
An unhealthy node is a problem and affects the cluster as a whole. To get the status of a node, run:
The command’s output shows you the name, status, roles, age, and the Kubernetes version that runs the node.
Below, the node with the minikube name has the ready status. So the minikube node is running fine, and there are no issues. If you notice that the status of any of your nodes is not ready, then you can assume there’s an issue with the node.
| NAME | STATUS | ROLES | AGE | VERSION |
|---|---|---|---|---|
| minikube | Ready | control-plane,master | 3d12h | v1.22.2 |
Getting the health status of cluster components
Kubernetes clusters have different components like the scheduler, controller manager, and the etcd. Knowing the health status of the components will help save time debugging your cluster. To get the health status of your cluster components, run:
As you can see below, the scheduler is unhealthy, while the controller manager and etcd are healthy.
| NAME | STATUS | MESSAGE | ERROR |
|---|---|---|---|
| scheduler | Unhealthy | Get "http://127.0.0.1:10251/healthz": dial tcp 127.0.0.1:10251: | connect: connection refused |
| controller-manager | Healthy | OK | |
| etcd-0 | Healthy | {"health":"true","reason":""} |
Getting activities in your cluster
Viewing all of the events that have taken place on your cluster is another effective way to debug your cluster. You can spot any error that occurred while a particular action was carried out on your cluster namespace.
To get all the events that occurred in your cluster, you can run:
The command below will show you the details of all events carried out on your cluster and why the action occurred.
| 40s | Normal | Scheduled | pod/worker-deploy-799b5fb489-7c4sx | Successfully assigned default/worker-deploy-799b5fb489-7c4sx to minikube |
| 37s | Normal | Pulled | pod/worker-deploy-799b5fb489-7c4sx | Container image "kodekloud/examplevotingapp_worker:v1" already present on machine |
| 35s | Normal | Created | pod/worker-deploy-799b5fb489-7c4sx | Created container worker-app |
| 35s | Normal | Started | pod/worker-deploy-799b5fb489-7c4sx | Started container worker-app |
| 41s | Normal | Killing | pod/worker-deploy-799b5fb489-gc9xr | Stopping container worker-app |
| 41s | Normal | SuccessfulCreate | replicaset/worker-deploy-799b5fb489 | Created pod: worker-deploy-799b5fb489-7c4sx |
Pods and container debugging
If your cluster and node are healthy, but you still have issues with your pods and container, it’s time to examine the pods and containers running inside. You may have mistakenly tried to run a pod with a nonexistent image or something similar. These suggested actions below might be a helpful starting point.
Describing pods
You may have issues with your pods due to problems with the containers inside them. When you run kubectl get pods, you might notice a status like ImagePullBackOff or pending instead of the normal Running status. The kubectl describe pod podname can help you quickly get to the root of the trouble. Let’s dive into these two examples.
Pods with imagepullbackoff error status
To simulate an example of a pod with the status ImagePullBackOff error, create a pod with the image busybox888. Copy the YAML content below and store it inside a file with the name pods.yaml. Then, create a pod object with kubectl create -f pods.yaml.
Get the pods running on your cluster with kubectl get pods. You can see the output of this command below. Notice that the demopod has ImagePullBackOff status.
| NAME | READY | STATUS | RESTARTS | AGE |
|---|---|---|---|---|
| demopod | 0/1 | ImagePullBackOff | 0 | 2m13s |
| postgres-deploy-8695749f5f-nnd67 | 1/1 | Running | 3 (3h4m ago) | 9d |
| redis-deploy-5d7988b4bb-9kntq | 1/1 | Running | 3 (3h4m ago) | 9d |
| result-app-deploy-b8f4fc44b-8phh2 | 1/1 | Running | 3 (3h4m ago) | 9d |
| voting-app-deploy-547678ccc7-67sh5 | 1/1 | Running | 3 (3h4m ago) | 9d |
| worker-deploy-799b5fb489-7c4sx | 1/1 | Running | 0 | 37m |
After seeing the ImagePullBackOff status, you need to be able to identify the cause of ImagePullBAckOff correctly. The kubectl describe pod gives a comprehensive overview of your pods.
To get an overview of demopod, run:
If you scroll down after running the command, you’ll notice the output below showing the reason for the error. The error occurred because Kubernetes couldn’t pull the image from the Docker repository. The ImagePullBackOff error can occur if the image doesn’t exist or is hosted inside a private Docker registry that’s not accessible to Kubernetes.
The error can also occur when Kubernetes tries to pull a container with an image that’s not hosted on the Docker public registry but in your local computer system. Kubernetes will try to pull the image multiple times without success, leading to an ImagePullBackOff error.
If you take a look at the output of the kubectl describe pod demopod command, you will notice an ErrImagePull error. This error occurs while pulling the image of the container that will run inside the pod. Notice also the ImagePullBackOff error, which happens when Kubernetes stops pulling the image due to several ErrImagePull errors.
In this scenario, the failure occurred because the busybox888 image doesn’t exist. Kubernetes will try to pull the busybox888 image, but the output will show an ErrImagePull error. Kubernetes will try to pull the image again, and for each pull, the ErrImagePull error displays, resulting in the ImagePullBackOff error.
Events:
| TYPE | REASON | AGE | FROM | MESSAGE |
|---|---|---|---|---|
| ---- | ------ | ---- | ---- | ------- |
| Normal | Scheduled | 27m | default-scheduler | Successfully assigned default/demopod to minikube |
| Normal | Pulling | 25m (x4 over 27m) | kubelet | Pulling image "busybox888" |
| Warning | Failed | 25m (x4 over 27m) | kubelet | Failed to pull image "busybox888": rpc error: code = Unknown desc = Error response from daemon: pull access denied for busybox888, repository does not exist or may require 'docker login': denied: requested access to the resource is denied |
| Warning | Failed | 25m (x4 over 27m) | kubelet | Error: ErrImagePull |
| Warning | Failed | 25m (x4 over 27m) | kubelet | Error: ImagePullBackOff |
| Normal | BackOff | 2m26s (x101 over 27m) | kubelet | Back-off pulling image "busybox888" |
The correct name for the image is busybox, not busybox888. You’ll need to change the image name from busybox888 to busybox.
If you’re sure that the image name is correct, but you see ImagePullBackOff, the error could have occurred because the container image is hosted in a private Docker registry. To resolve this, you can specify the authorization details inside secrets.
Pods with pending status
When you run the kubectl get pods command, you can sometimes see pods with pending status. To simulate that scenario, create 1,000 pods on your Kubernetes namespace cluster.
Copy the content below and save it inside the deployment file that you created previously. Make sure you delete the previous contents in the deployment file.
Run kubectl apply -f deployment.yaml to apply the changes to your deployment. Then run kubectl get pods to get your pods. Notice that a pod called demodeploy-6df58566f5-2p969 has pending status. You can use the kubectl describe pods name of pod to get more details about the pending status.
| NAME | READY | STATUS | RESTARTS | AGE |
|---|---|---|---|---|
| demodeploy-6df58566f5-26jwq | 0/1 | Terminating | 0 | 12m |
| demodeploy-6df58566f5-2p969 | 0/1 | Pending | 0 | 5m43s |
| demodeploy-6df58566f5-2vwn9 | 0/1 | Pending | 0 | 5m39s |
| demodeploy-6df58566f5-2xftp | 0/1 | Pending | 0 | 4s |
| demodeploy-6df58566f5-4jrvc | 0/1 | Pending | 0 | 7s |
| demodeploy-6df58566f5-4rp6m | 0/1 | Pending | 0 | 5m42s |
| demodeploy-6df58566f5-4xb7n | 0/1 | Pending | 0 | 5m33s |
| demodeploy-6df58566f5-4zpsk | 0/1 | Pending | 0 | 5m50s |
In order to find out why pod demodeploy-6df58566f5-2p969 is pending, you can run kubectl describe pod with the demodeploy-6df58566f5-2p969 pod, i.e. kubectl describe pod demodeploy-6df58566f5-2p969.
kubectl describe pods nameofpodwithpendingstatus gets you detailed information about any pod with pending status. In this case, the demodeploy-6df58566f5-2p969 pod has a pending status and was included in kubectl describe pod. In your case, the pod with pending status might have a different name; you need to get the name and add it to the kubectl describe pod, i.e. kubectl describe pod nameofyourpodwithpendingstatus.
After running the kubectl describe pods nameofyourpodwithpendingstatus command, scroll down to the bottom of the output of the command. You’ll see the information shown below.
| Status: | Pending |
| kube-api-access-np625: | |
| Type: | Projected (a volume that contains injected data from multiple sources) |
| TokenExpirationSeconds: | 3607 |
| ConfigMapName: | kube-root-ca.crt |
| ConfigMapOptional: | <nil> |
| DownwardAPI: | true; |
| QoS Class: | BestEffort |
| Node-Selectors: | <none> |
| Tolerations: | node.kubernetes.io/not-ready:NoExecute op=Exists for 300s |
| node.kubernetes.io/unreachable:NoExecute op=Exists for 300s |
Events:
| Type | Reason | Age | From | Message |
|---|---|---|---|---|
| ---- | ----- | ---- | ---- | ------- |
| Warning | FailedScheduling | 5m44s (x4 over 6m37s) | default-scheduler | 0/1 nodes are available: 1 Too many pods. |
The result shows that there are too many pods on the cluster (in this case, the cluster is running on minikube). The demodeploy-6df58566f5-2p969 pod will remain in the pending state due to the overload of pods. If you encounter such an error, make sure the cluster is not overloaded.
Other pod errors
When running kubectl get pods, you’ll naturally encounter other errors. The kubectl describe podname command can get you more information. Some possible errors include:
RunContainerError. Occurs when the container inside the pod can’t start due to the application’s configuration inside the container.KillContainerError. Occurs when the container running inside the pod fails to stop (or be killed).SetupNetworkError. Occurs if there is an issue setting up the network for the pod.CrashLoopBackOff. Occurs when your pods continuously crash in an endless loop after starting. It can be caused by an issue with the application inside the container, misconfiguring parameters of the pod or container, or errors while creating your Kubernetes cluster. This could include using the same port for two or more containers in a pod.- Pods stuck in an error state. Occurs when the scheduler has scheduled the pod, but the pod fails to start.
kubectl describe podcan help solve this.
Pod level logging
In addition to describing your pods, you can also check your pods’ logs. To view the events that have occurred inside your pods, run kubectl get logs podname.
Use kubectl get pods to get all your pods and then run kubectl logs anyrunningpodname.
The kubectl get pods command will output something similar to what’s shown below.
| ERROR: | relation "votes" does not exist at character 38 |
| STATEMENT: | SELECT vote, COUNT(id) AS count FROM votes GROUP BY vote |
| ERROR: | relation "votes" does not exist at character 38 |
| STATEMENT: | SELECT vote, COUNT(id) AS count FROM votes GROUP BY vote |
| ERROR: | relation "votes" does not exist at character 38 |
| STATEMENT: | SELECT vote, COUNT(id) AS count FROM votes GROUP BY vote |
| ERROR: | relation "votes" does not exist at character 38 |
| STATEMENT: | SELECT vote, COUNT(id) AS count FROM votes GROUP BY vote |
| ERROR: | relation "votes" does not exist at character 38 |
| STATEMENT: | SELECT vote, COUNT(id) AS count FROM votes GROUP BY vote |
| ERROR: | relation "votes" does not exist at character 38 |
| STATEMENT: | SELECT vote, COUNT(id) AS count FROM votes GROUP BY vote |
As you can see, the logs show details about the pod’s events, which can help you to understand how the container inside your pods is running.
Using exec to debug
Let’s say you want to fix errors that might be caused by the application running inside your container or the misconfiguration of your container. However, you can’t access the application unless you’re inside the container. To get inside and fix the errors, you need to use the kubectl exec command.
Copy the pod definition commands below and save them inside any file of your choice.
To navigate into the Redis container running inside demopod, run kubectl exec -it demopod -- /bin/bash. The -it makes the execution interactive or gives you an interactive interface. The command will display something similar to what is shown below. You’re inside the Redis container and can proceed to check other information like environmental details.
Other Kubernetes debugging tips
Your pods and containers might be running fine, however, you may not be able to access the pods externally (over the internet). If you can’t access your application running inside your pods, it might be due to misconfiguration in your service YAML file.
Copy the pod definition YAML content below into any file of your choice.
Then, copy the service definition YAML content below into another file of your choice.
Create both files by running kubectl create -f filename.
Finally, run kubectl get service to ensure your service has been created, as shown below.
| NAME | TYPE | CLUSTER-IP | EXTERNAL-IP | PORT(S) | AGE |
| 10d | |||||
| service-myapp | NodePort | 10.96.95.52 | <none> | 80:30008/TCP | 31s |
To get the service URL, run minikube service service-myapp --url.
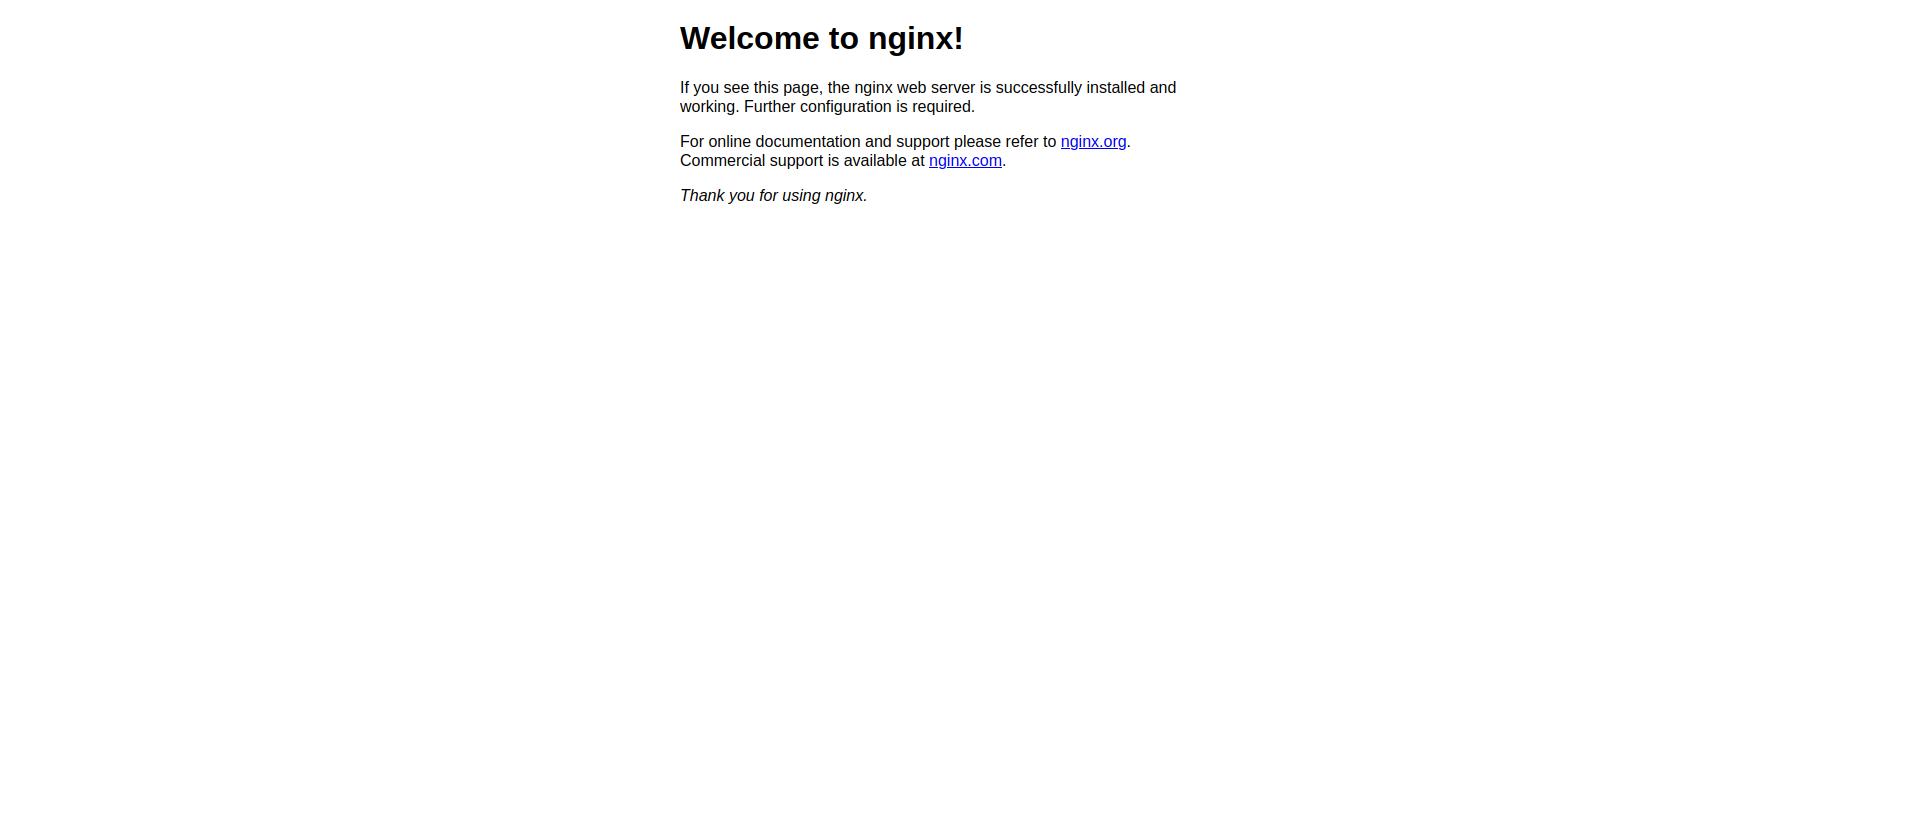
When you click on the link, you should see the image below showing the output of NGINX. If you can’t see the image, then there’s an issue with your service. The error can occur if you specify a target port number that’s different from the NodePort number. Rectify this by specifying the correct port number in the service and pod YAML configuration files.
Another possible cause of the error might be that you didn’t specify the correct selector inside your service YAML file.
Listing the api version
If the API version of your Kubernetes objects has been misconfigured, you may be using a different API version that’s outdated or inaccurate. To troubleshoot this, list the apiVersion for each object.
A tool called Move2Kube uses source artifacts like Docker Compose or Cloud Foundry manifest files to source and generate Kubernetes deployment artifacts, including object YAML, Helm charts, and operators. You can install Move2Kube with the command below.
Next, run move2kube collect. You will see a similar output below, which shows that the information has been collected.
You’ll see something similar to what is shown below.
Navigate into the m2k_collect folder and find the clusters folder (the cluster folder holds collected information about your Kubernetes cluster). In the clusters folder is a file with the name minikube--77f0e6522d6f6d24.yaml. Use that to view the file’s content. While the output is longer than this, you can still double-check that you’re using the right apiVersion.
Final thoughts
This article has introduced you to several ways to debug your Kubernetes clusters, pods, and containers. With a few simple kubectl commands, you can solve problems that range from misconfiguring your API version to identifying that you ran your pod with an image that wasn’t located on the Docker repository.
If you're looking to build an internal UI to help monitor and debug your Kubernetes clusters, pods, and containers, consider Airplane. Airplane is the developer platform for building custom internal tools. With Airplane Views, you can build a robust monitoring dashboard within minutes using Airplane's pre-built component library and template library.
To get started and build your first internal UI within minutes, sign up for a free account or book a demo.


