Kubernetes is an open-source container orchestration framework. It helps teams to automatically deploy, scale, and manage large fleets of containers. However, it brings with it a whole new set of challenges when it comes to troubleshooting and debugging.
Containerized applications are different from traditional applications — they are packaged in pods, and these pods are randomly created and destroyed throughout the app’s lifecycle. Therefore conventional methods of troubleshooting often fail to deliver the best results.
In this guide, we highlight a newer tool called Komodor, a Kubernetes-native troubleshooting tool, that aims to solve these problems. We will discuss how Komodor works, why you should opt for it, and what other options might be alternative to Komodor.
How does Komodor work?
Komodor is a troubleshooting and monitoring tool for your Kubernetes clusters. It integrates with your clusters and keeps an eye on the health of each component. You can integrate it with a variety of third-party tools to keep yourself in the loop. It also generates detailed statistics and visualization on your cluster’s performance for you to analyze and make decisions.
Key features
Komodor offers an array of key features to help you track and troubleshoot your K8s clusters easily. The first feature to catch the eye is the events section.
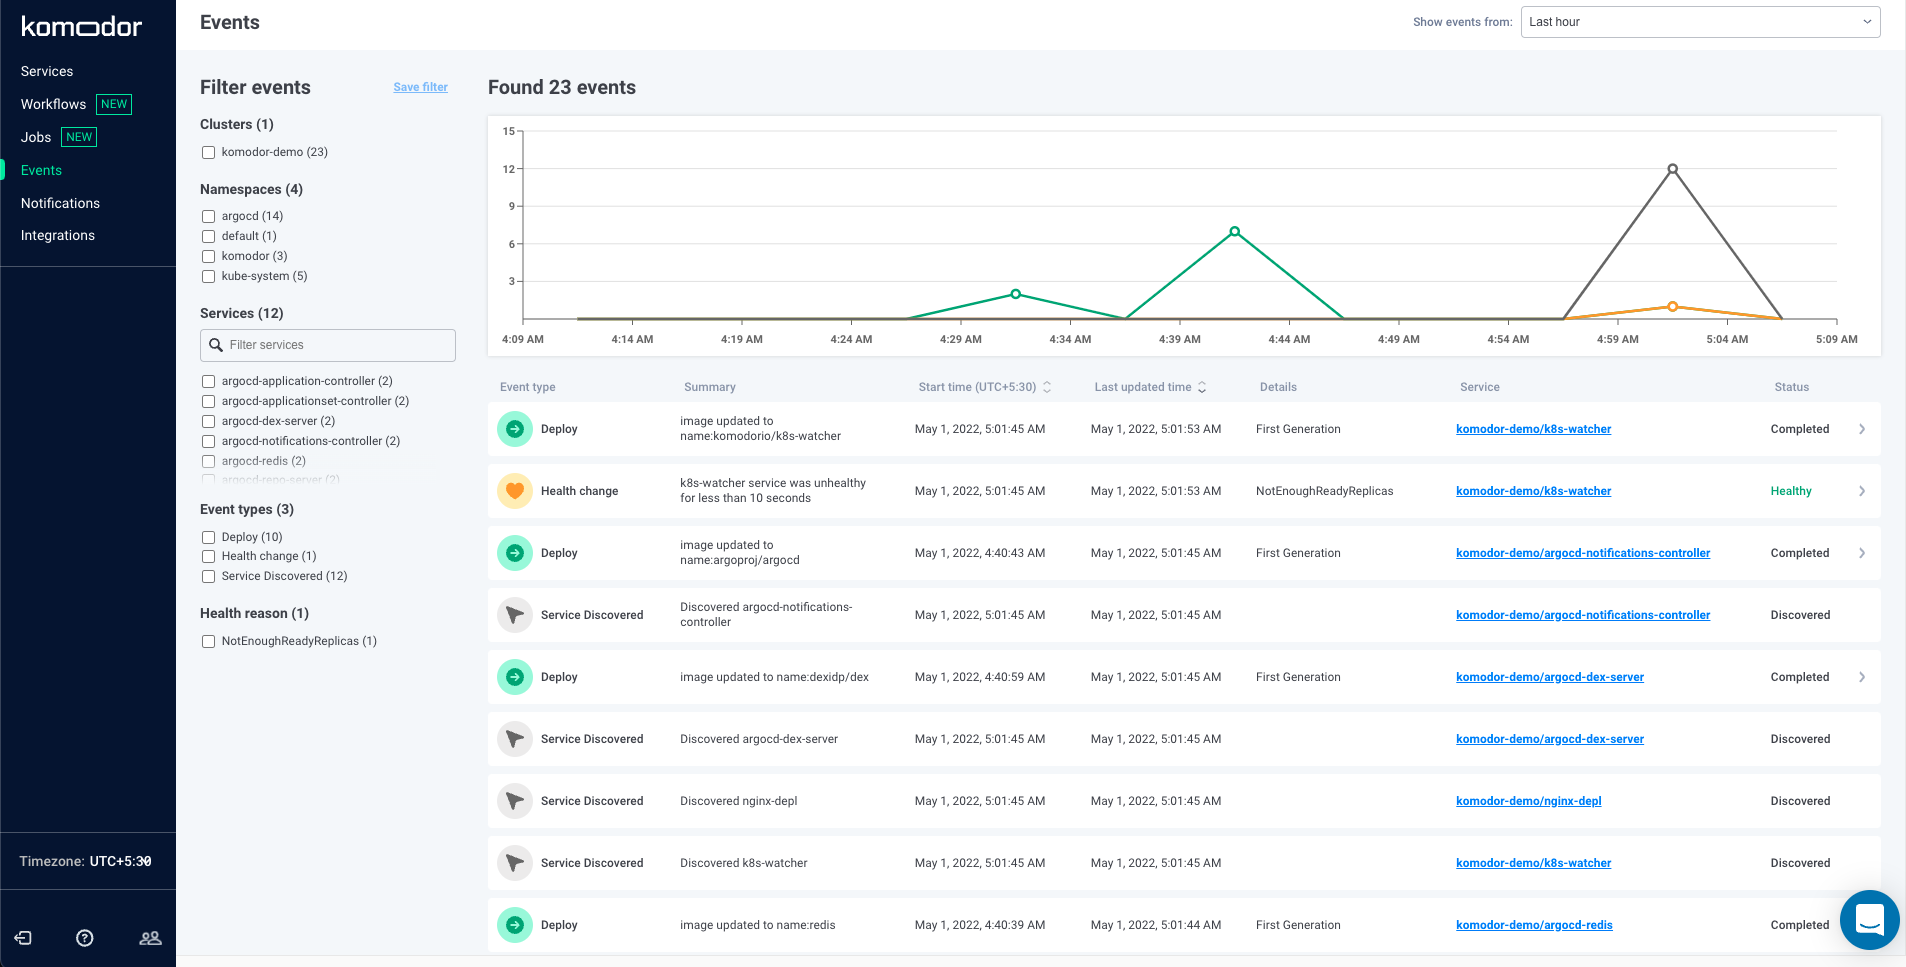
Komodor tracks all events that occur in your Kubernetes clusters and stacks them against time to show you a histogram of what’s been happening with your clusters. The events are quite detailed in themselves.
For instance, if you encounter an unhealthy service, this is what the event notification would look like:
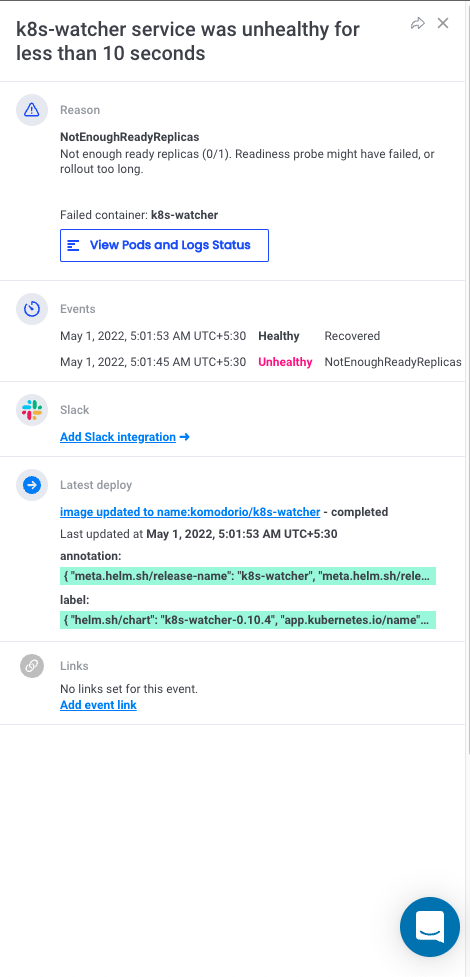
You can add integrations to Slack and other services via Links to add more metadata about your issues and send out alerts as needed.
Installation & Support
Komodor is one of the simplest tools to get started with. The initial setup process is a breeze, and setting up hardly takes around 5 minutes. All you need to do is to name your cluster and run a set of pre-generated commands from Komodor on your cluster to set up the connection between the two.
As soon as you run the commands, Komodor automatically listens and connects to your cluster. It discovers available services and starts monitoring them instantly.
Komodor also provides customer support via chat for users struggling with their first few steps. While it is not the most instant experience, it sure complements the good amount of documentation provided by the team.
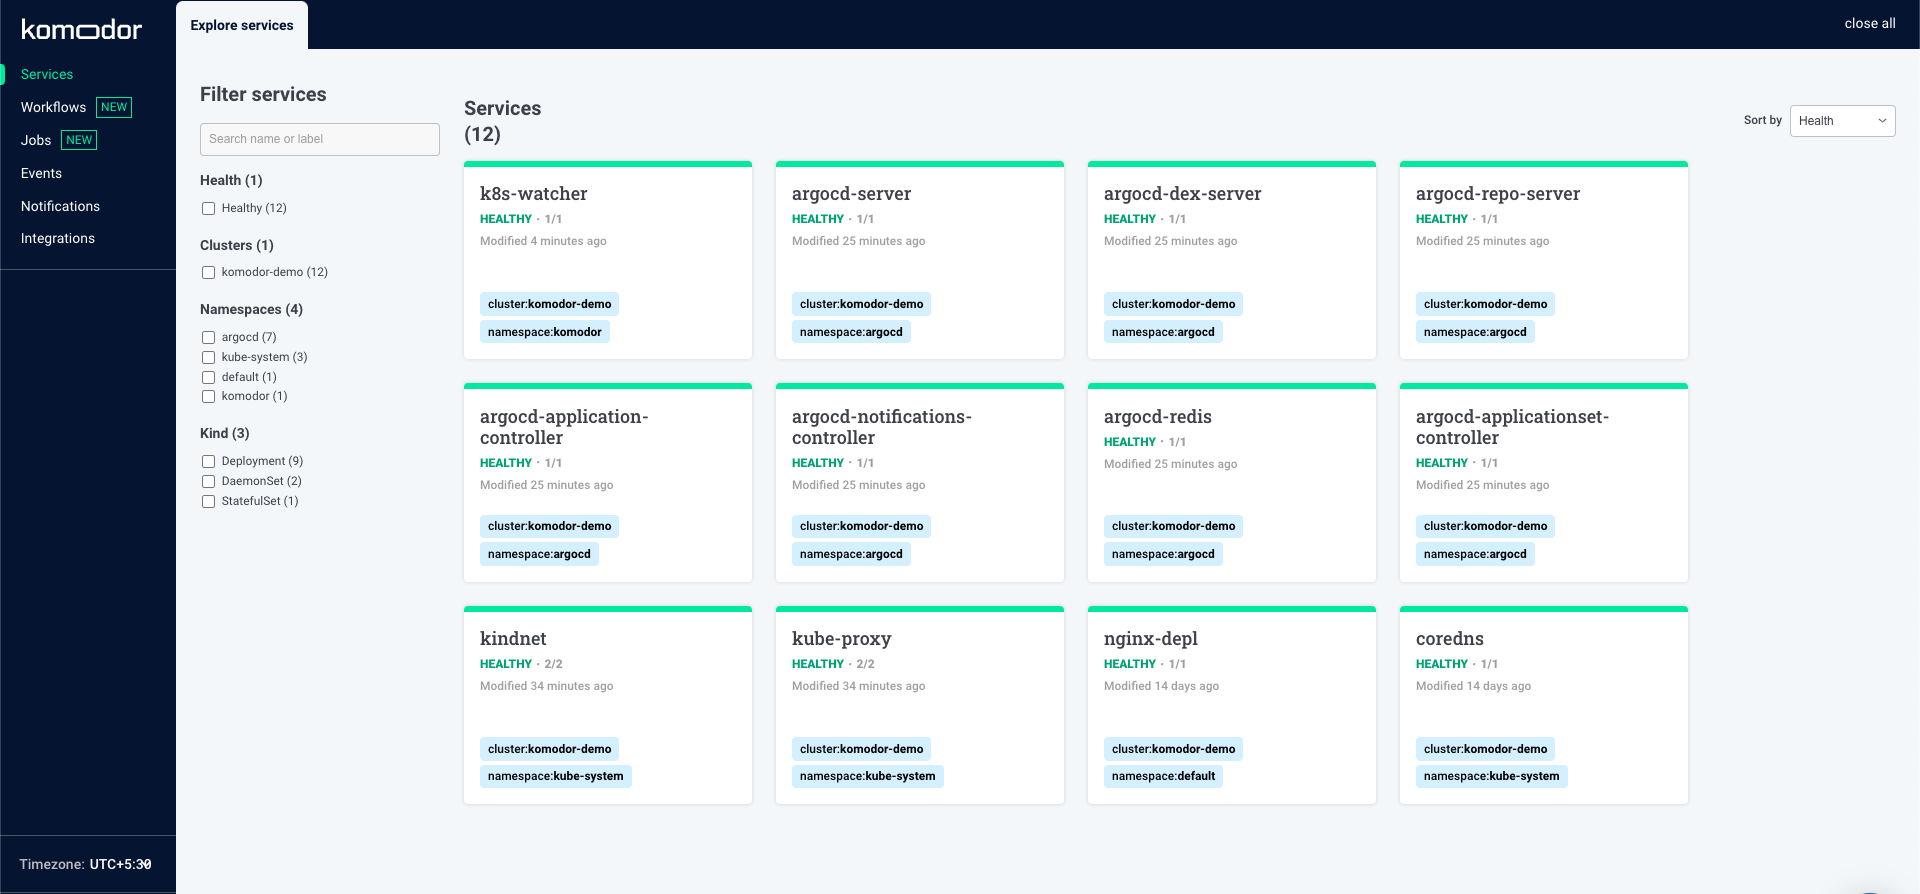
User Interface & Ease of Use
The user interface of the tool is quite intuitive, simple, and self-explanatory. Major sections of the tools are arranged under a list of tabs, including services, jobs, events, alerts, and more. The events page carries a lot of information about the various events occurring in your clusters but organizes it well to avoid visual noise.
The integrations and notifications section both concisely list out the relevant data making it easy for you to get started as well as view old data easily.
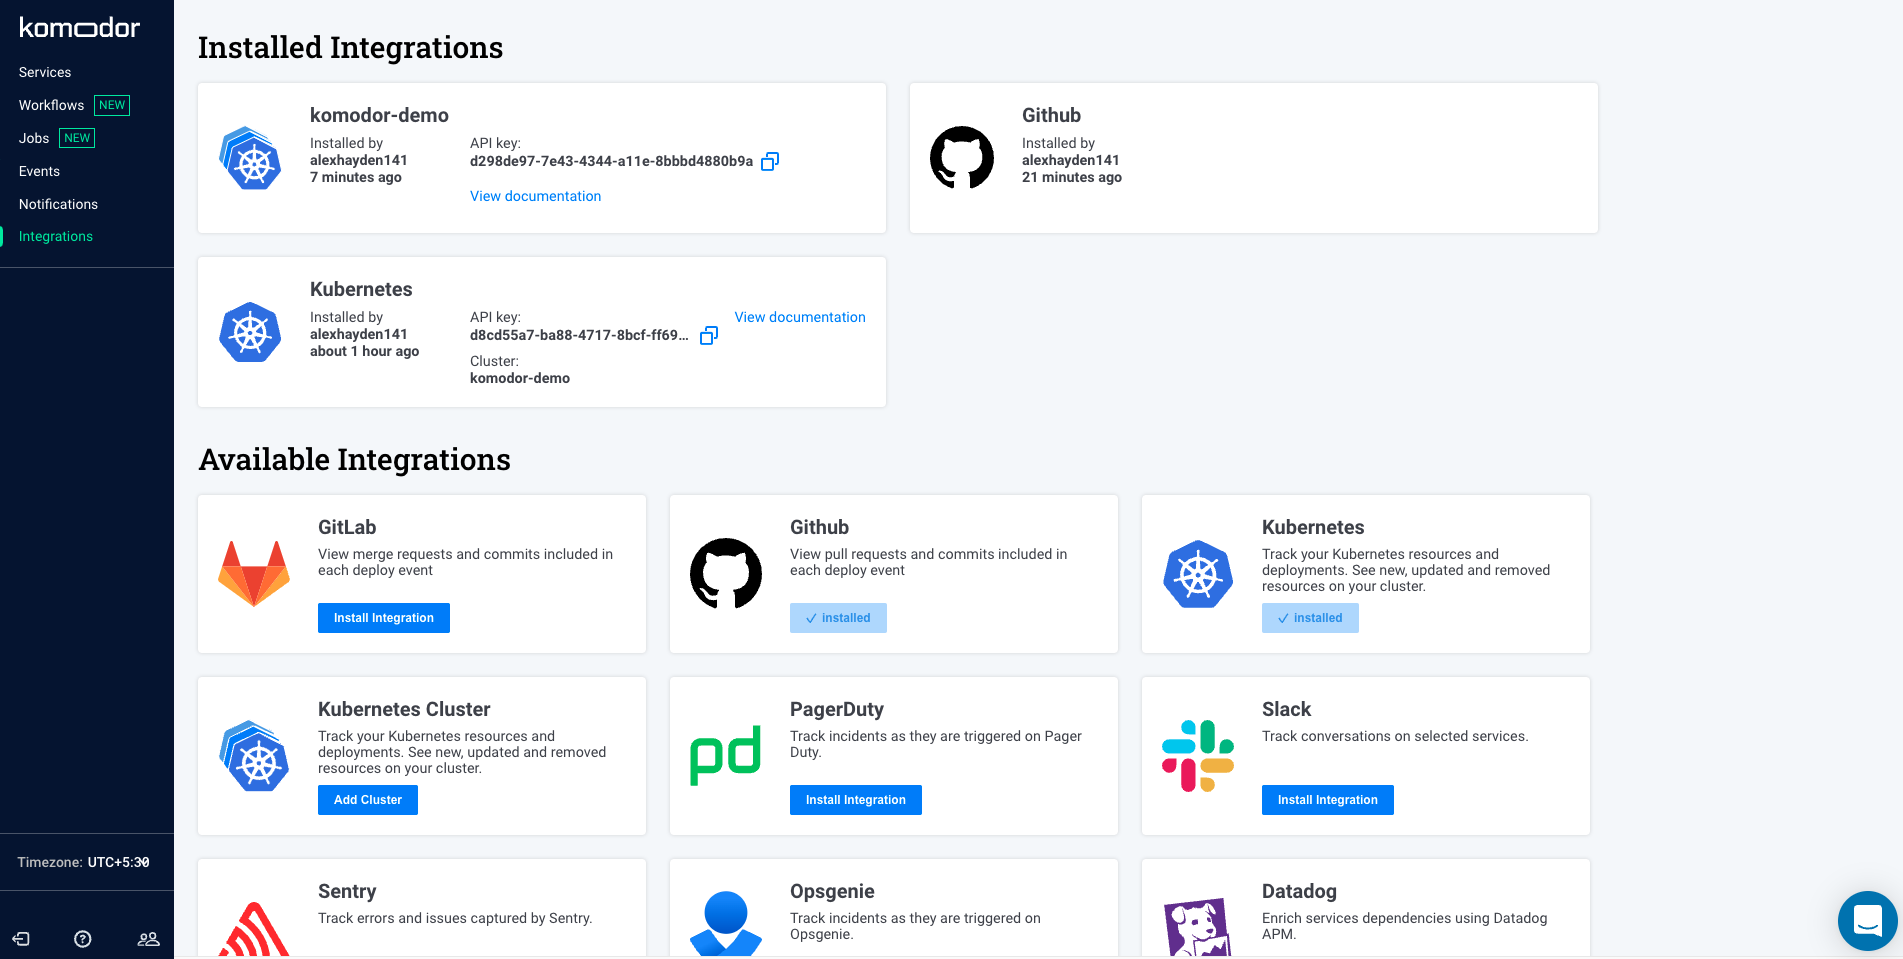
Third-party integrations
Komodor offers a limited range of third-party integrations to help make your life easier. You can easily set up your Kubernetes cluster, link its repo, and connect to a Slack channel for sending out event-related alerts. You can also connect with other tools like Sentry, OpsGenie, DataDog, etc., for incident management.
Pricing
Komodor’s pricing is simple and straightforward. There’s a plan called Team that offers support for up to 250 nodes, for $10 per node per month. If your workload is greater than that, you can set up a call with them to discuss your pricing.
They also offer a fully functional free trial to understand and experience the tool in your projects before making a commitment. You do however need to book a demo with a member of the team before activating your trial.
Why should you use Komodor?
There are a number of reasons why you should use Komodor for native Kubernetes troubleshooting.
Easy to get started with
Given that Komodor is a full-fledged troubleshooting tool for complex Kubernetes clusters, it is quite simple to get started with. The installation process is simple, and it automatically generates the commands you need to get started.
The UI is quite intuitive, and you can easily find your way around it. There are a number of guides and tutorials to help you get going once you’re set up.
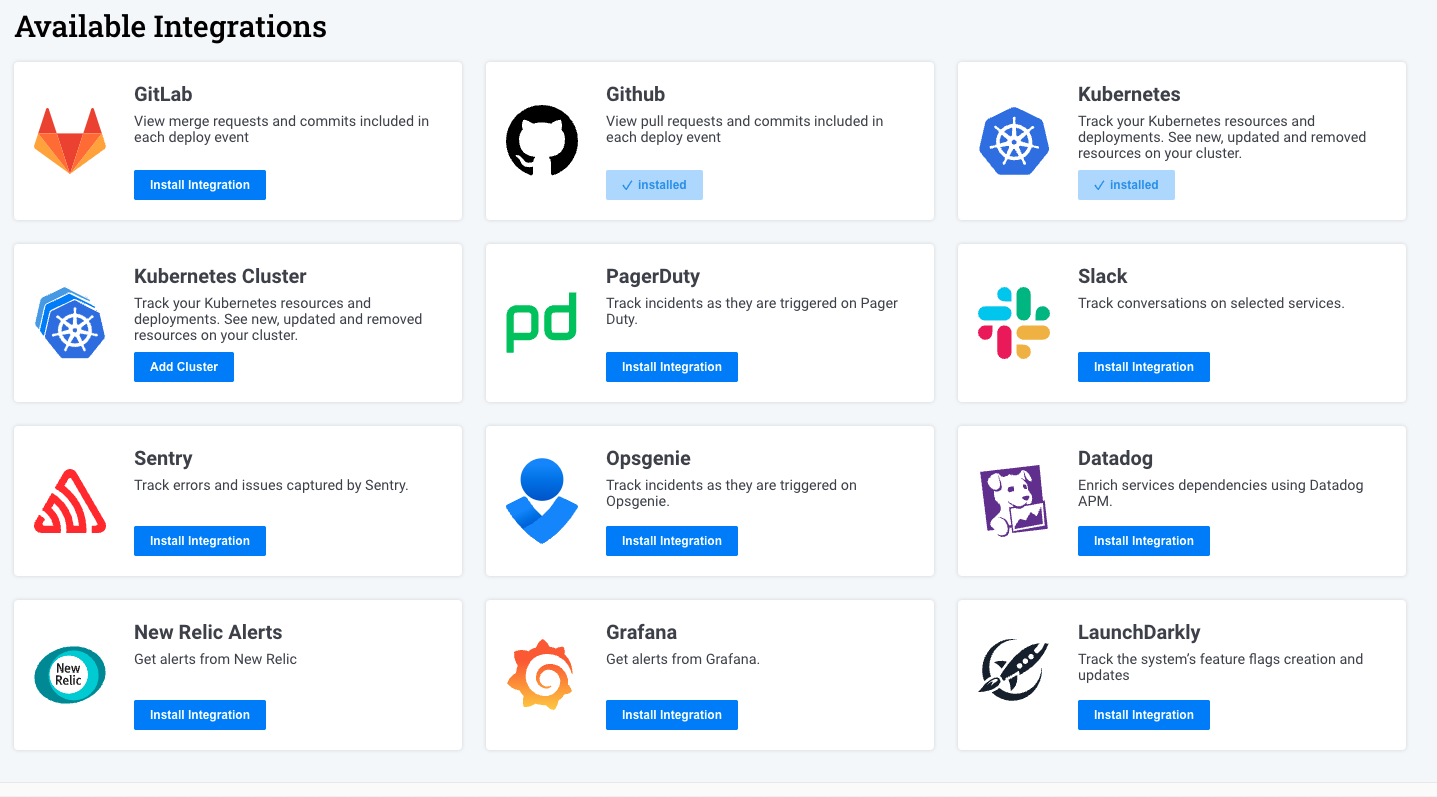
Third-party integrations
One of the largest selling points of Komodor is that it offers integration with a wide array of third-party software. You can connect your code hosting provider, such as GitHub or GitLab, to generate code-level annotations automatically. If your team uses a dedicated tool for incident management such as PagerDuty or OpsGenie, you can have Komodor send incident details to them directly.
You can also set up alerts via New Relic or send them directly into your Slack channels. Komodor integrates with Grafana easily to create simple visualizations. All in all, signing up for Komodor will keep you well-connected with the rest of your tech stack.
Cost and consumption optimization
Komodor enables you to build a comprehensive view that includes details about relevant deploys, configuration changes, service alerts, and more. The biggest benefit of using a troubleshooting tool such as Komodor is the cost optimization that it brings with itself. With regular updates on the downtimes of your cluster’s services, you can fix them to help reduce the impact on your end-users.
3 alternatives to Komodor
If you are unsure if Komodor would be the right fit for your K8s app, consider giving it a try with its 14-day free trial. If things don’t work out well, fret not! Here are a few other tools you could consider to replace Komodor.
Weave Scope
Weave Scope is another example of a well-designed K8s troubleshooting tool. It automatically generates infrastructure topologies from your clusters, helping you to find performance bottlenecks quickly.
Weave Scope is deployed as an independent app on your local machine or on your server. You can also opt for a SaaS version of the tool from Weave Cloud. Its pricing is quite simple as well; you can use the free version for basic features such as reconciliation loop and simple profile bootstrap, or opt for a custom pricing by discussing with the team.
Some of the major benefits of using Weave Scope are:
- Powerful search capabilities
- Intuitive and interactive display of your cluster’s statistics
- Support for plugins to generate custom metrics
Kubeeye
As stated on its readme page, KubeEye is an audit tool for Kubernetes to discover Kubernetes resources, cluster components, cluster nodes, and other configurations. It is an open-source tool that you can integrate in your DevOps workflow easily.
The installation process is quite simple: download pre-built executables from releases and run it! You can use KubeEye to:
- Audit cluster resources and ensure best practices are followed.
- Find problems in your cluster control plane.
- Detect various types of node problems, etc.
PowerfulSeal
PowerfulSeal is a chaos engineering tool used for stress and resilience tesing of Kubernetes. It works on the concept of chaos engineering by introducing failure into a subset of the running resources and observing if the system can still function properly.
PowerfulSeal allows users to create and store scenarios in YAML. You also get an interactive editor with auto-complete support. It is an open-source tool that you can install using pip and run directly via your local machine or on your clusters. It offers well-detailed documentation.
Final thoughts
Komodor is a popular K8s-native troubleshooting tool. With its easy setup and seamless user experience, you can get started with it right away. It offers deep insights into your Kubernetes cluster and its components. You can drill deep into an event’s details to gain more insights.
Komodor offers a simple pricing plan for teams of all sizes. However, it still feels like there is a lot of room for growth for the tool. Finding and editing Kubernetes cluster integrations in the tool can be a hassle at times. If you do not have the bandwidth to build and maintain an internal tool for troubleshooting your K8s clusters from time to time and are looking for a SaaS alternative, Komodor might be just the right tool for you.
If you're looking for an even easier way to monitor and troubleshoot your clusters, check out Airplane. With Airplane, you get a maintenance-free platform that makes it easy to build custom internal tools using code. You can build Tasks, which are functions that anyone on your team can use, or Views, which are React-based custom UIs. Airplane is code-first: everything you build can be version-controlled, integrated with the rest of your codebase, and extended using third-party libraries.
To try it out, sign up for a free account or book a demo.