Many organizations use sales/customer analytics dashboards to track business trends and make informed decisions. These dashboards increase visibility into sales and product performance and can help teams identify new opportunities for growth. One platform that is utilized by many organizations to build sales/customer analytics dashboards is Django.
Django is a web framework written in Python that allows users to swiftly create web applications from scratch. Django provides features such as templates, integrated authentication and authorization, and more. The Django admin site is a built-in web interface that allows specific users, such as website administrators, to perform create, read, update, and delete (CRUD) operations on Django models. All of the models, users, groups, and permissions in the Django application may be accessed through this web interface.
The Django admin interface is used to create and manage content on websites, manage user accounts and permissions easily, and moderate user-generated content like reviews, comments, and feedback. Django admin is also flexible, providing multiple ways to customize layouts and functionality by integrating with other apps or using custom scripts. To learn more about Django admin, check out our Django admin crash course article.
This article explores how Django admin can be used to build a sales or customer analytics dashboard for web applications. We'll walk through creating custom views and URL patterns in Django admin and also look at overriding default admin templates and views to display analytics charts.
What Is Django admin?
Django admin is a powerful tool that provides a built-in web interface for managing the backend of a Django-based web application. This intuitive and efficient interface is designed to make it easier for administrators and developers to manage the application's data without having to write custom code. The admin panel is based on the popular Python framework Django and is automatically generated based on the models defined in the application.
The modularity of Django admin makes it adaptable, allowing users to configure the interface and display only the features needed. It also offers a wide range of features, such as a user-friendly interface, built-in search and filtering capabilities, and the ability to add, edit, and delete records. Additionally, Django admin comes with many tools and utilities, such as database backups, logging, performance optimization, and much more.
Django admin provides a great way for administrators and developers to quickly and easily manage their web application's data and settings.
Implementing a sales/customer analytics dashboard using Django Admin and Highcharts
Let's now walk through the process of building an analytics dashboard to showcase user demographic data within Django admin. We'll explain how to set up a basic Django project, use highcharts.js to extend the admin views and display a user analytics chart, and override the default admin URLs to render the chart.
Prerequisites
Before proceeding with the tutorial, make sure you have the following:
- Familiarity with Python, which is essential for creating and running Django projects
- Familiarity with pip, Python's built-in dependency manager. This is required for the installation of third-party code in the application
- Django 4.1, which is used in this tutorial to create apps
- Working knowledge of Django and Django admin
- The Highcharts library, which is necessary for representing the charts in the dashboard. This tutorial uses the
highcharts.jslibrary by downloading it locally. To do this, visit this link and press Ctrl+S on a Windows computer or Cmd+S on a Mac to save the file to your computer. This file will function as a static asset in your Django application
Setting up the project
Creating new Python projects in a virtual environment is a great way to keep the project's dependencies separate from the system's dependencies.
Open the terminal and type the following command to create a new virtual environment using venv:
After running the above command, we must activate the virtual environment to isolate the dependencies and packages required for the project from the system's dependencies.
To activate a virtual environment, run env\Scripts\activate on Windows or source venv/bin/activate on Mac/Linux.
Once the virtual environment has been activated, install the required packages using the pip package manager. To install django and django_countries, run the following command:
This will install the latest versions of django and django_countries in the virtual environment. Note that the django_countries app provides a list of countries in the model that will be used in the user demographics dashboard. If you prefer not to create a Django app from scratch, you can use this starter code to set it up.
After installing Django, create a new project using the django-admin command line tool shipped with the Django framework. In the same terminal, run the following command:
The above command creates a new Django project named core and an app named ecom. The . after core tells Django to create the project in the same directory.
Once the project and app are created, let's add configurations to the core/settings.py file.
Open the file in the code editor and make the following changes:
This adds ecom and django_countries to the INSTALLED_APPS so that Django can discover them.
Adding the designated directory to the DIRS setting within the Django project's configuration is recommended using the following:
Additionally, the settings for static files need to be configured to ensure that Django is able to locate and serve any static files (such as JavaScript, CSS, or images) referenced within the templates. To accomplish this, add the following code at the end of the project's configuration file:
In the above code, the AUTH_USER_MODEL setting is configured so we can make a custom user in models.py. The COUNTRIES_ONLY setting is specific to django_countries and limits the choice of the countries in the model.
Let's now create templates and static directories at specific locations to match the settings.py file. Create a directory named templates in the ecom app directory. Inside this directory, create a template named user_analytics.html. Then, create a static directory in the project folder to house the highcharts.js file that we downloaded in the previous section.
After creating the files, the directory structure should look as follows:
Defining the Django models
In Django, a model is a Python class that defines the fields and behavior of the data stored in the database. For this application, we'll create three models: User, Product, and Order.
Open ecom/models.py and enter the following code to set up the models:
Once the models are set up, open the terminal (with virtual environment activated) and run the following command:
The above command creates migrations of the newly created models, then creates a SQLite database with those tables and fields.
To view these models on the admin site, register them in the ecom/admin.py file using the following code:
After creating admin configurations, we must create a superuser account in order to log in to the Django admin site:
After running the above command, Django will ask us to enter the username, email, and password that will be used to log in to the admin site.
Once those have been entered, use the following command to run the project on the built-in Django server:
With the server running, visit http://127.0.0.1:8000/admin/ and log in to the site to view the admin dashboard. From here, we can add users, products, and orders to the database. Alternatively, we can get the starter code in this GitHub repository with an already-populated database.
After the above steps, the Django admin dashboard should look similar to the following screenshot:
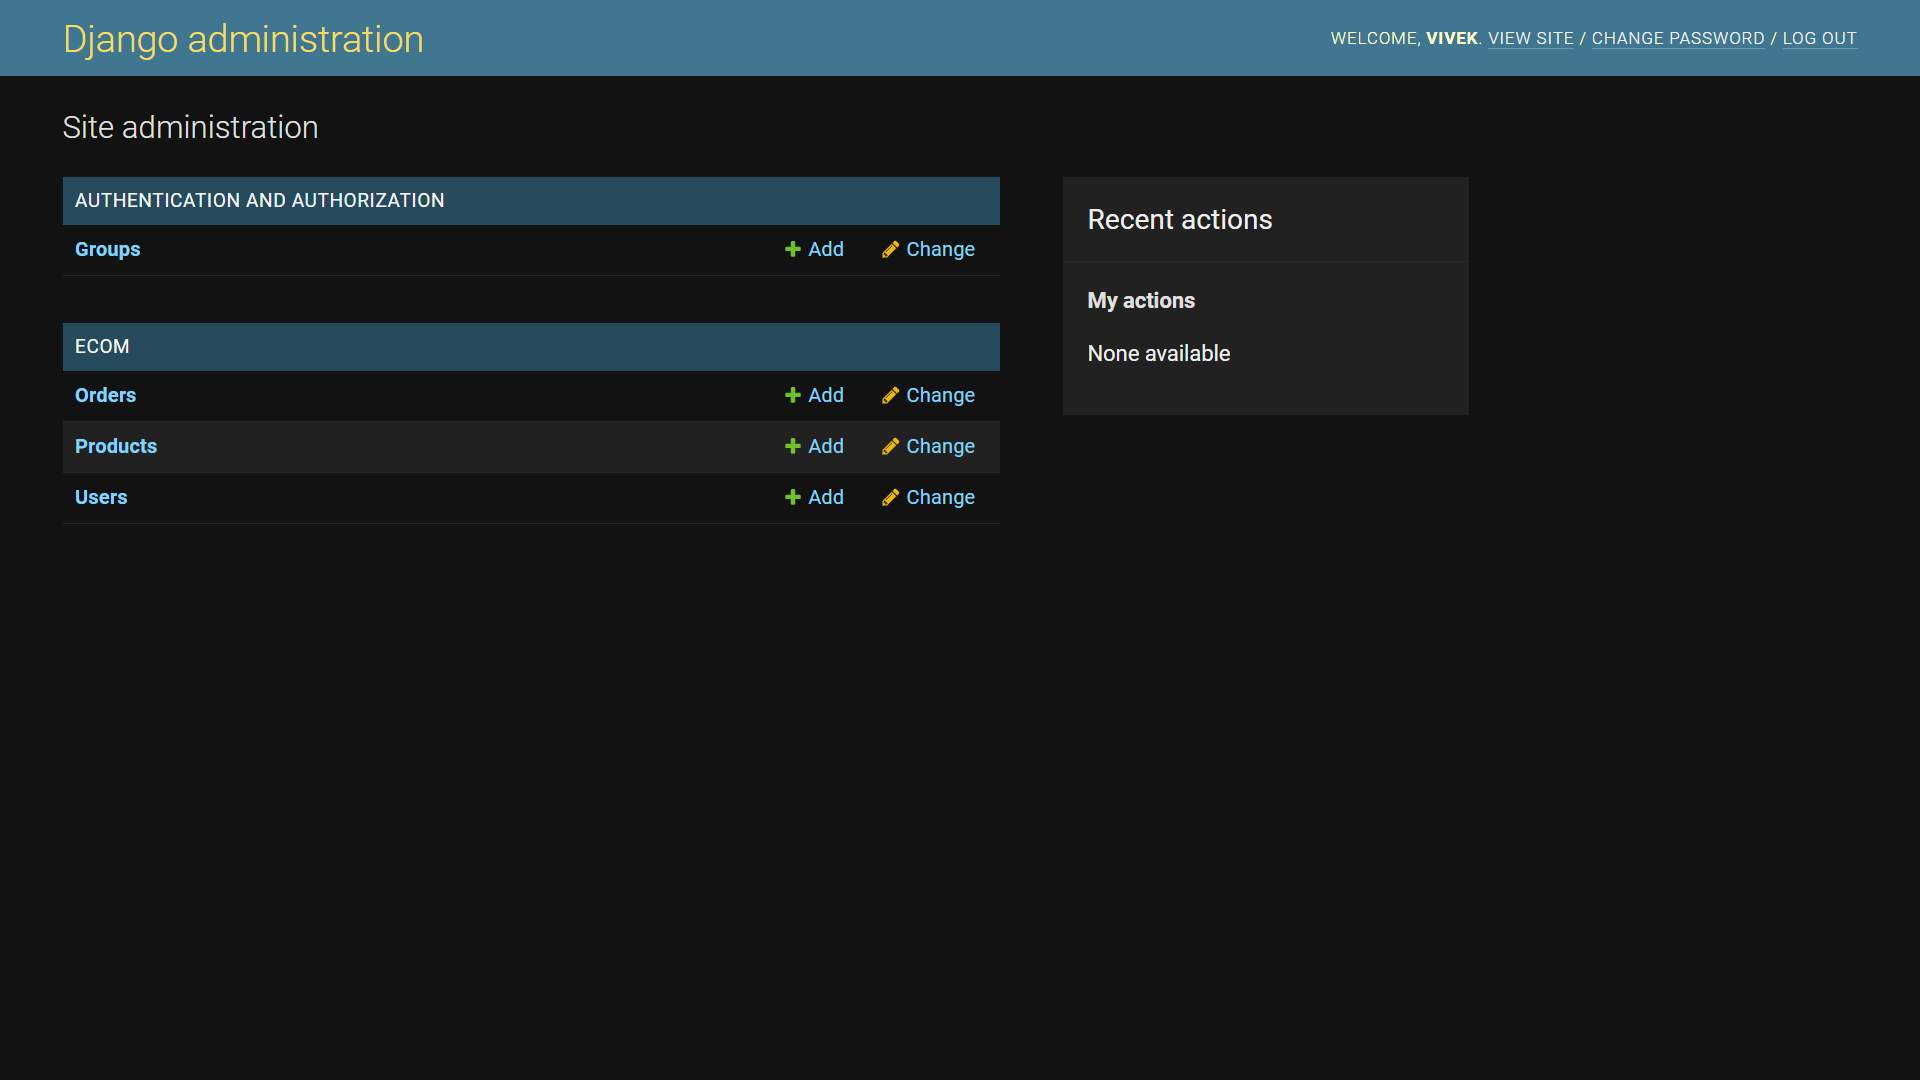
In the next section, we'll make changes to this admin dashboard to show sales and customer analytics.
Creating the admin views
In Django, the admin views are automatically generated based on the models defined in the application. These allow users to perform tasks such as creating, reading, updating, and deleting records in the database. We can extend the functionality of these views by extending ModelAdmin and creating our own views.
To add a custom analytics method to the admin view, open the ecom/admin.py file and add the following code to the CustomUserAdmin class defined in the previous section:
This method takes a single argument, request, which is an HttpRequest object. The method is responsible for generating analytics data for the User model. The method starts by using the values_list() method to retrieve the country field for each user from the database. It then uses the annotate() method to count the number of users for each country and the order_by() method to order the data by country.
Next, it uses the Country class to convert the country codes to country names and creates a list of those countries. It then creates a list by extracting the user count for each country. Finally, it uses the render() function to render a template called user_analytics.html and passes in the context data, which includes the countries, data, and title. This template is responsible for displaying the analytics data in a user-friendly format.
Creating the custom admin URLs
After defining the view, let's create a corresponding URL that instructs this view to load. We can create a URL in the same admin view by overriding the get_urls() method. The get_urls() method is a built-in method in the ModelAdmin class, which is the base class for all admin views (UserAdmin in this case) in Django. It's used to define the URLs that the admin view should respond to. The get_urls() method returns a list of URLPattern objects that the admin view should handle.
Add the following code to the CustomUserAdmin class to instruct the admin view to add the custom URLs:
In the above code, we override the get_urls() method in the ModelAdmin class, which is used to define the URLs that the admin view should respond to. It starts by calling the parent class's get_urls() method, which returns a list of URLPattern objects that the admin view should handle. These URLPattern objects represent the default URLs for the admin view. Then, it imports the path method from the django.urls module, which is used to create a new URLPattern object for a custom URL.
It then creates a list called custom_urls that contains a URL pattern and the view that should handle the URL. In this case, the URL pattern is analytics/ and the view is self.analytics, which is a custom method defined above.
Finally, it concatenates the custom_urls list with the list of URLs returned by the parent class' get_urls() method and returns the result. This means that the admin view will now handle the new URL analytics/, and when this URL is accessed, it will call the analytics method on the admin view. It's important to note that when overriding the get_urls() method, the parent class' get_urls() method should be called first so that the default URLs are still handled by the admin view. This way, we can add custom URLs without losing the default functionality.
Creating the custom admin templates
Once the view and URL are set up, let's work on the templates.
Open the ecom/templates/user_analytics.html file and add the following code, which is a Django template for the admin interface:
This template extends the admin/base_site.html template, which is the base template for the admin interface provided by Django. The template starts by using the {% extends 'admin/base_site.html' %} template tag to inherit the structure and layout of the base template. The next line, {% load static %}, is used to load the static template tag library. This library allows us to reference static files like CSS and JavaScript in the templates. In this case, we can load the Highcharts library that was saved in the previous section.
The template also defines two {% block %} template tags, nav-global and content. A block is a section of a template that can be overridden by child templates. The nav-global block is used to add a new navigation link to the admin interface. In this case, the link with the text "Show User Data" links to the /admin/ecom/user URL.
The content block is used to add content to the admin interface. In this case, the content includes a <script> tag that references the highcharts.js file, which is a JavaScript library for creating charts and graphs. It also includes a <div> element with an id attribute of container-chart, which is the style attribute that sets the width, height, and margin of the <div>. The <div> element will be used to display user analytics data.
Adding a chart script to the template
To effectively visualize user demographic data, a variety of chart types can be utilized. In this tutorial, we'll use the column chart format provided by Highcharts.
Creating a chart using Highcharts involves selecting a chart type that best suits the data, then copying and pasting the generated code into the relevant template. Specifically, the chart code can be accessed by selecting the desired chart type and clicking the VIEW OPTIONS button. This will open a dialog box containing the complete chart code, which can then be copied and included in the template inside a <script> tag.
After copying this code, refactor the template's content block like this:
The script starts by using the DOMContentLoaded event to ensure that the chart is rendered only after the DOM is fully loaded. It then creates a column chart using the Highcharts library. The chart is rendered on a container element with the ID container-chart and uses data passed from the template to set the chart's x-axis categories, y-axis series, and chart title.
Rendering a chart in the admin dashboard
Now that the templates, views, and URLs are set up, let's start the server to see the customer analytics chart in action.
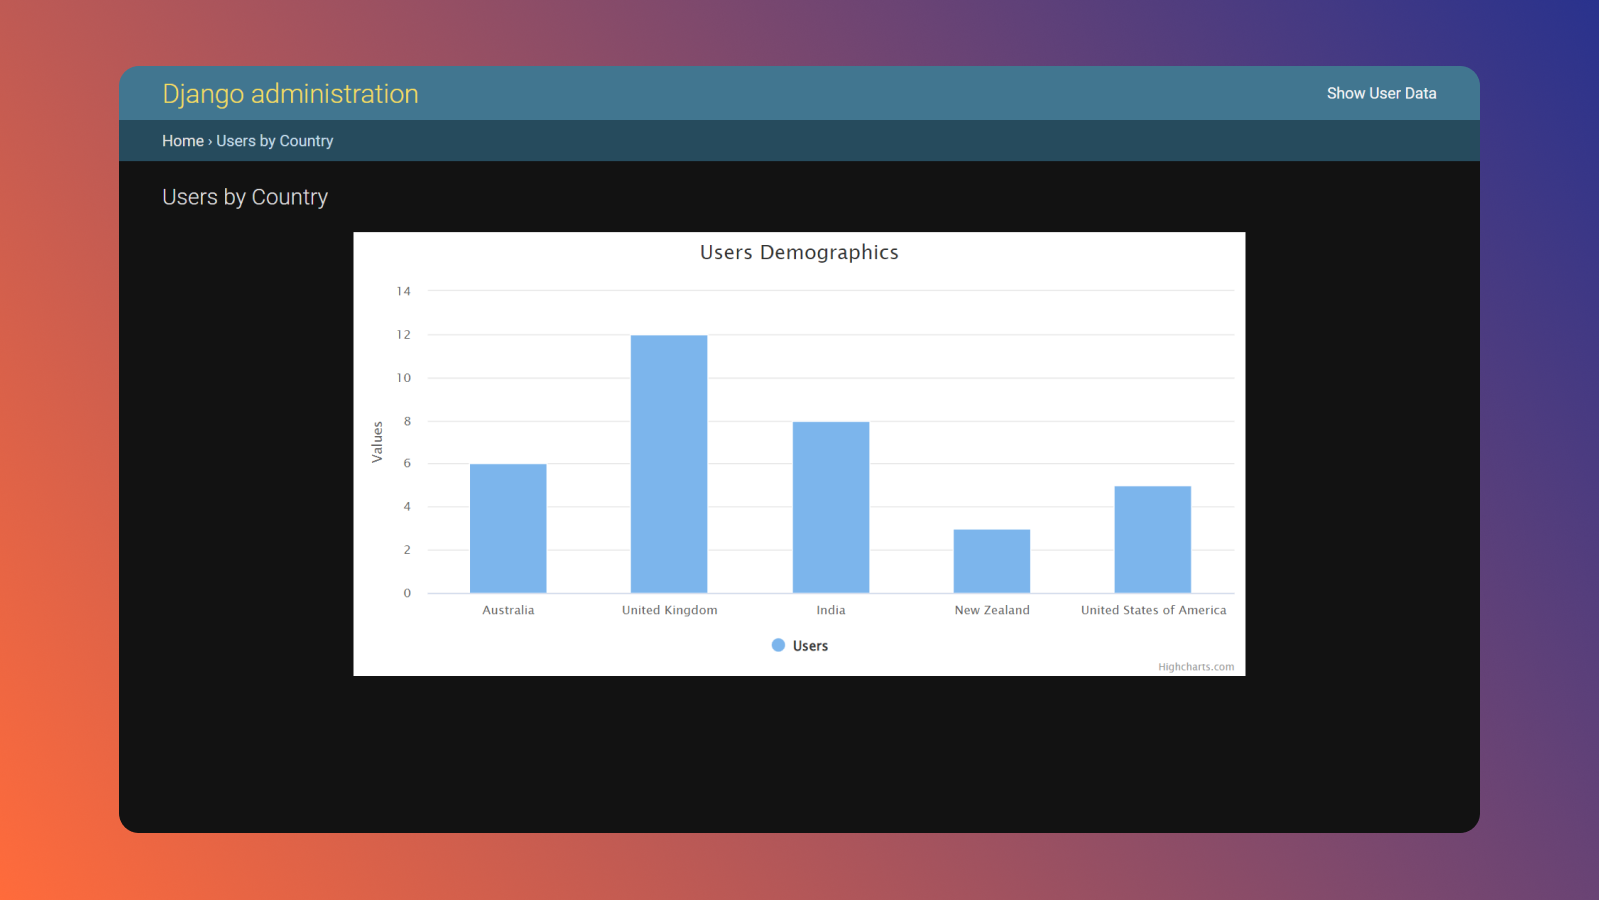
Open the terminal and run the python manage.py runserver command to start the Django server. Once the server is up and running, visit http://127.0.0.1:8000/admin/ecom/user/analytics/ to view user demographic data:
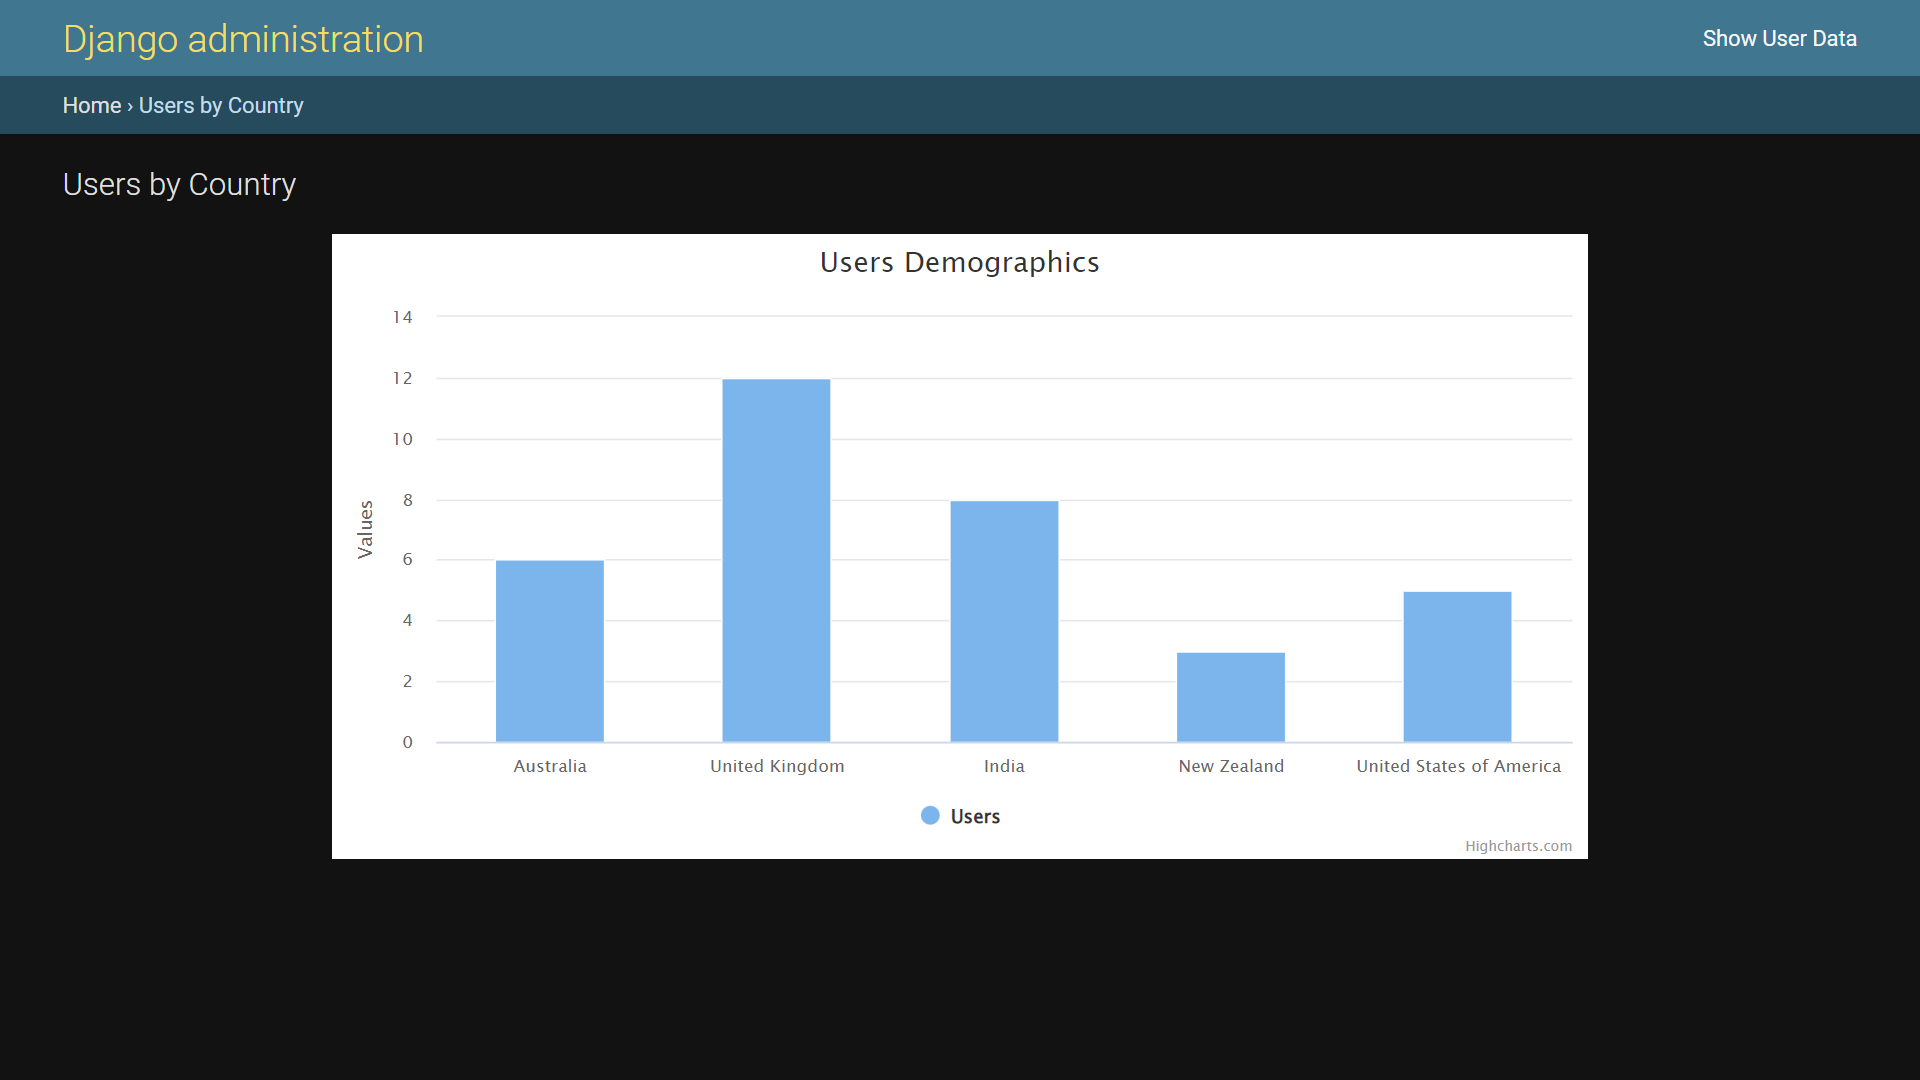
In the above image, we see that the /analytics URL invokes the analytics() view, which is responsible for generating the necessary data for the user demographics chart. This data, consisting of the countries and corresponding user count, is then passed to the relevant template for rendering the chart using the Highcharts library. With the use of this library and the data passed from the analytics view, the user demographics chart is generated, providing a clear and comprehensive representation of the data.
Customizing charts using the Highcharts API
The Highcharts API is known for its high level of customizability, which allows developers to easily create charts that match their specific design requirements. The library provides a wide range of options and configurations that can be used to customize the appearance, behavior, and data of the charts.
In this section, we'll customize the user demographics chart to make each column a different color using the Highcharts API. This customization can be achieved by adding one line in the chart.series section.
Open the ecom/templates/user_analytics.html file and write the following code in the Highcharts configuration script:
After adding the colorByPoint variable, refresh the http://127.0.0.1:8000/admin/ecom/user/analytics/ page to see the output.
This is just one of many options for customizing the look of the chart. You can find the full list of Highcharts API customization options here.
Testing the custom admin
Django makes testing easy by providing a built-in testing framework and tools that allow developers to easily write and run tests for their applications.
Let's test the above custom admin functionality by adding the test cases to the ecom/tests.py file:
In the above code, the CustomUserAdminTest class inherits from django.test.TestCase and creates an instance of the Client class, which allows it to simulate requests to the application. It also creates an instance of a user to be used in the test.
The setUp method is called before each test method is executed. It creates a client object and an instance of the user model. The first test method, test_analytics_view, tests the analytics view. It creates a GET request to the analytics URL using the reverse function, which returns the URL for the given view name. It then asserts that the status code of the response is 200, which indicates that the request was successful. It also asserts that the response contains the expected text.
The second test method, test_get_urls, tests the custom URLs that are added by the get_urls method. It creates a GET request to the analytics URL and asserts that the status code is 200, indicating that the request was successful and that the correct template is being used.
The above Django tests provide a thorough and effective way to test the functionality of a custom admin view and its URLs. This helps to ensure that the code is working correctly and is less prone to errors, making the development process more efficient and reliable.
We can run the tests by opening the terminal and running the following command:
This command initiates the testing processes by searching and executing methods found in the tests.py file. After running the tests, Django should return the output "OK", which means all the tests were successful.
And that's how you build a sales/customer analytics dashboard using Django admin. Although many organizations use Django to build dashboards, there are limitations. Complex customization and special functionalities can be time-consuming and challenging to implement, setting permissions is tricky and complex, and Django's monolithic nature means developers cannot use their own file structures.
Luckily, there is an option that offers a quick and easy way to build sales/customer analytics dashboards securely.
Airplane: An alternative to Django
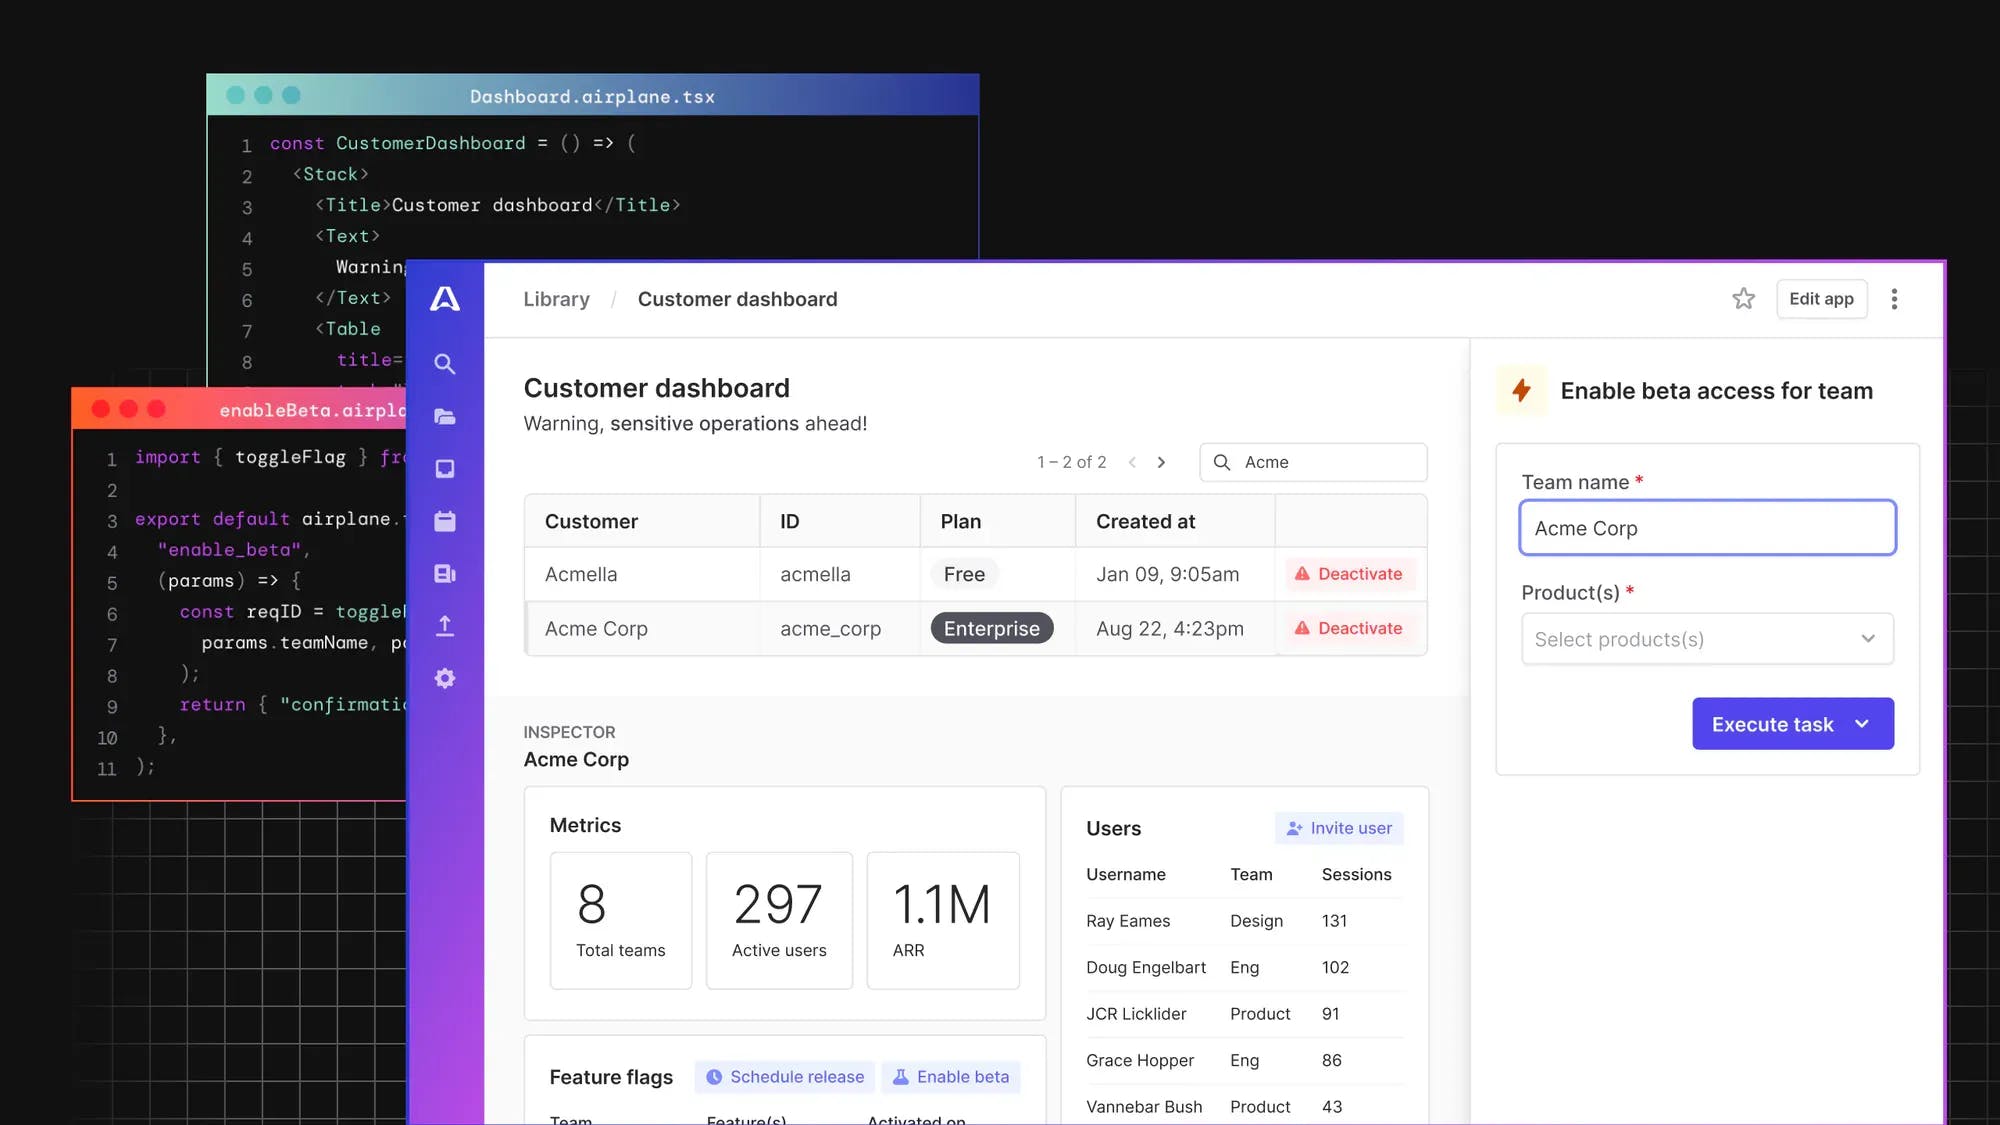
Airplane is a developer platform for building custom internal tools. Users can transform queries, scripts, APIs, and more into powerful tasks and UIs within minutes using code. The basic building blocks of Airplane are tasks, which are single-step or multi-step functions that anyone on your team can use. Airplane Views allows users to quickly build custom dashboards and UIs in under 15 minutes.
Unlike Django, Airplane allows users to easily create custom components and manage permissions. This makes the dashboard creation process easier while maintaining a high level of security. Building a sales/customer analytics dashboard is easy using Airplane with its extensive pre-built component library and template library.
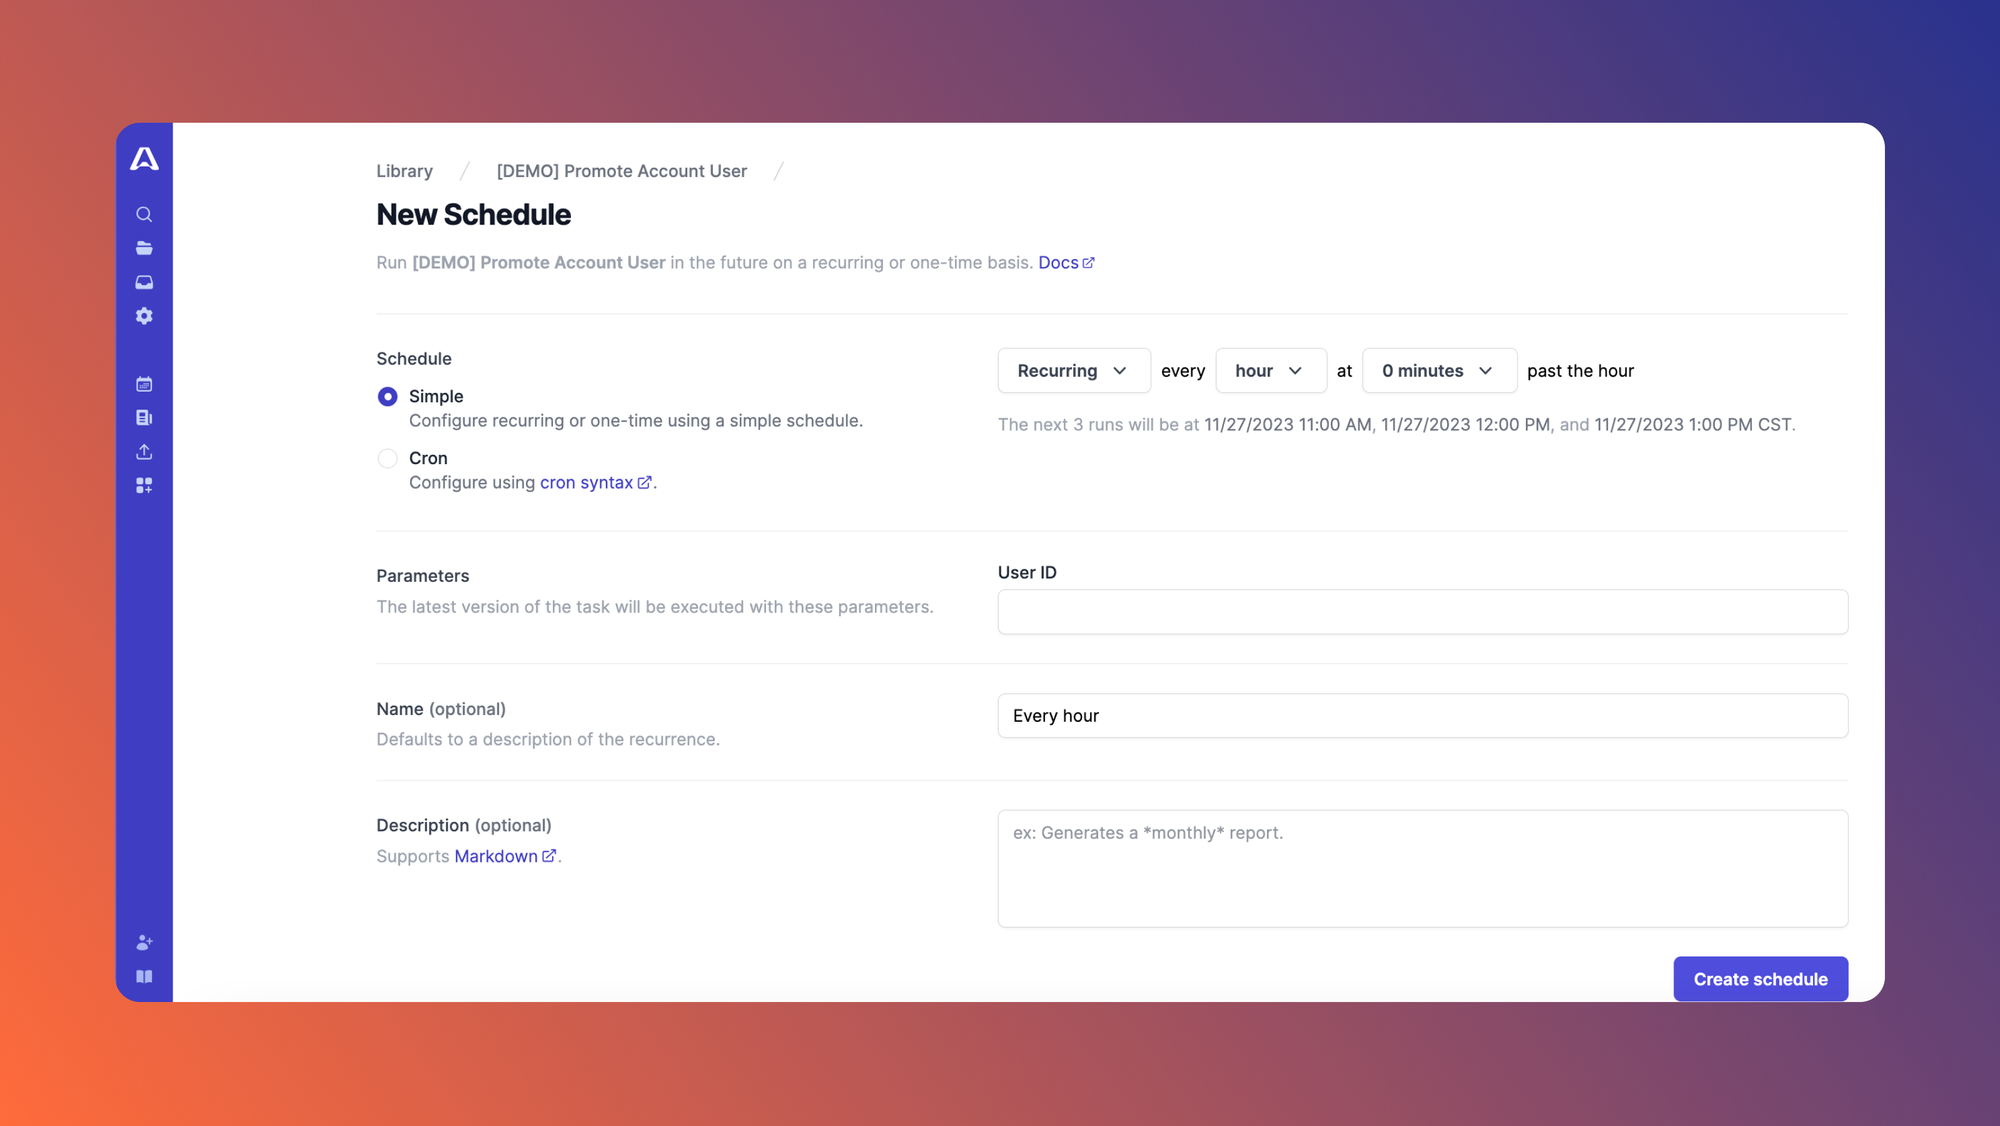
Airplane also offers strong out-of-the-box capabilities for users. These include approval flows, task scheduling (which replaces cron), and more.
Airplane makes it easy for users to build and customize robust dashboards to fit their needs. If you're looking for a code-first, customizable, and secure platform to build robust sales and customer dashboards, then Airplane is a great fit for you. For more information on dashboards, check out our blog for content such as React JS tutorial, ngx-admin in Angular tutorial, and more.
If you'd like to test out Airplane and build a dashboard in minutes, sign up for a free account or book a demo.
Author: Vivek Singh
Vivek Singh is a Python/Django developer. He is always ready to learn and teach new technical topics to fellow developers.