One of the biggest issues with OpenTelemetry is the pain of instrumenting each microservice individually. At ContainIQ, we’ve been working on an innovative eBPF-based approach to alleviating this pain by automatically associating requests from one service to another. With this approach, we can keep the processing entirely in the kernel, avoiding the burden of handling every language and framework that the microservice uses.
In this article, we’ll walk through one of the two methodologies we’ve used to provide automated distributed tracing context propagation using eBPF. This article is one of a two-article series that explores both methods. Here, we’ll highlight our approach using metadata-based correlation. In the accompanying post, we'll discuss a second approach, which involves using uprobes to capture the necessary information.
Packet capture using eBPF
When using eBPF, capturing TCP packets without the need for instrumentation is relatively straightforward. For example, it can be accomplished by first attaching an eBPF-based program to all of the interfaces on each virtual machine (VM), and then either parsing the sk_buff in kernel or pushing it to userspace for further processing. Luckily, this process can be completely automated and requires no additional packages or instrumentation at the application level.
For example:
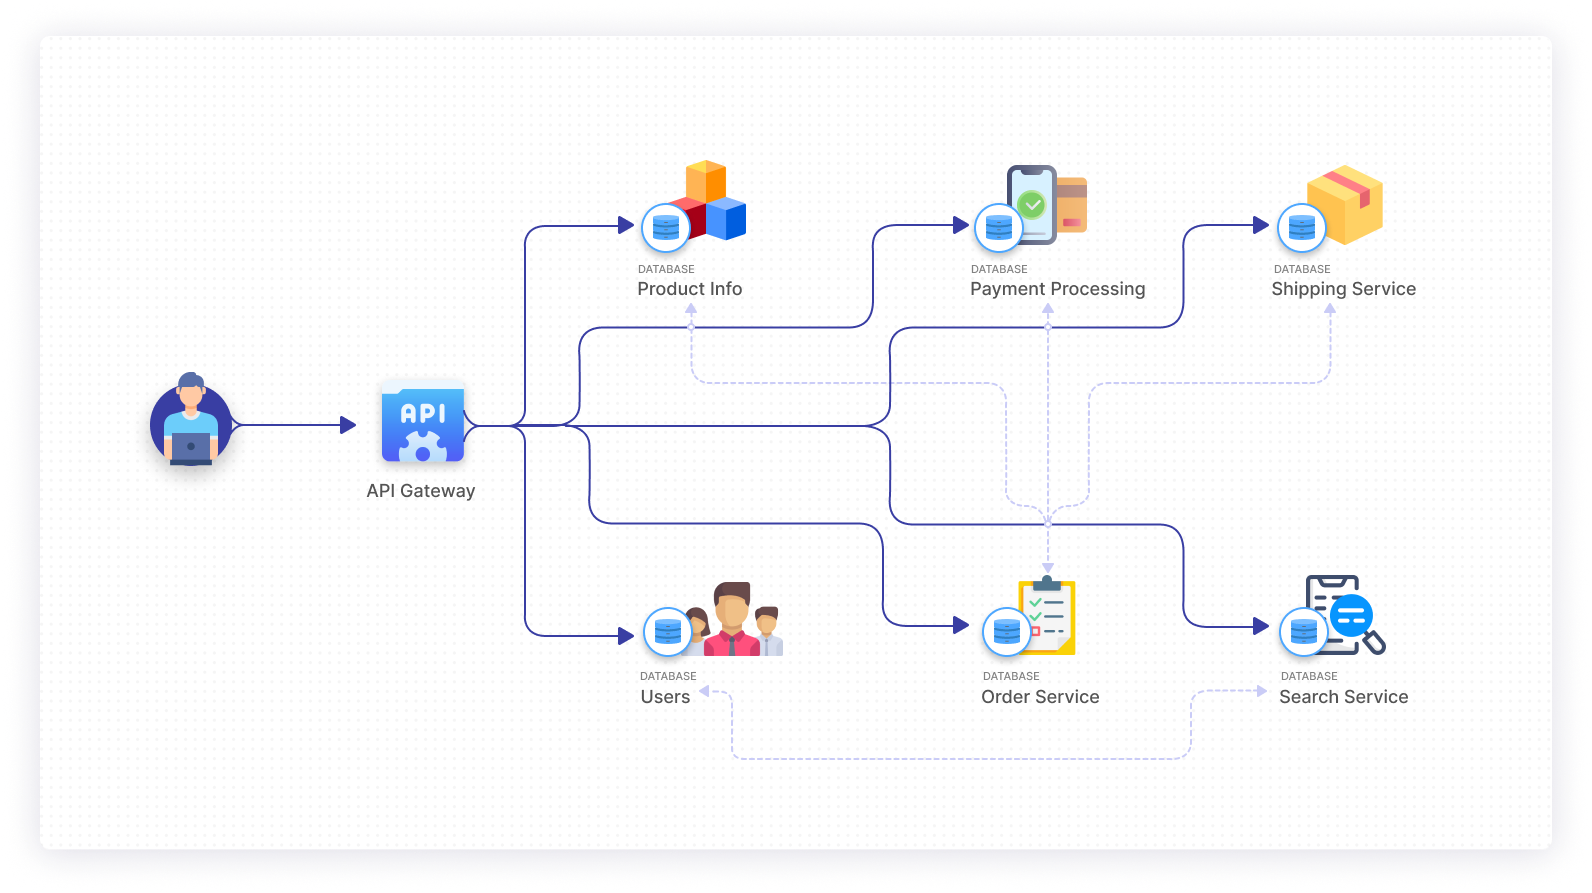
However, things get much more complicated when you’re trying to associate multihop requests, which is necessary in order to debug distributed microservice-oriented architectures.
For example:
We’re currently working on two solutions to this problem:
- Metadata based correlation that relies on information such as the five tuple, the threads reading from and writing to that socket’s file descriptor and other metadata surrounding the request: that’s the focus of this article.
- Uprobe correlation that hooks into the language-specific methods that spawn requests: that will be the focus of the second article in this series, which we’ll post in late October.
Approach #1: metadata based correlation
This idea was inspired by Google’s Dapper paper, which describes two techniques for record association:
- Annotation-based schemes
- Statistical regression techniques to infer the correlation
Most systems today use record-based association, but we wondered if by utilizing the correct eBPF probes and tracepoints we could collect enough data to infer the correlation without annotations.
The main pieces of metadata we need for these correlations are:
- Saddr
- Daddr
- Source port
- Destination port
- Socket file descriptor
- The writing process and thread
- The reading process and thread
- Start and end timestamps of each socket
- The node of the connection
- Size of data read/written by the process/thread on each socket
- New socket creation request
In essence, if we can see the thread reading from the file descriptor, we can then find the file descriptor of the socket that the thread subsequently wrote to while the original socket was open. The information from the five tuple is used to better track requests that span multiple nodes. In order to collect this metadata, we need to add kprobes to a number of the networking syscalls.
Note: some information on the code snippets below is omitted for brevity. There are also a few other versions of these syscalls that would need to be hooked for completeness.
The first step is to hook the accept and connect syscalls, to capture newly opened connections and start the timers:
The next step is to hook the send and receive network syscalls in order to capture the thread and process writing into that socket. In this step we are also capturing the stack trace. This allows us to provide the call history while the thread is writing into the file ultimately providing similar information to OpenTelemetry’s spans.
After this, we set the sockaddr values:
Finally, we need to get the timestamp when the socket closes. The simplest approach is adding a kprobe to the shutdown call, but a more comprehensive solution would leverage bpf_sock_ops in order to track the tcp state.
By adding the probes above and then parsing the information in userspace, we’re able to get an accurate idea of which requests spawned additional requests.
Illustrated as SQL
Drawbacks of metadata based correlation
Metadata based correlation works well when your entire system lives within your Kubernetes cluster. The largest drawback arises when requests leave the cluster. Say for example that one of your services sends a request to a lambda function and then that function makes another request. The correlation would be lost at this point. To combat this, we rewrite all requests leaving the cluster in order to add the necessary headers. This is accomplished by directly modifying the sk_buff during the packet capture.
In addition, socket reuse from keepalive connections can also cause issues, because multiple requests occur during the socket’s lifetime. Keepalive connections can be accounted for by tracking the total bytes written and adding timestamps for when each thread reads from or writes to a given socket file descriptor. Then when parsing the HTTP message in userspace, we can check for the keep alive header and, if it’s present, identify the kernel timestamp when the request occurred and match that with the corresponding thread timestamps.
The final drawback occurs when using asynchronous paradigms to spawn requests or applications not using a thread based approach to handle requests. Luckily our early tests show that utilizing the rest of metadata being captured and thanks to Kubernetes IP allocation scheme which guarantees 1 IP address per pod, in most cases, we are still able to correctly track the requests in the majority of cases.
Future improvements
In order to even better infer correlation among the different metadata that we are extracting, internally we are exploring the option of using a classification-based machine learning algorithm to improve the pattern recognition of the different requests across the chain of microservices.
Final thoughts
eBPF is a powerful technology, since it allows you to inject custom user-definition programs in the kernel without having to install additional kernel modules or recompile the kernel itself. By using eBPF, we can gather several pieces of information about the running processes/threads in every microservice without requiring any change to the original application. And in this article, we highlighted one methodology that we’re using to provide automated distributed tracing context propagation with eBPF. By using metadata based correlation, we enable users to capture distributed requests across different services, without the added step of instrumenting each microservice.
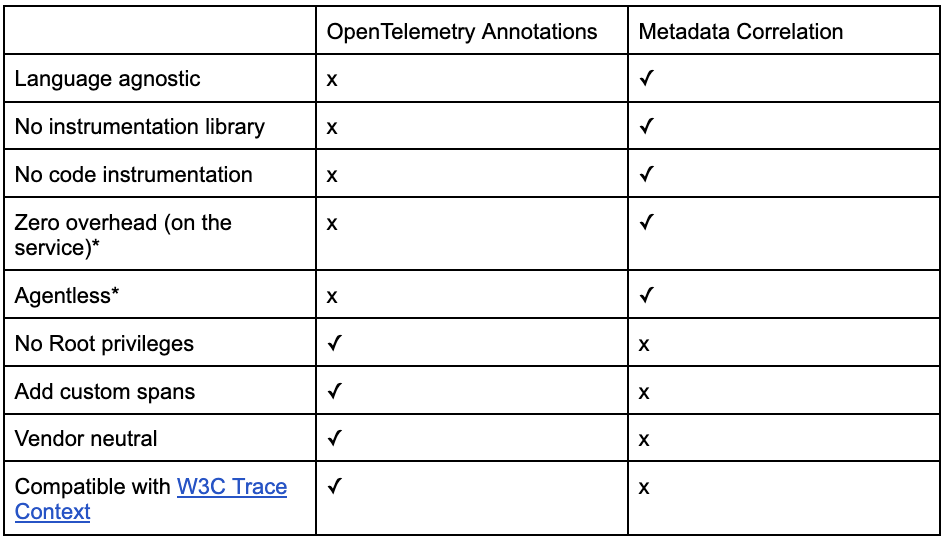
* The eBPF agent is “out of band” and in most cases can use leftover resources on the node. A further benefit is reducing sampling when encountering resource issues on the node.
* OpenTelemetry requires either an auto-instrumentation agent or code changes. Metadata correlation requires neither.
In the second article in this series, we’ll highlight the second methodology that we’ve pursued: uprobe-based correlation. If you’d like to be notified when this article is published, sign up for our newsletter.
If you're looking for an internal tooling platform that's code-first, then check out Airplane. With Airplane, you can transform scripts, queries, APIs, and more into powerful workflows and UIs. Airplane also offers strong defaults, such as permissions setting, audit logs, notifications, and more.
Sign up for a free account or book a demo and start building powerful internal tools quickly.