Kubernetes is a very powerful container orchestration platform. It uses multiple layers of resources to help you provide just the right experience for your end users. But tracking, managing, and visualizing that high number of resources working in sync can be difficult. This is where dashboards come in.
You’ve probably used the default Kubernetes dashboard before. And while that dashboard is great at providing a roundup of what’s happening in your clusters, it falls short when it comes to complex validation rules and markers. In this post, we’ll take a look at Kubevious, a powerful Kubernetes dashboard that focuses on empowering you when creating rules — and much more!
How does Kubevious work?
Kubevious aims to make it easy for you to understand your K8s resources. With features like custom validation rules and markers, resource correlation, and a time machine for analyzing changes over time, Kubevious has pretty much everything you’ll need to completely understand your Kubernetes resources. You can check out a demo of the tool here.
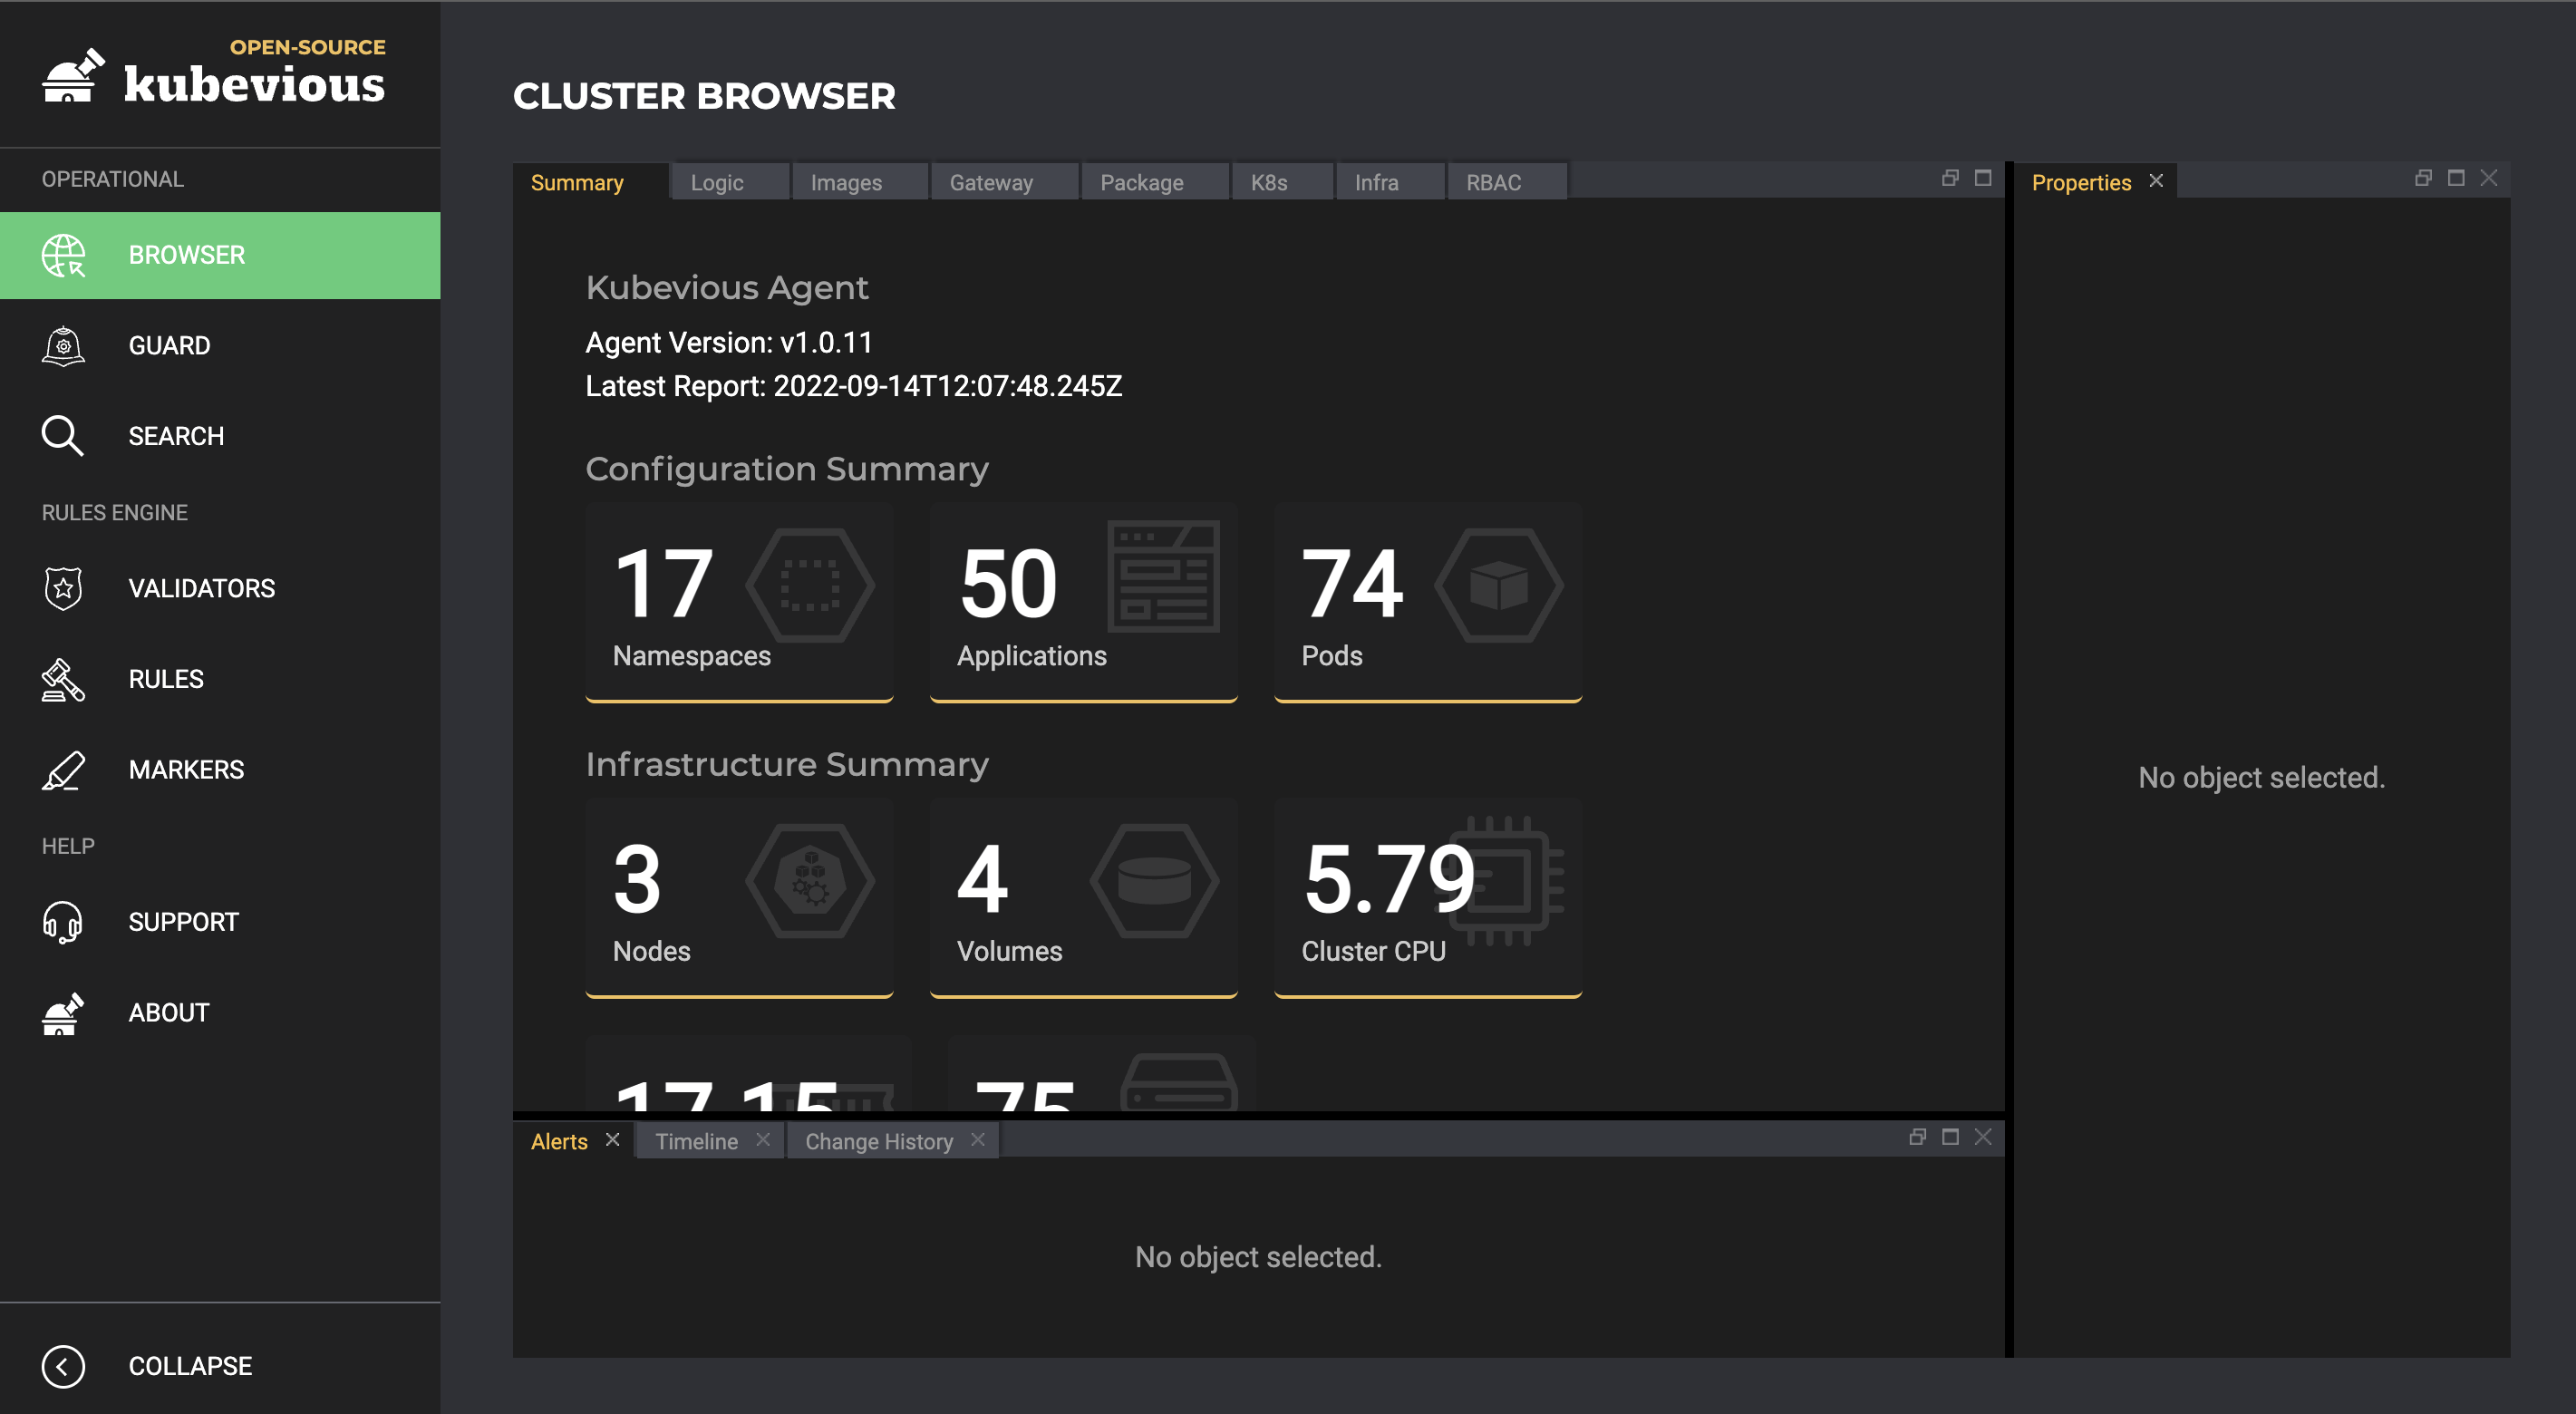
As with the Kubernetes dashboard, you deploy Kubevious on your cluster in its own namespace. It’s configured to monitor the cluster that it lives in automatically. However, there’s also a version of Kubevious, Kubevious Portable, that can be installed outside a cluster — for instance, on a development machine that engineers can run kubectl commands from. You lose some features with Kubevious Portable (like the time machine and custom rule execution), but you can easily set it up in your local development environment and get vital details about your cluster.
Key features
This next-gen dashboard offers these important features:
Validation
One of the most striking features of Kubevious is that it makes resource validation simple. Validation rules help you throw errors or warnings when a set threshold is reached. Markers help you understand the role that a resource plays in a system.
Preset rules and markers
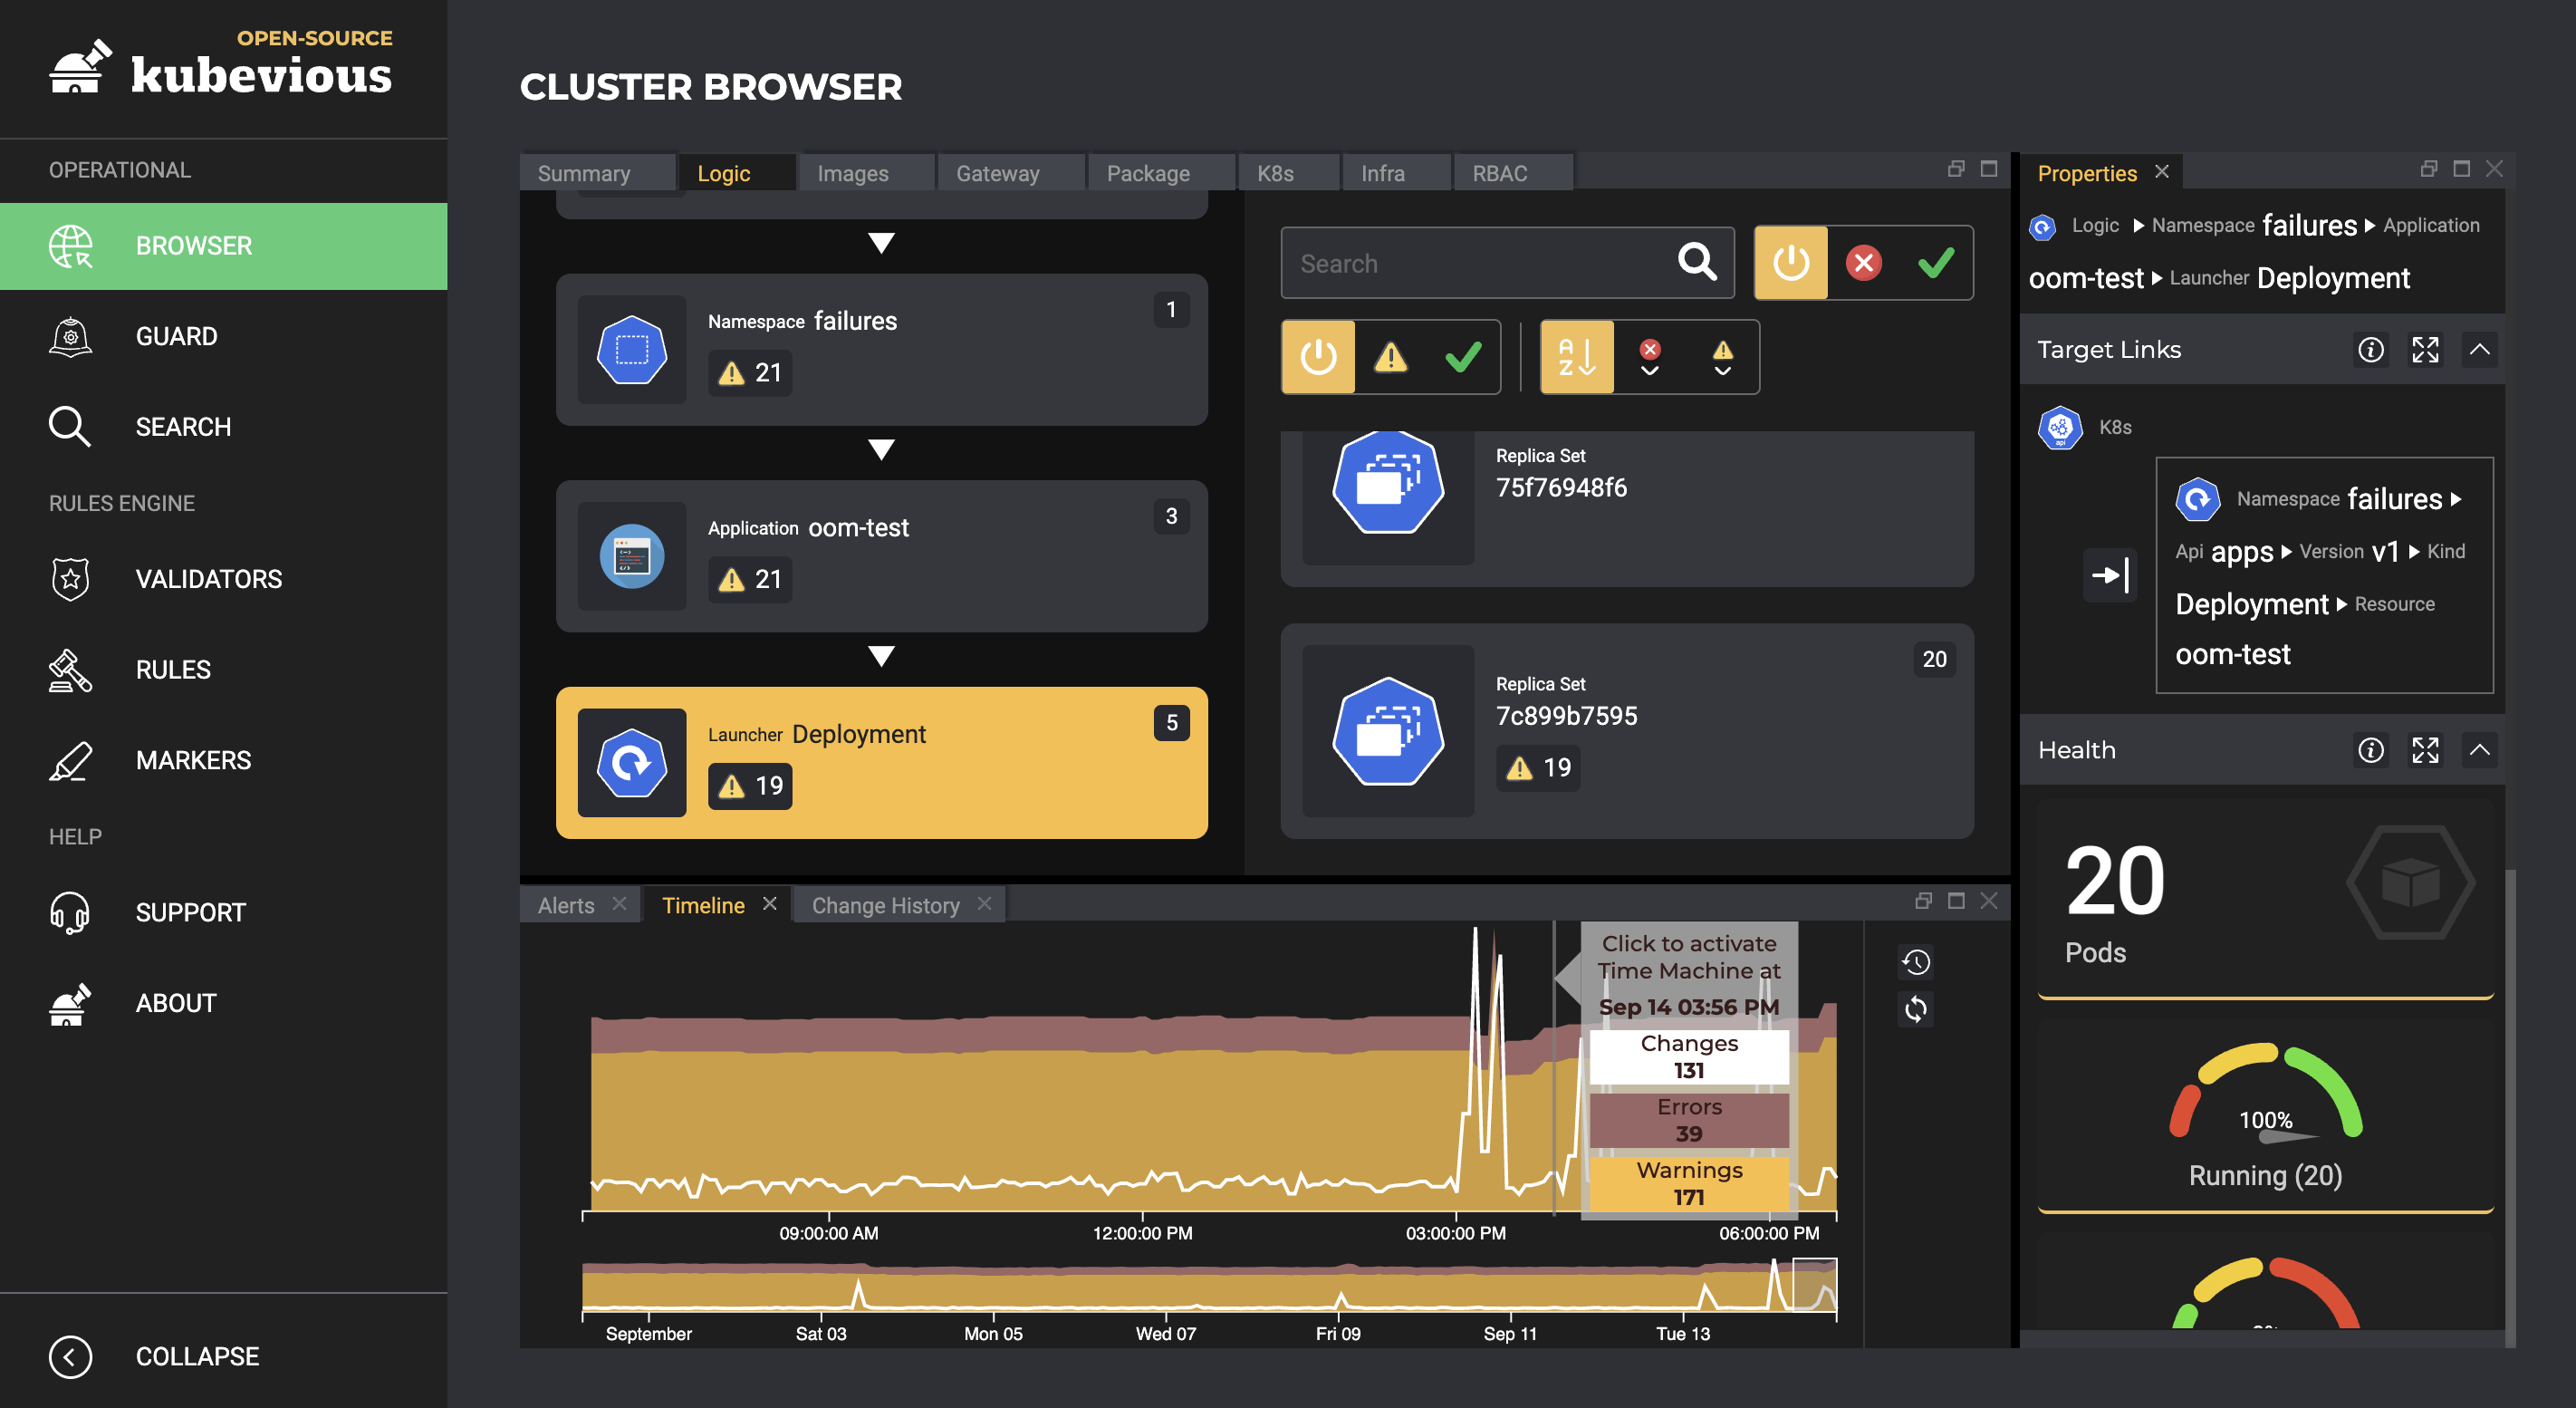
Kubevious ships with a bunch of default rules to help you get started quickly. Here’s how they look in action:
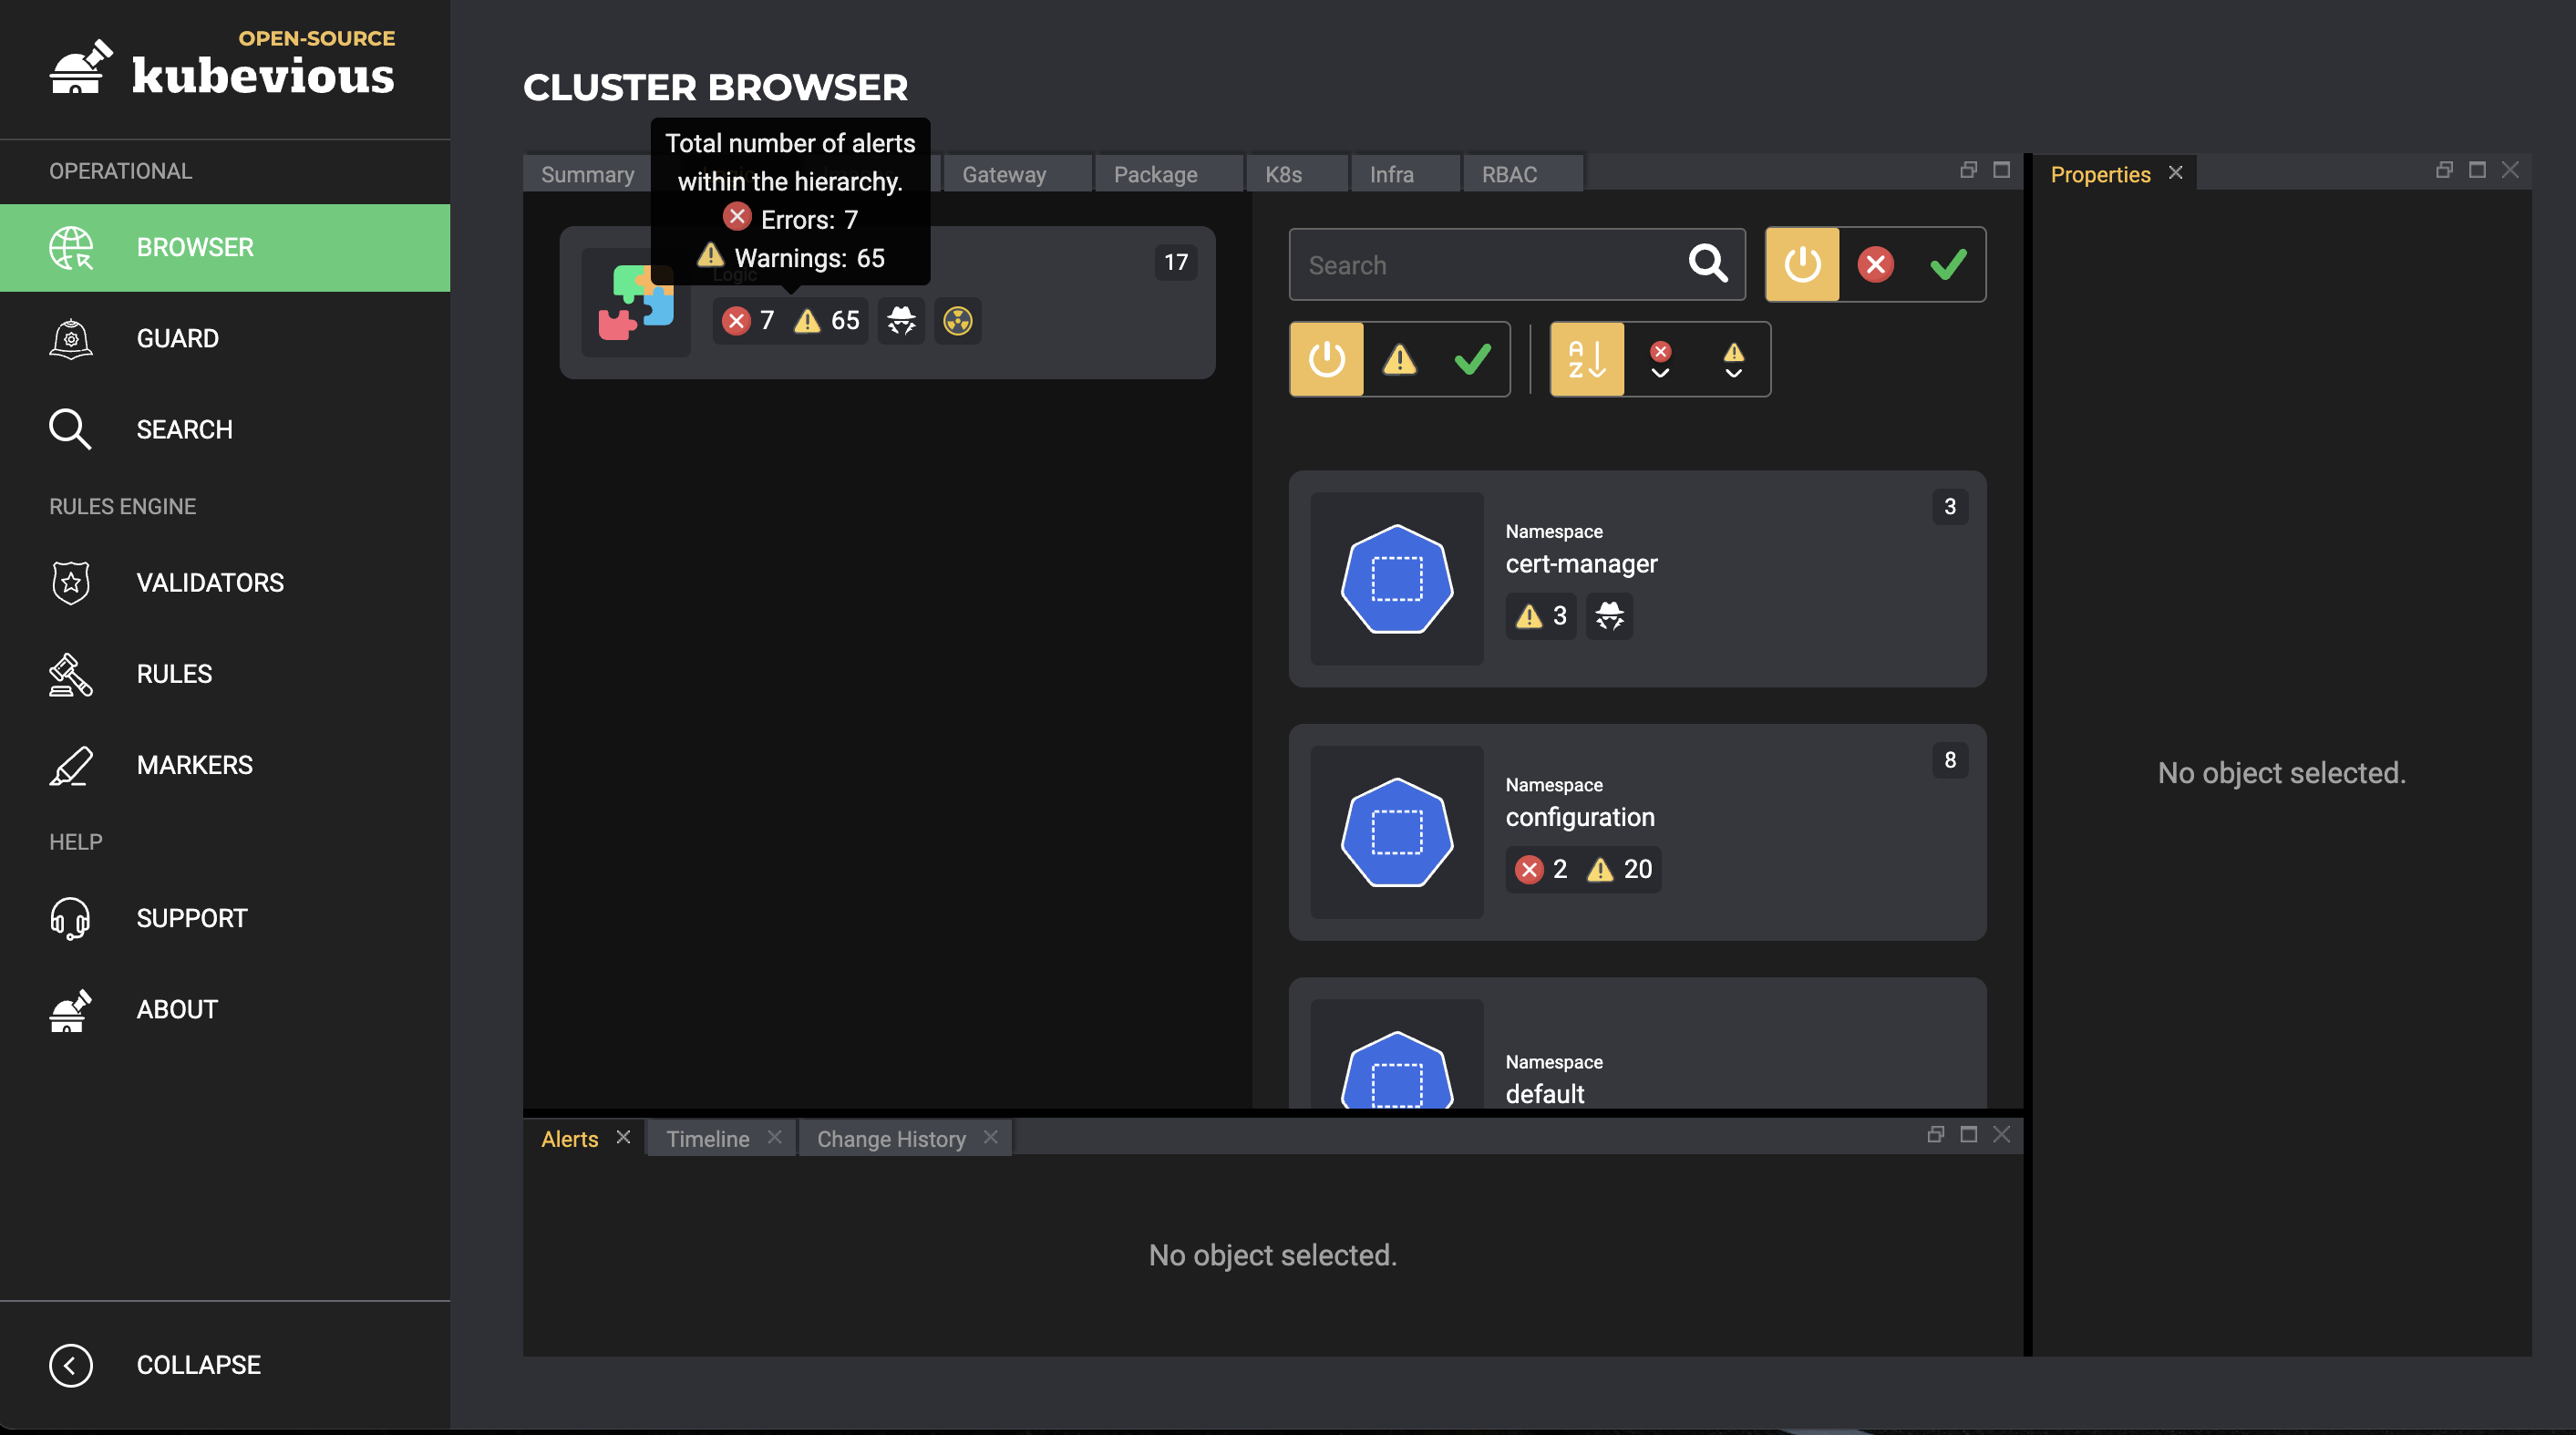
Once you click on a resource, you can explore its rule violation alerts in detail:
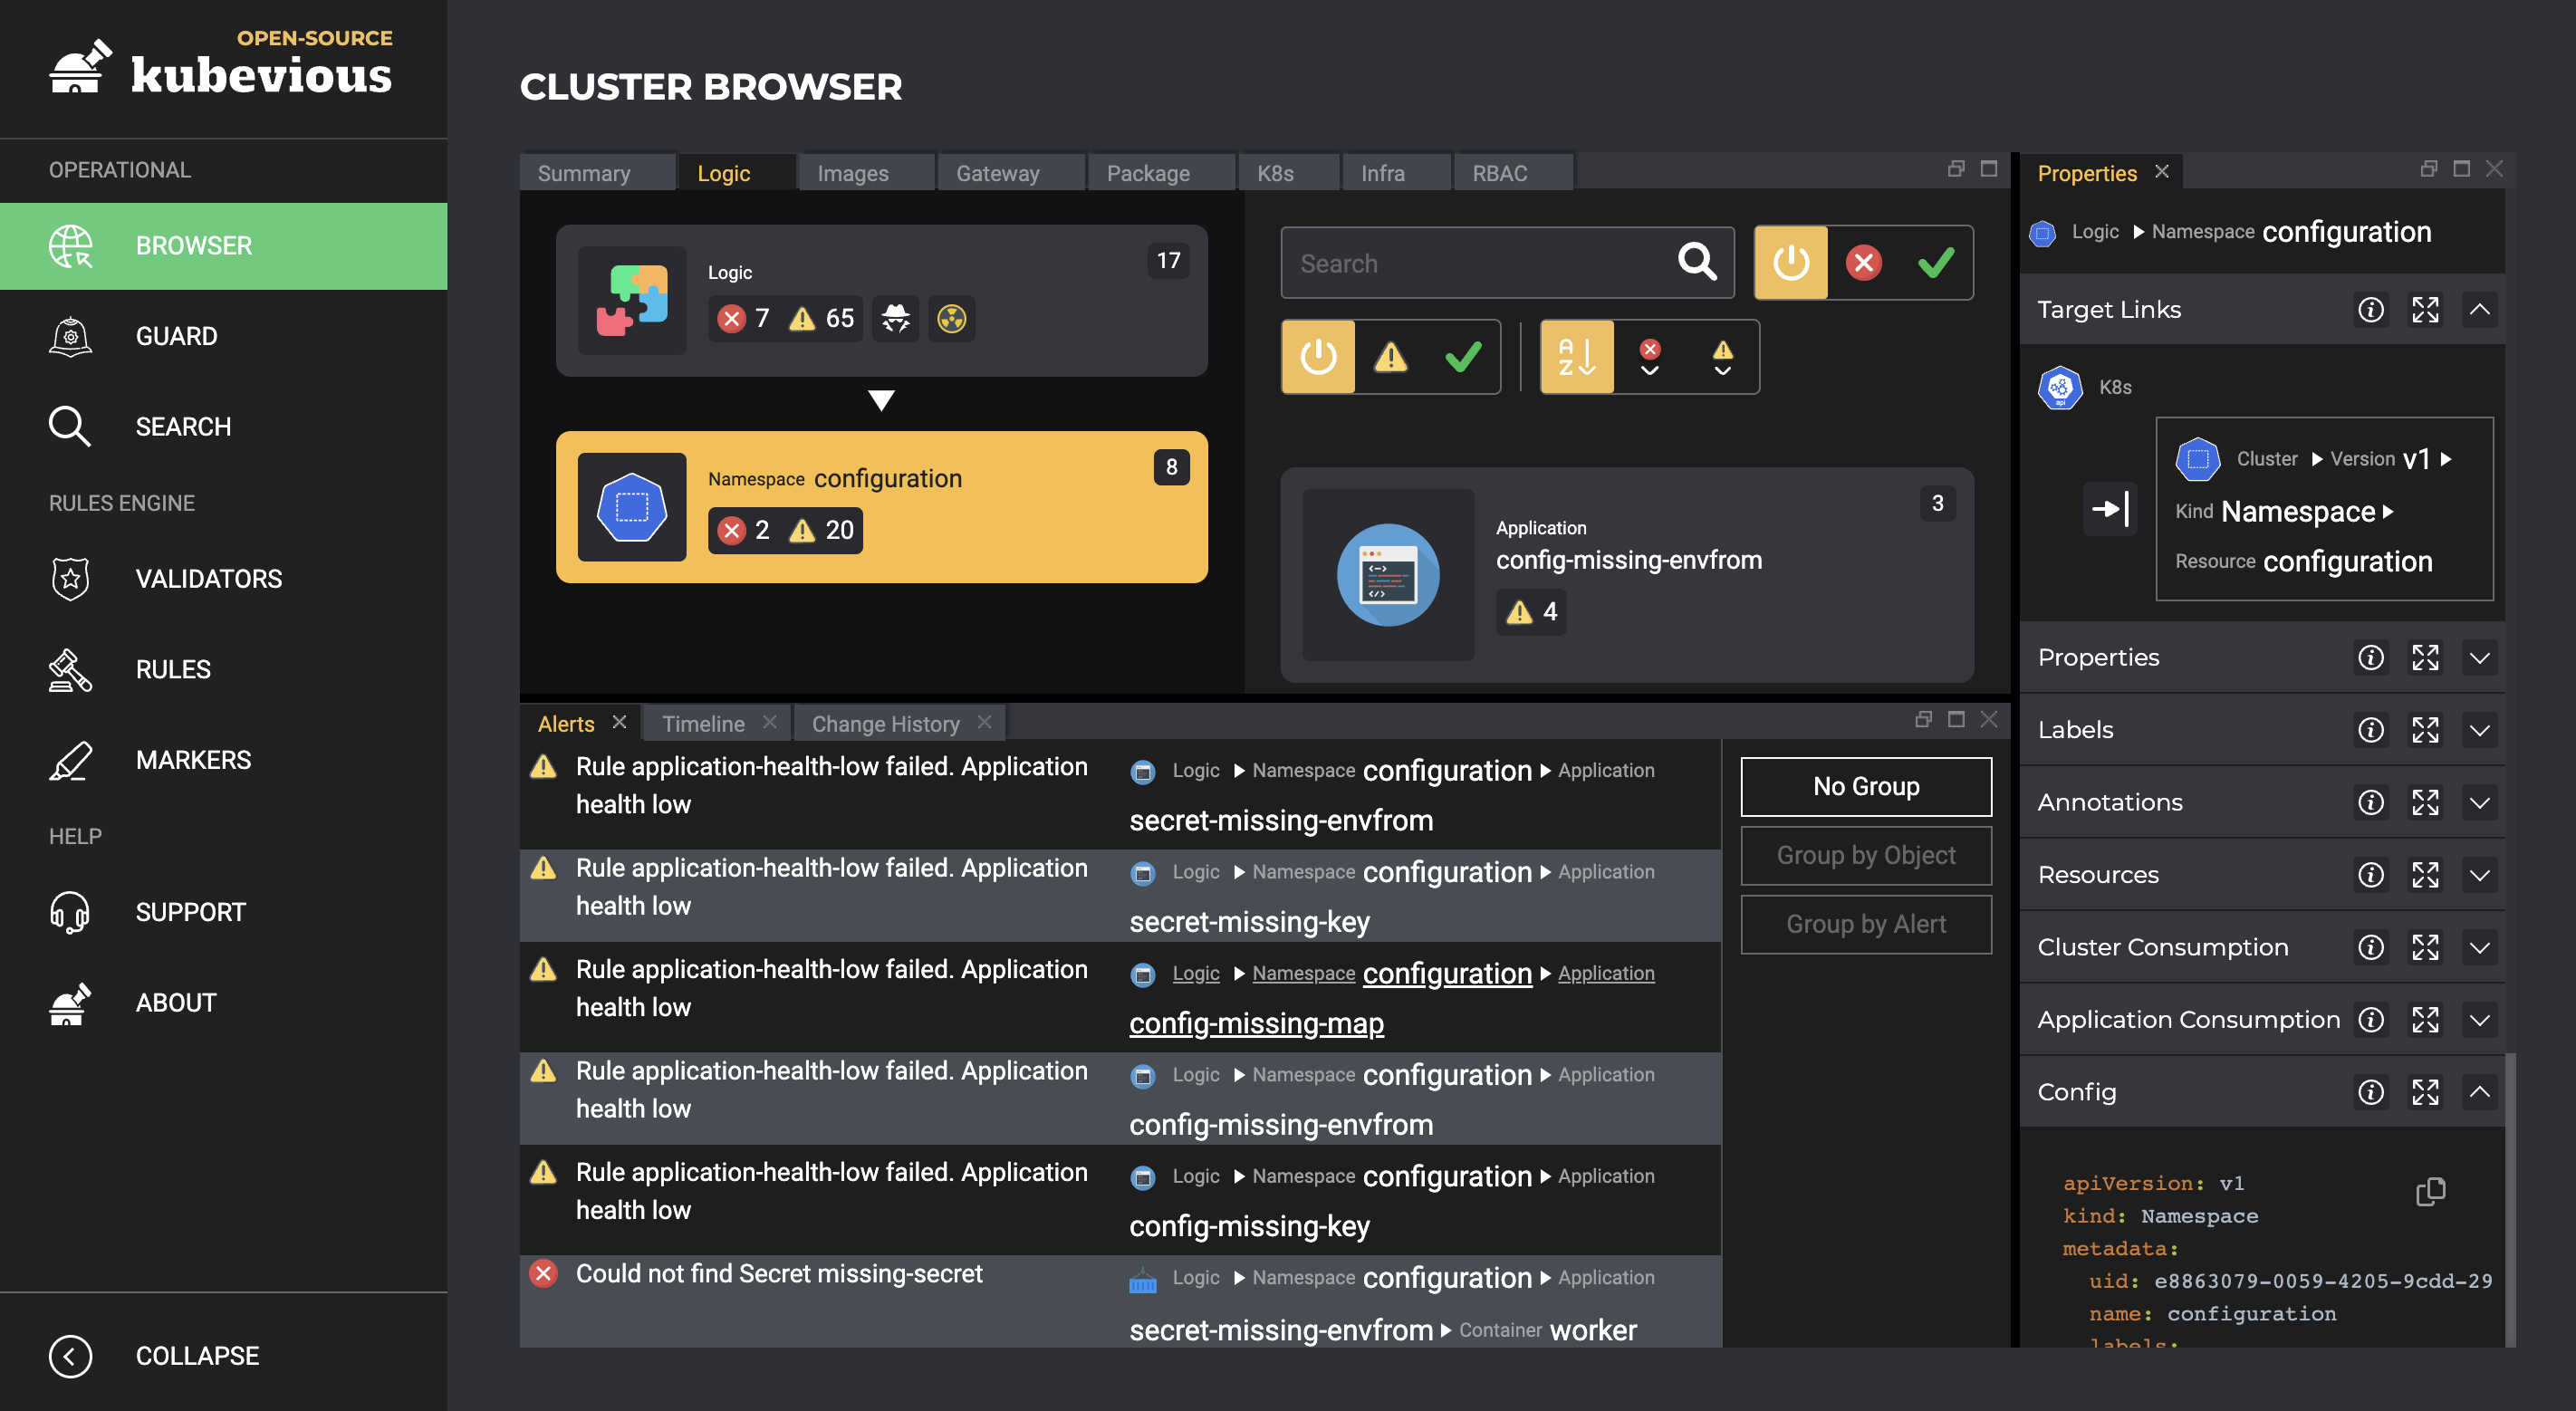
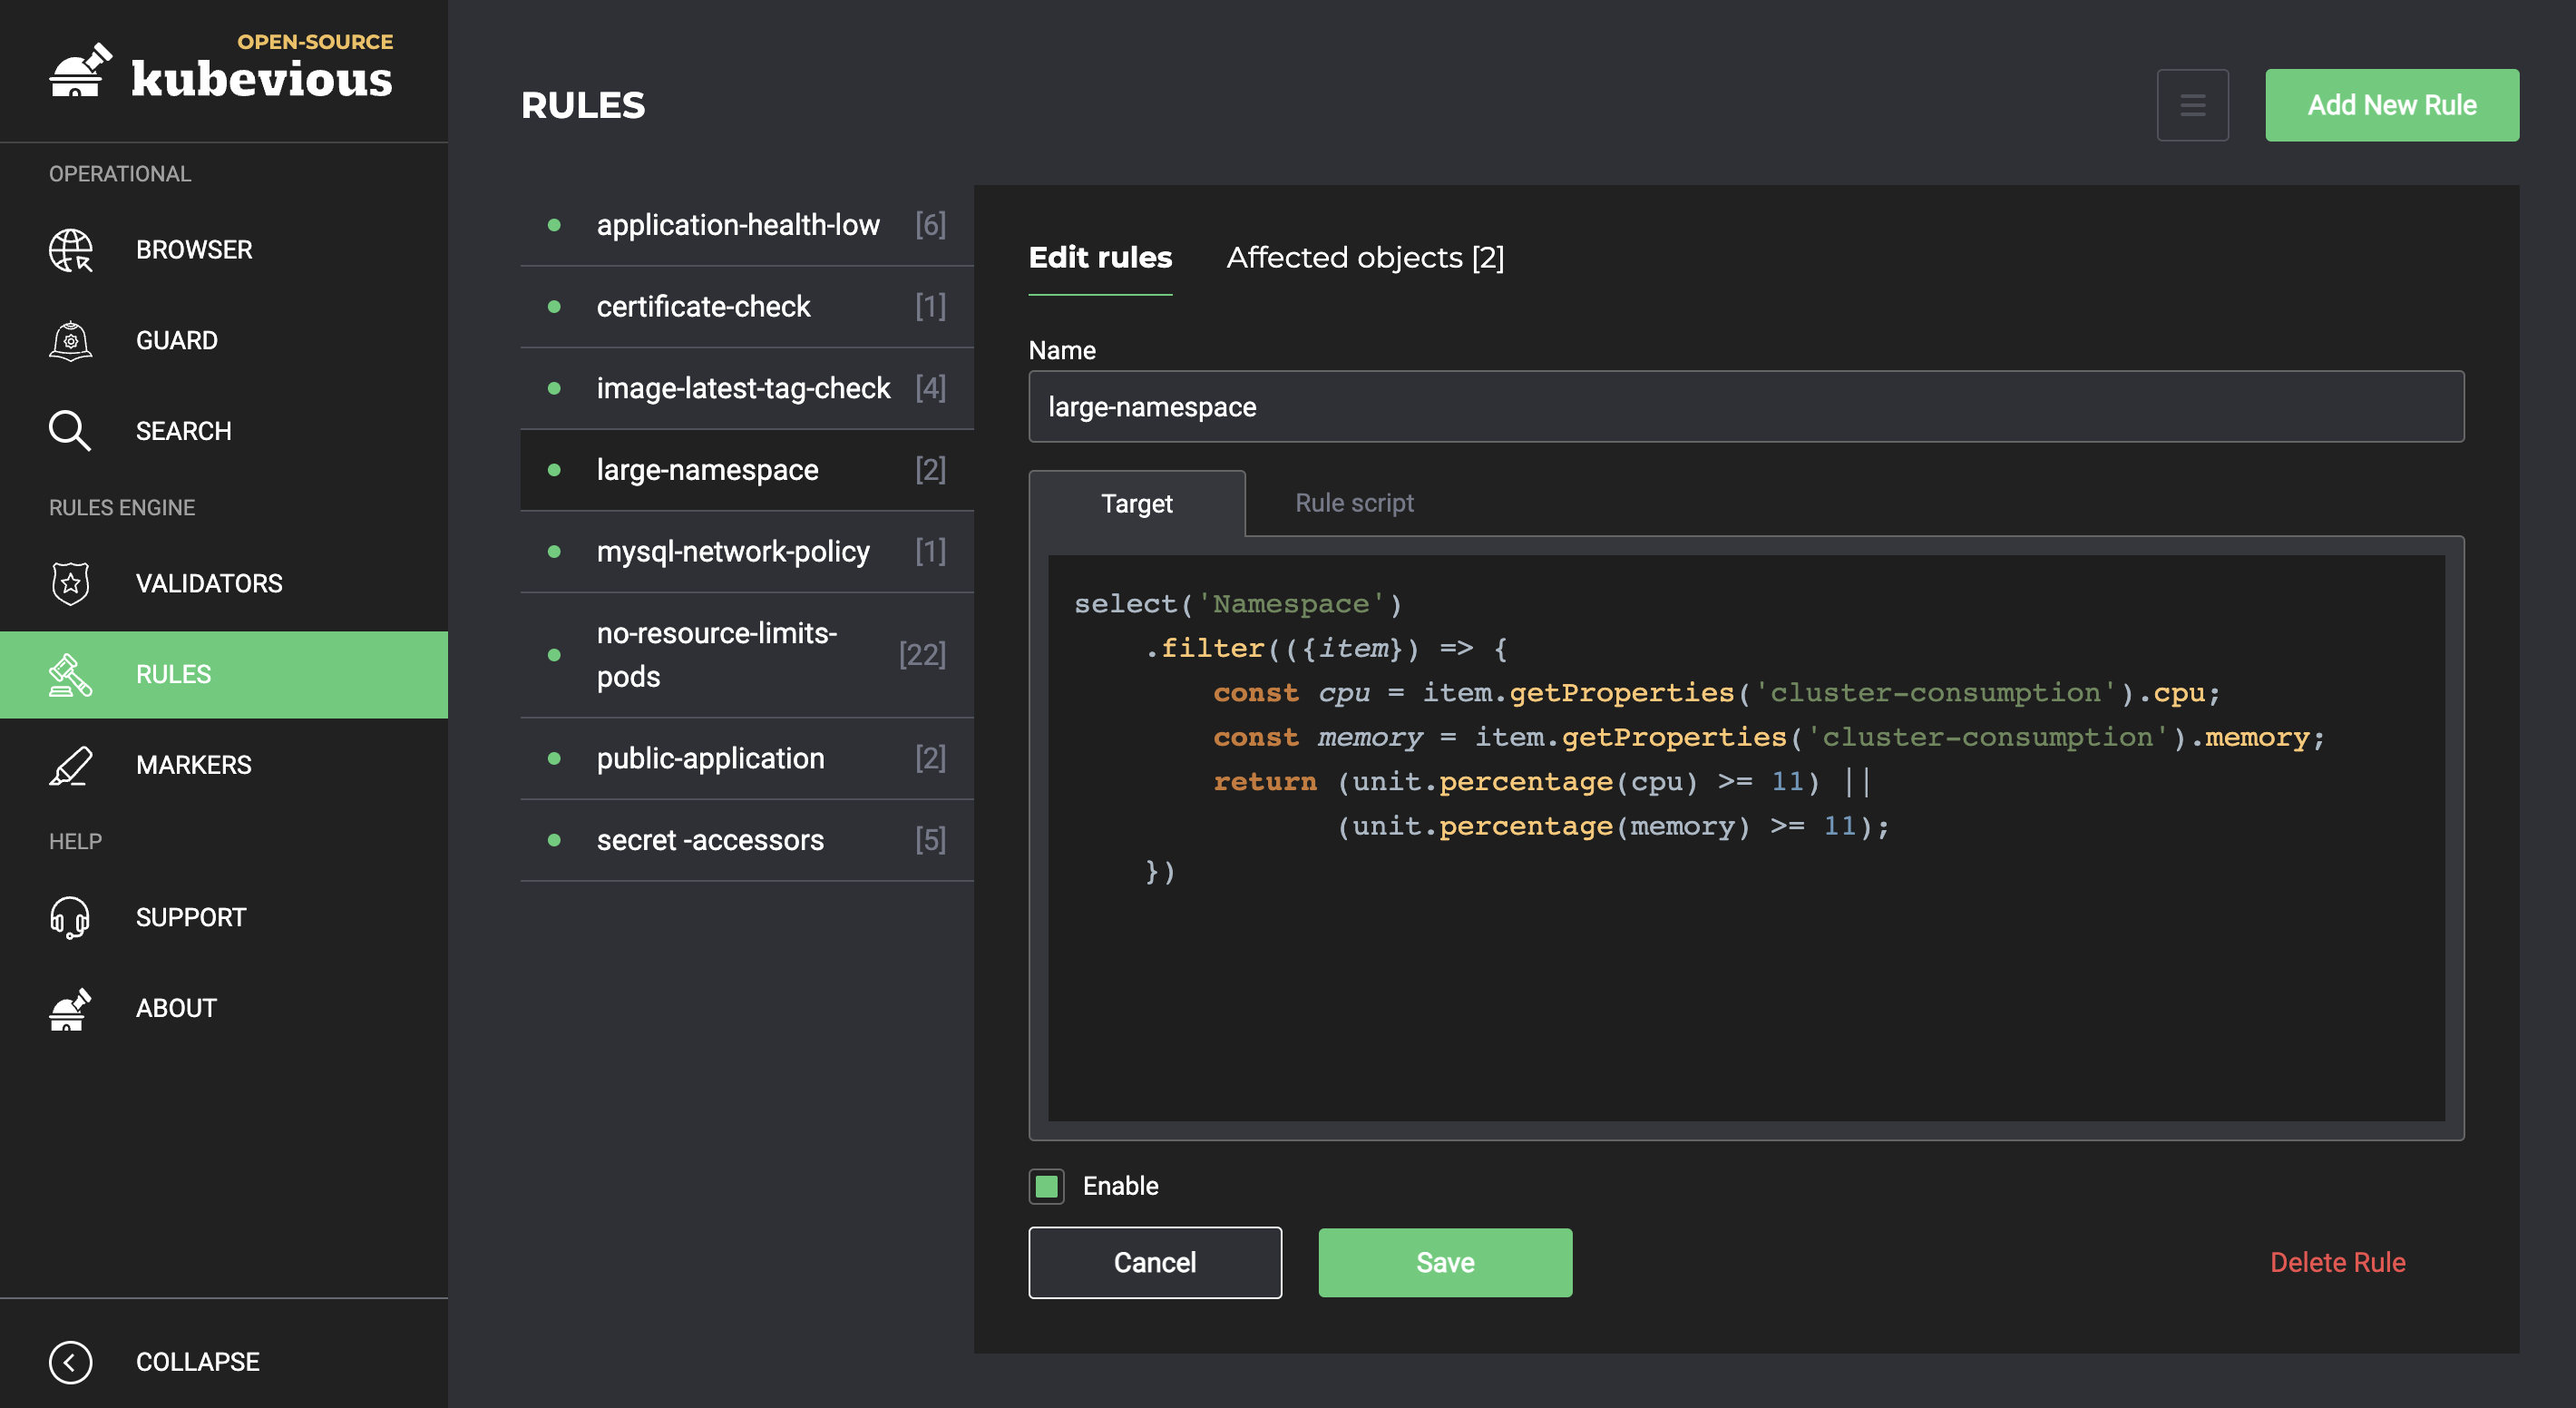
You can explore the full list of active rules in your cluster by heading over to the Rules page:
You’ll notice that many rules use a method called mark() in their rule scripts to mark a resource with a predefined marker (more on this later). You can view the list of available markers by going to the Markers page:
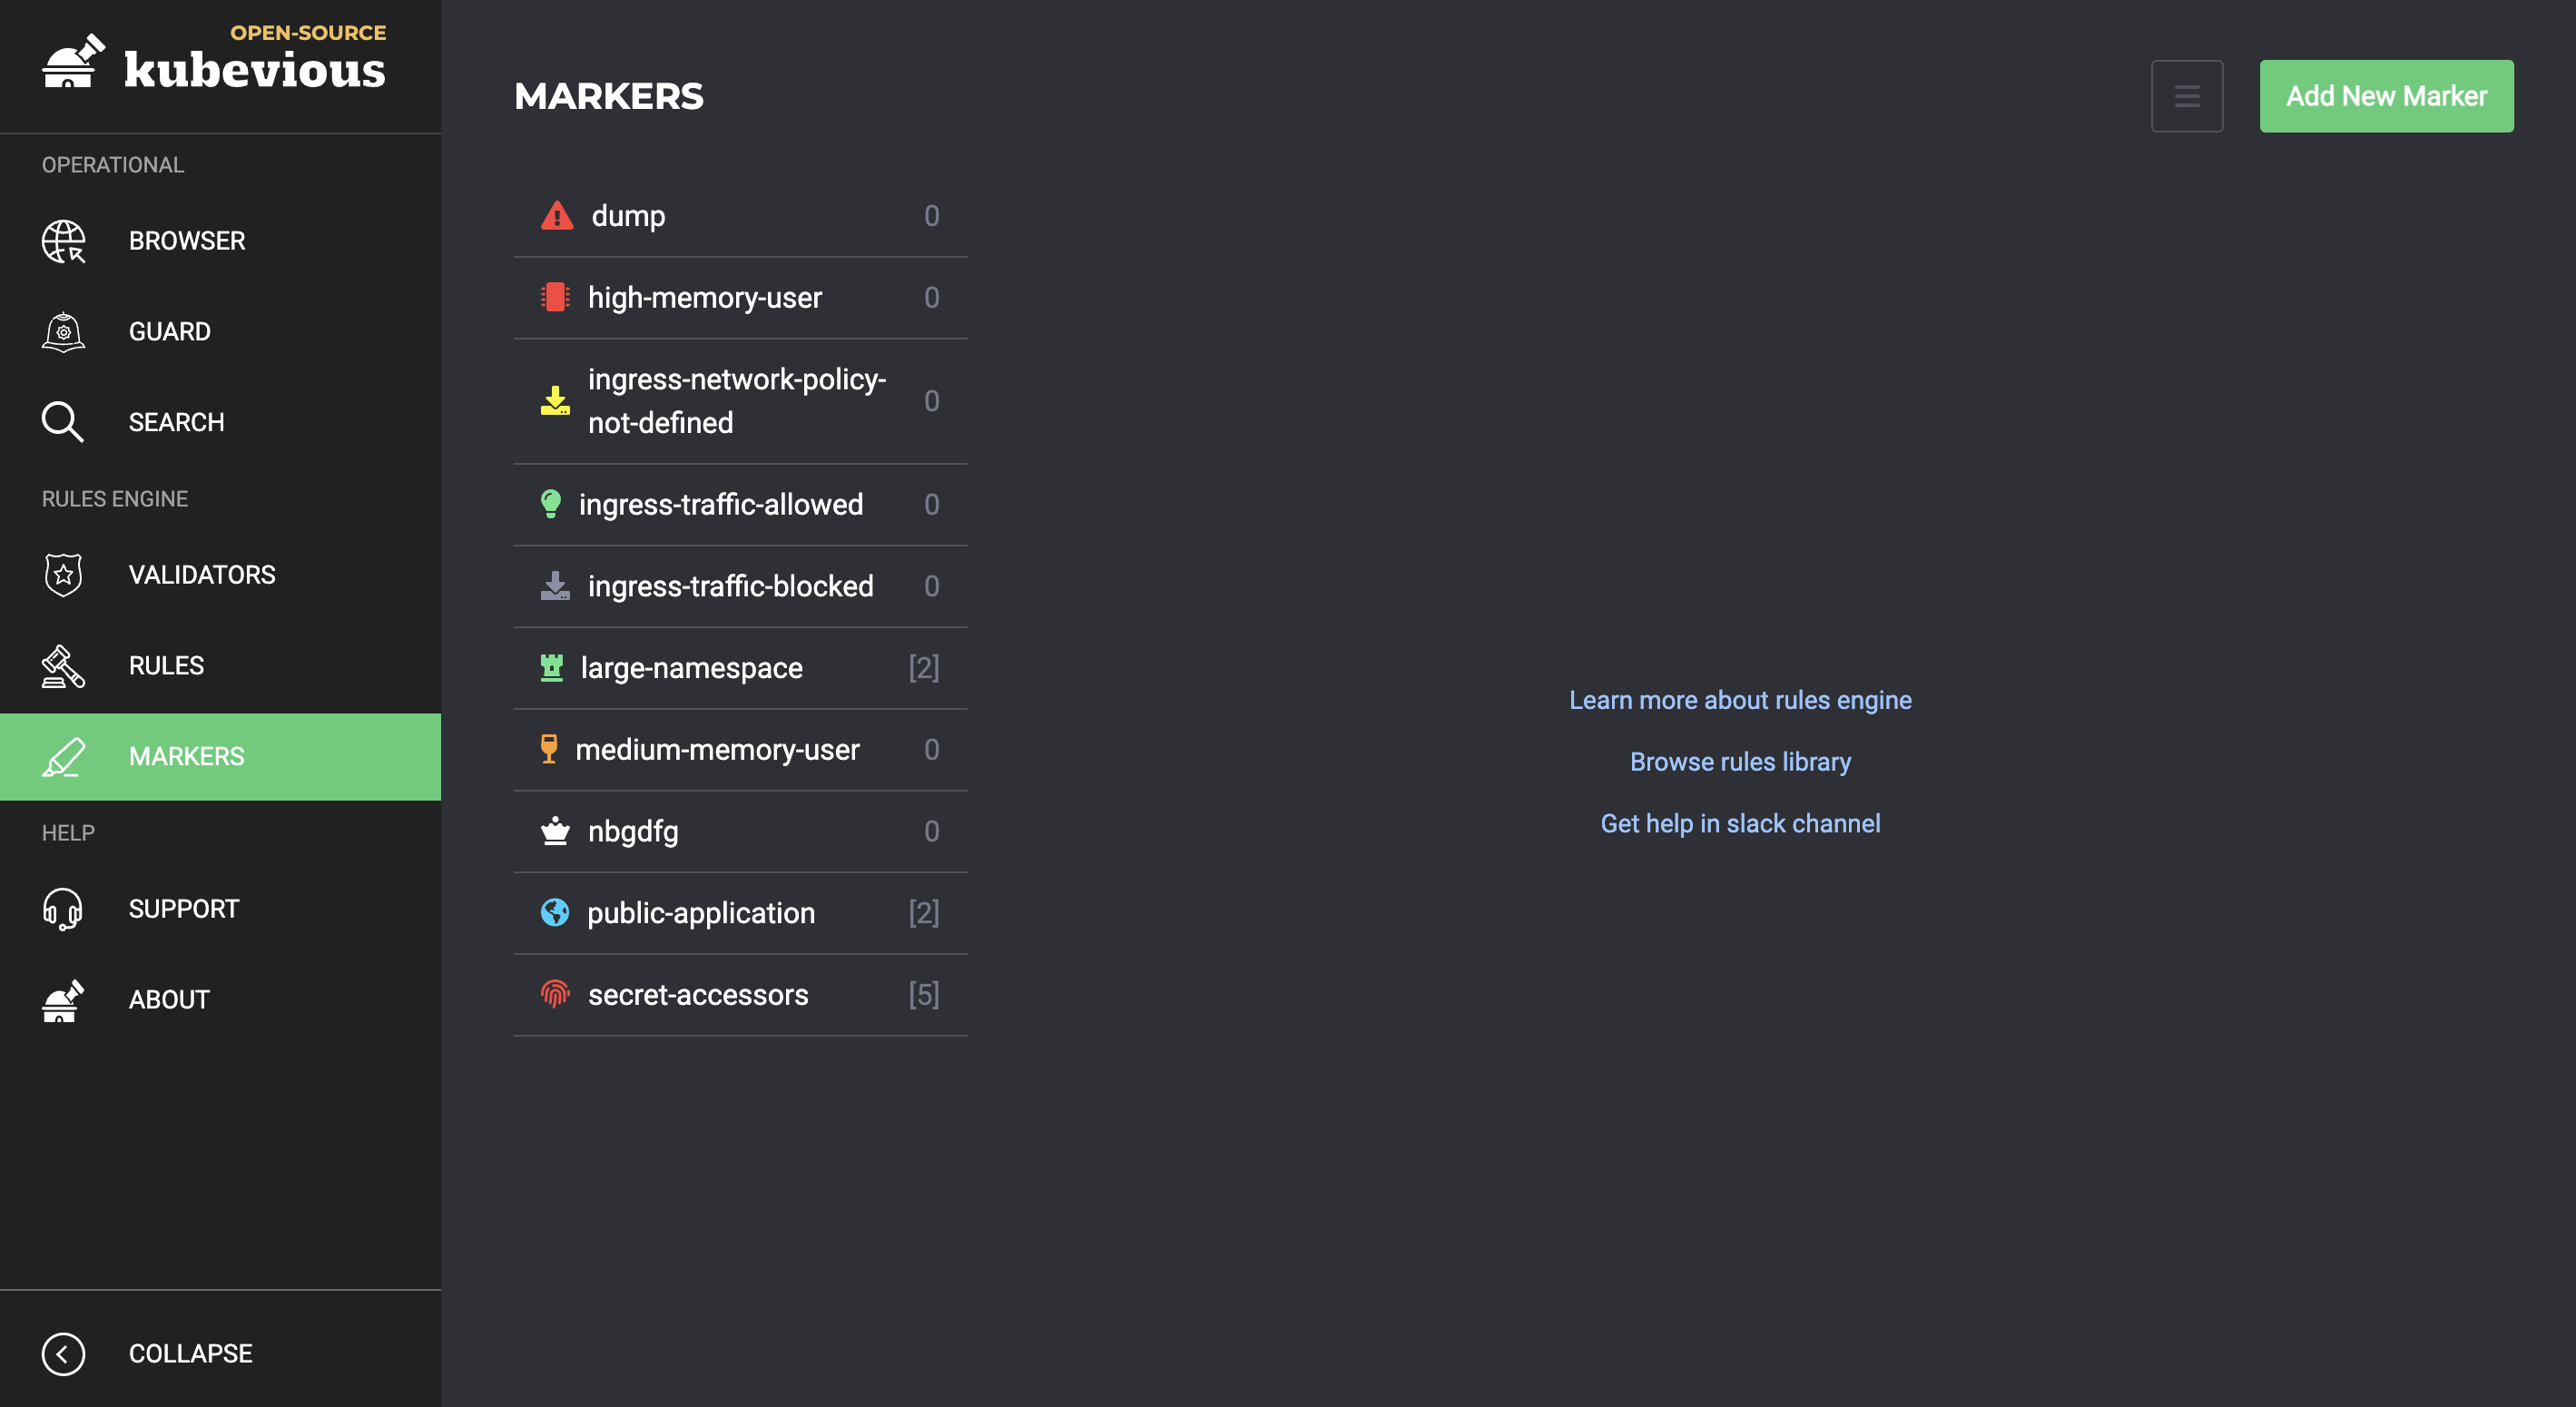
You can use these markers to classify your resources using tags based on their performance or usage history.
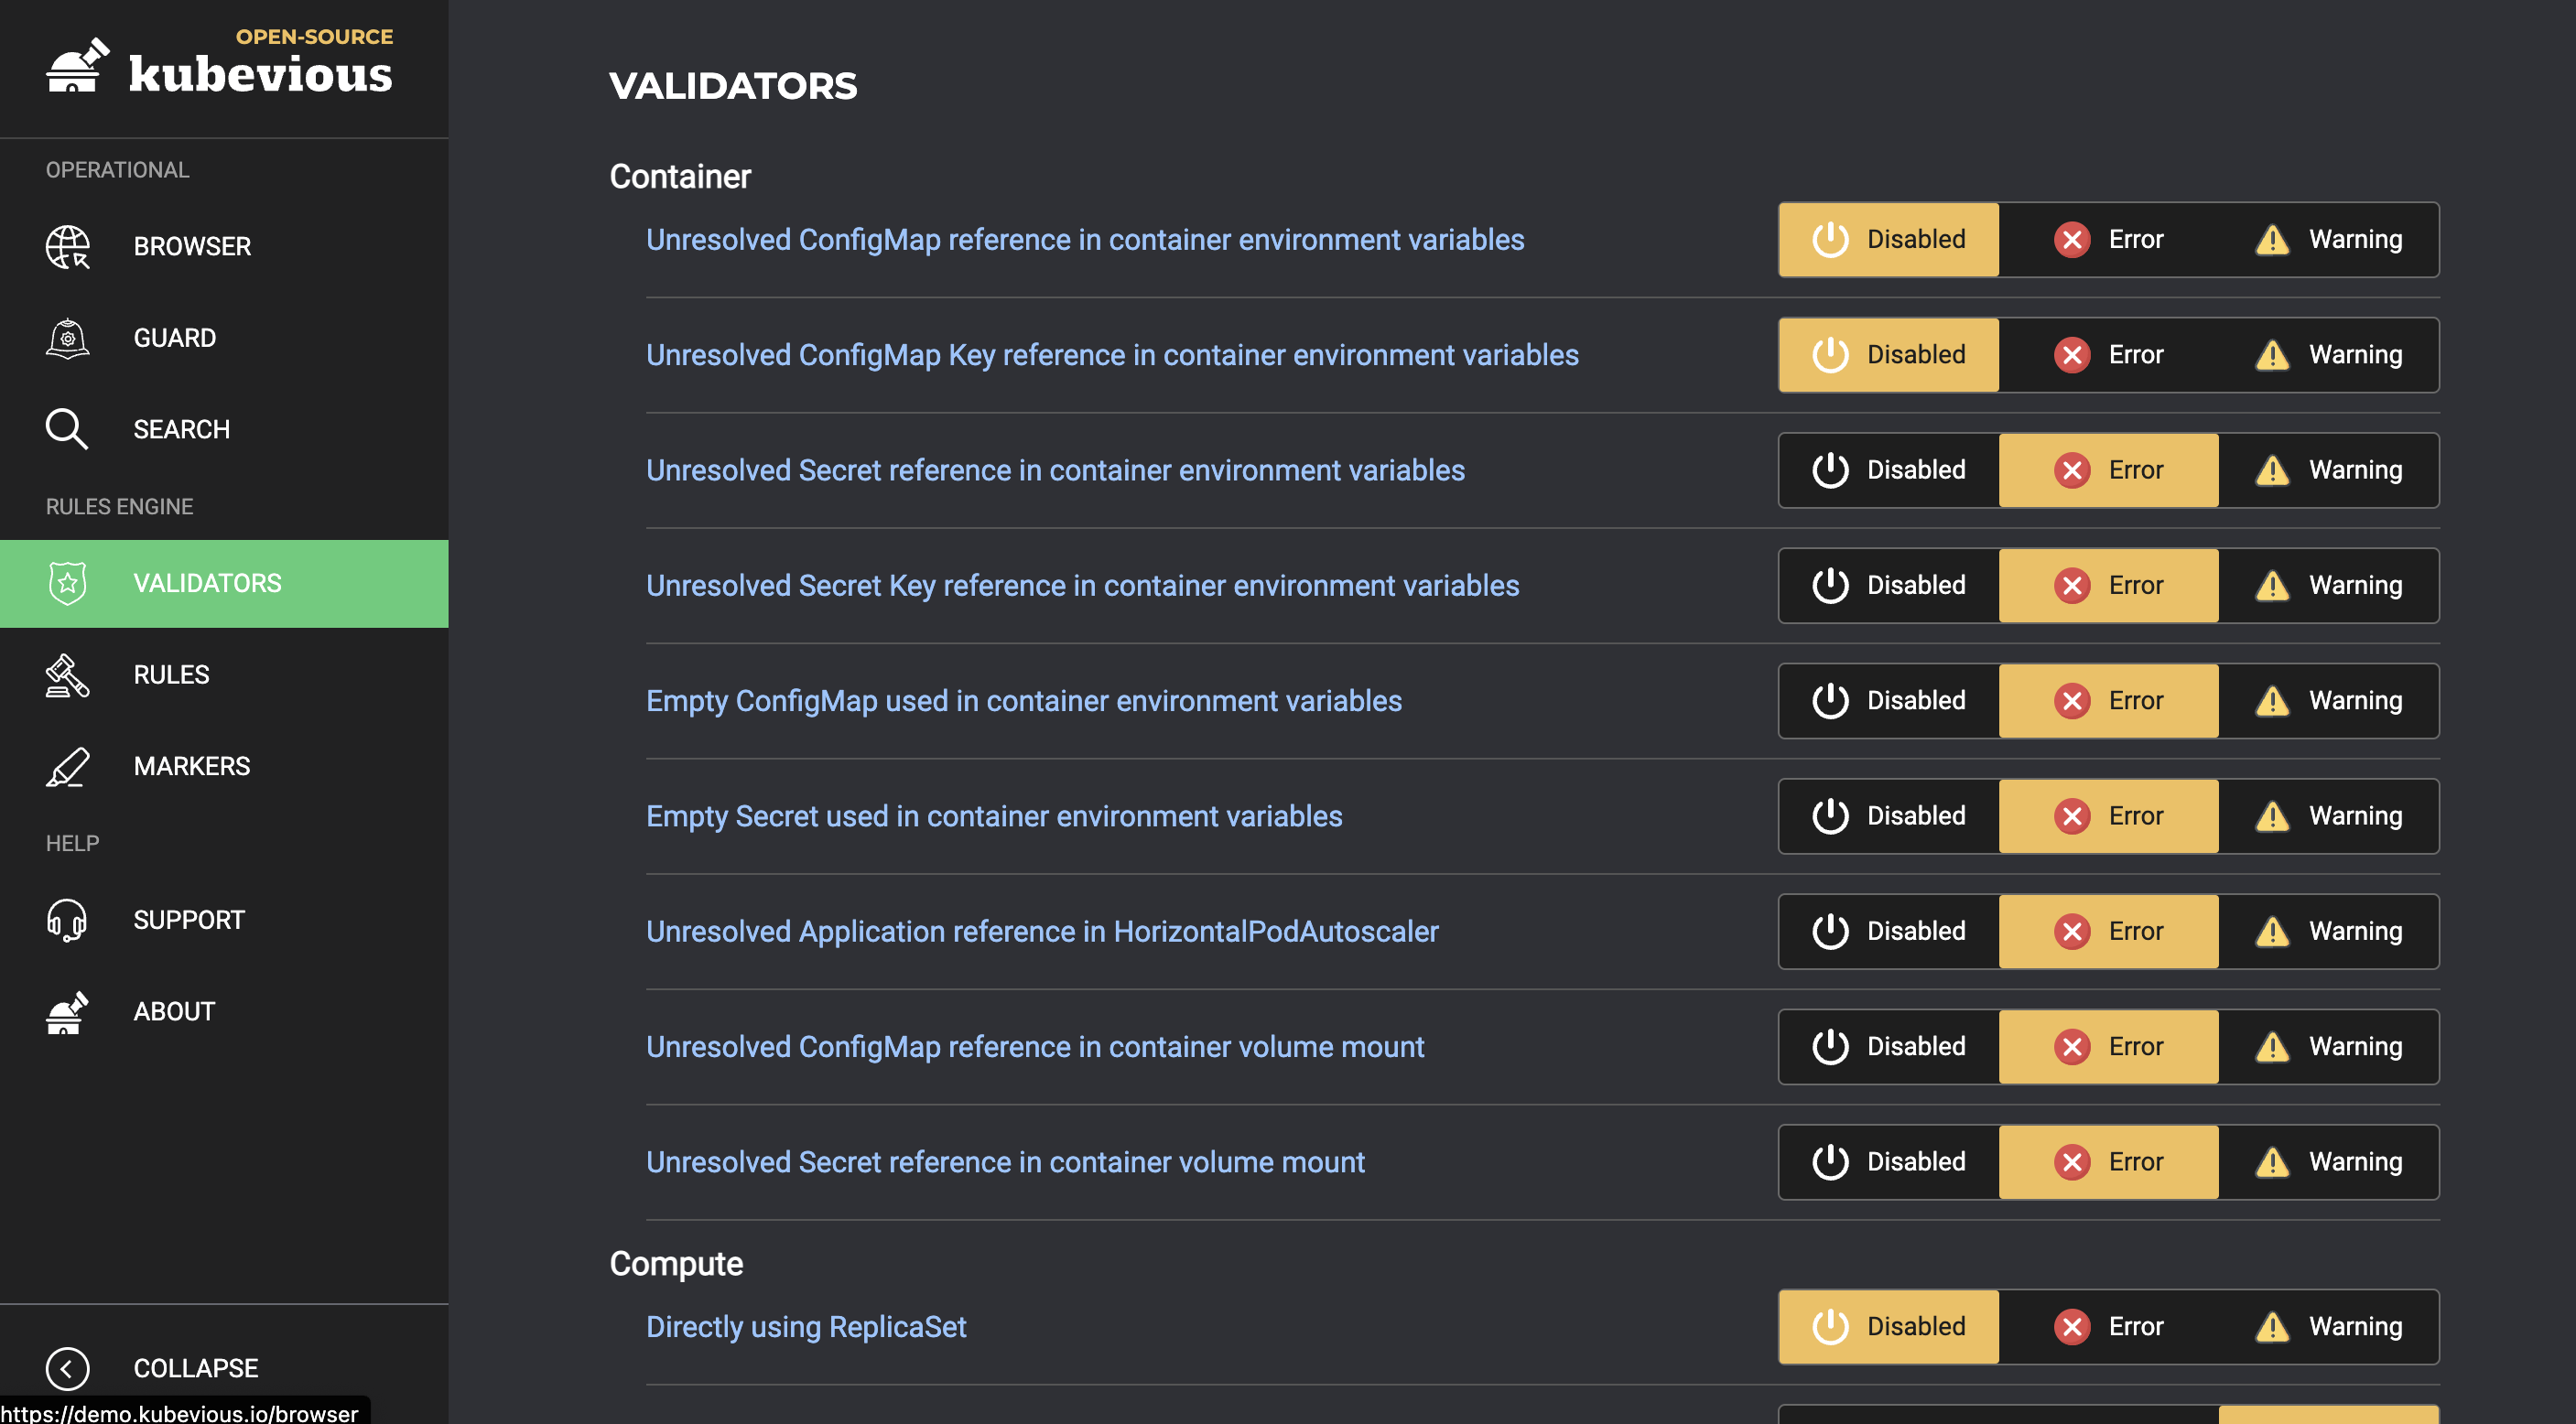
In addition, Kubevious currently offers a total of 44 validators that check for Kubernetes best practices and misconfigurations. You can easily enable and disable them and choose their severity on the Validators page:
Custom rules and markers via the inbuilt editor
The Rules page also allows you to create your own rules by clicking on the Add New Rule button. You’ll be required to enter a target script and a rule script. The scripts are written in a simple language called Kubik, which has a syntax similar to JavaScript’s.
The target script will be used to determine the resources your new rule will be applicable on, and the rule script will hold the validation logic. Here’s an example of a custom container memory usage rule created using this way:
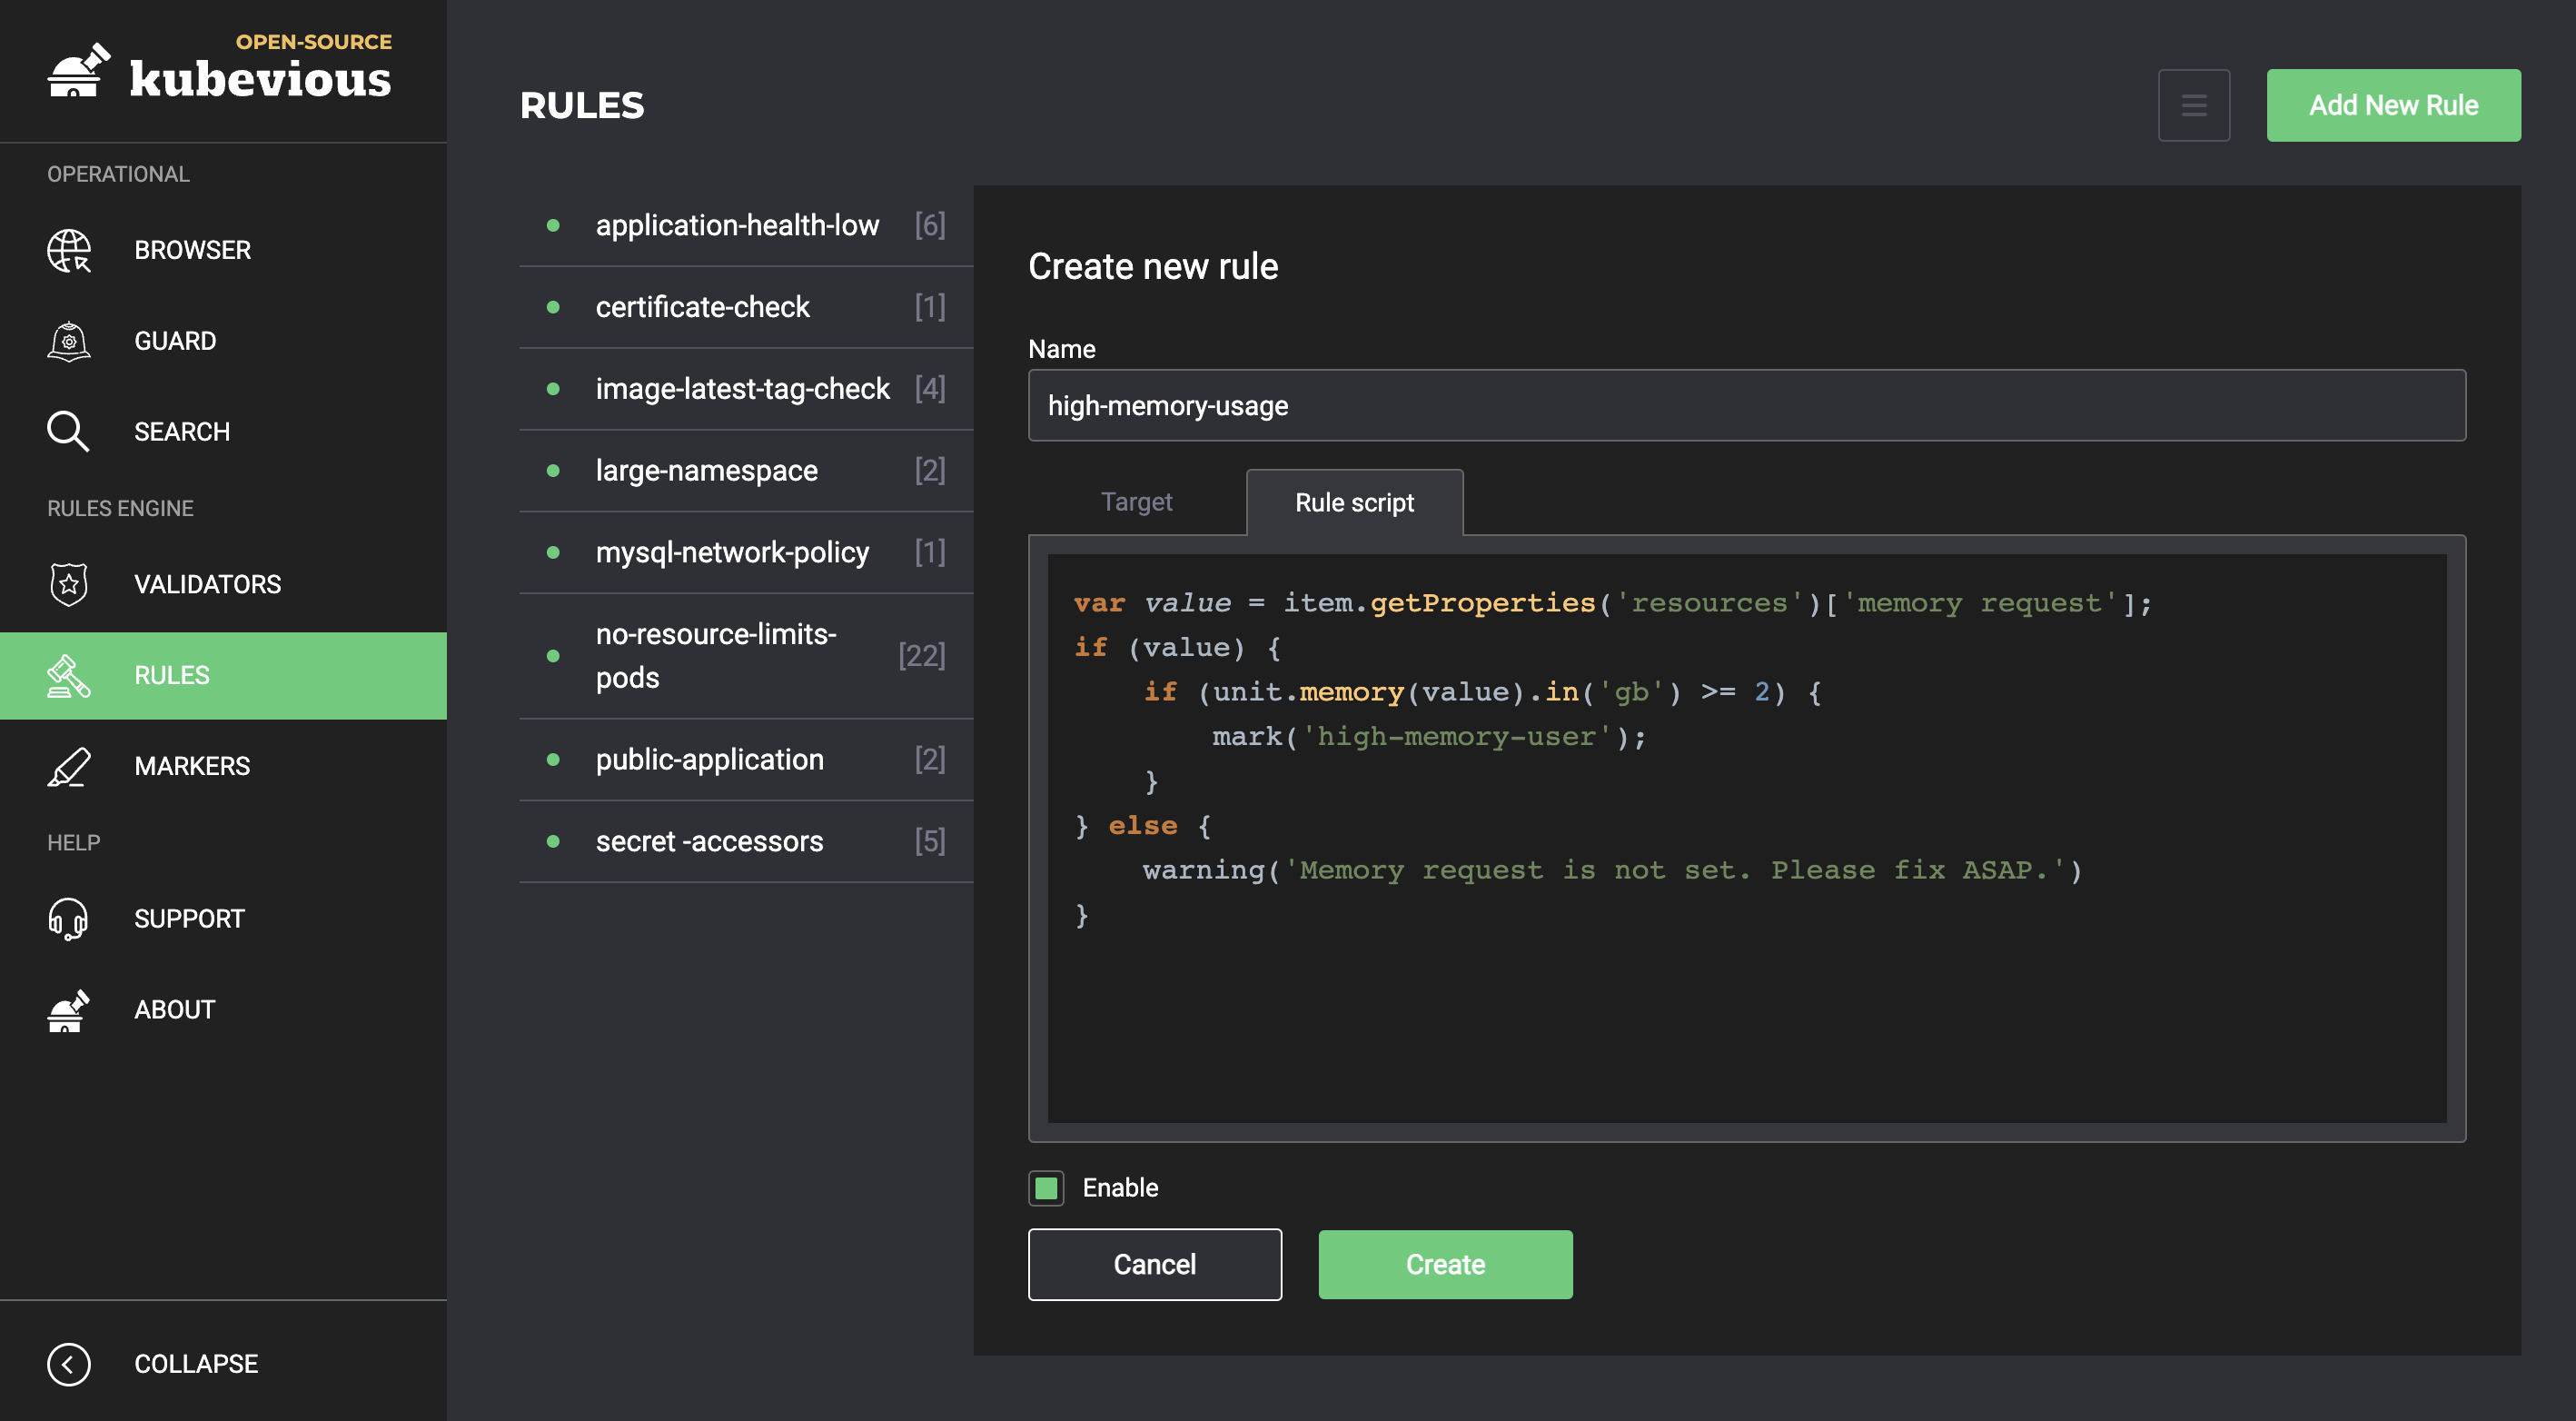
Here’s the target script:
And here’s the rule script:
The ability to add your own rules also opens up the possibility of creating open-source, community rules that people can share and collaborate with. You can find a list of such rules here.
As with rules, you can also create custom markers and assign them to resources by using them in your rules.
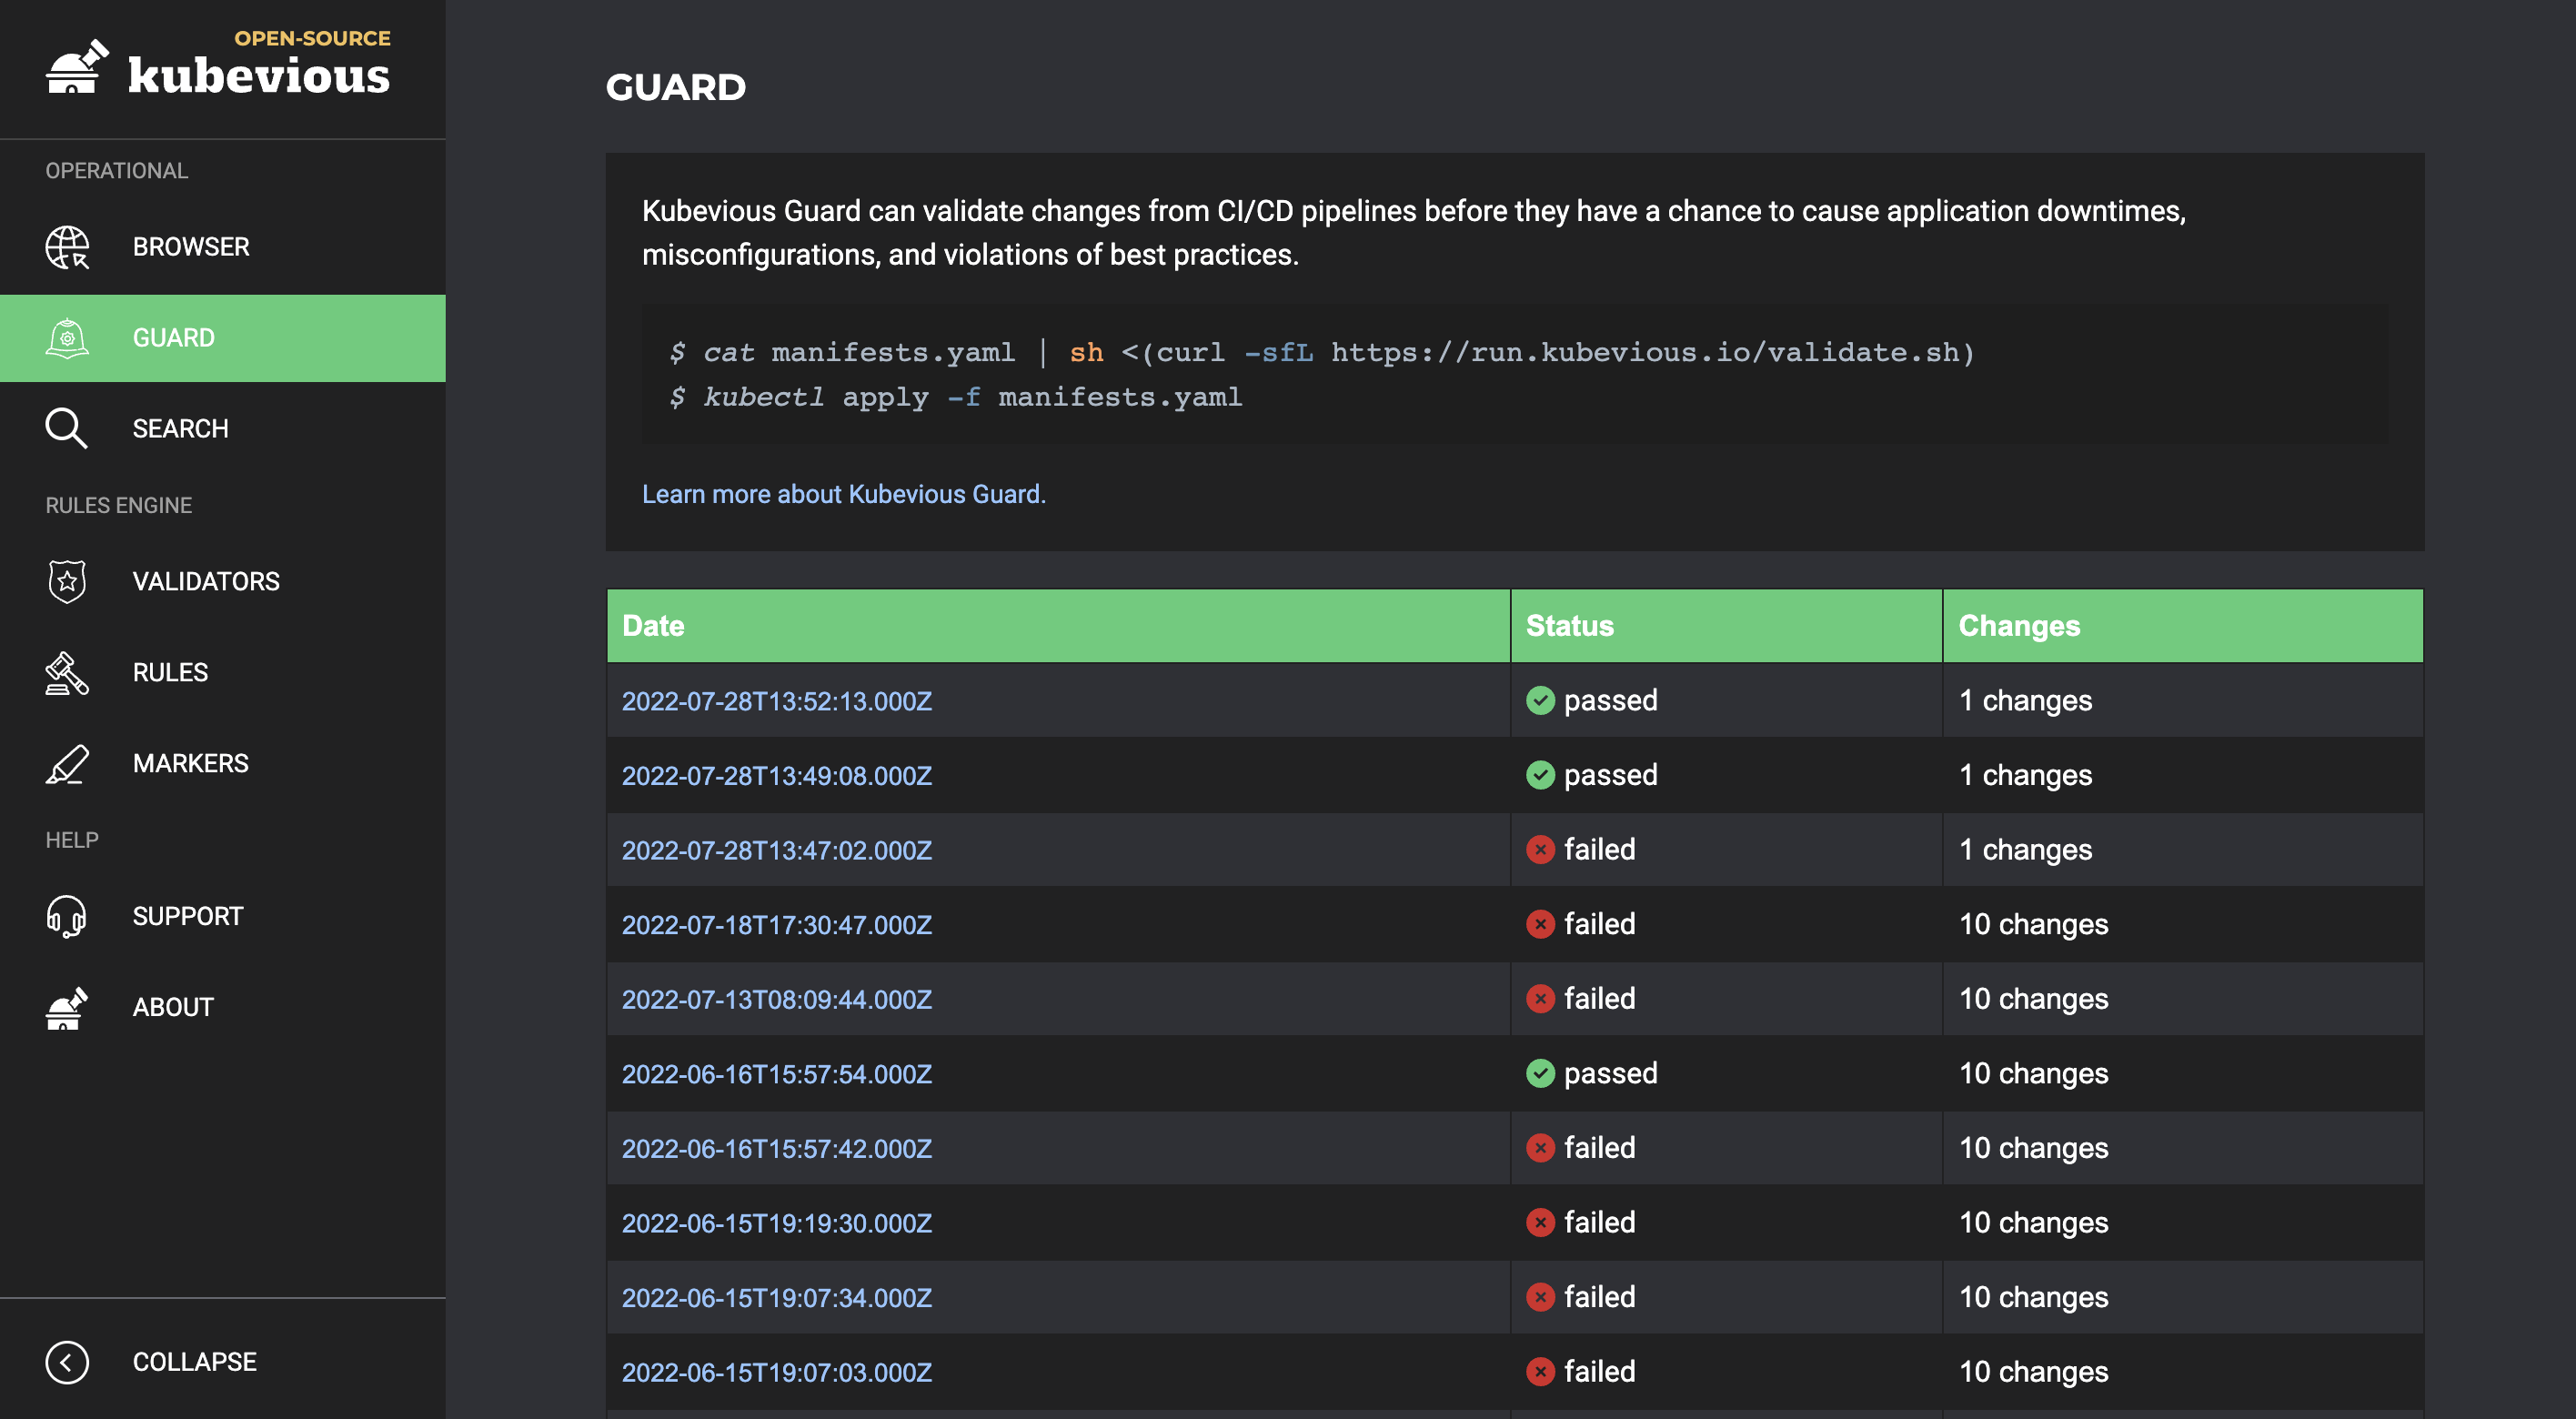
Guard
Kubevious offers integration with your CI/CD pipeline to validate them before they can wreak any havoc on your applications. You can set this up by running the following commands:
You can head over to the Guard page in the dashboard to view the results of the validations.
Analysis
Kubevious offers a bunch of powerful features that help you analyze your cluster and find your way around it easily. Here are some of them:
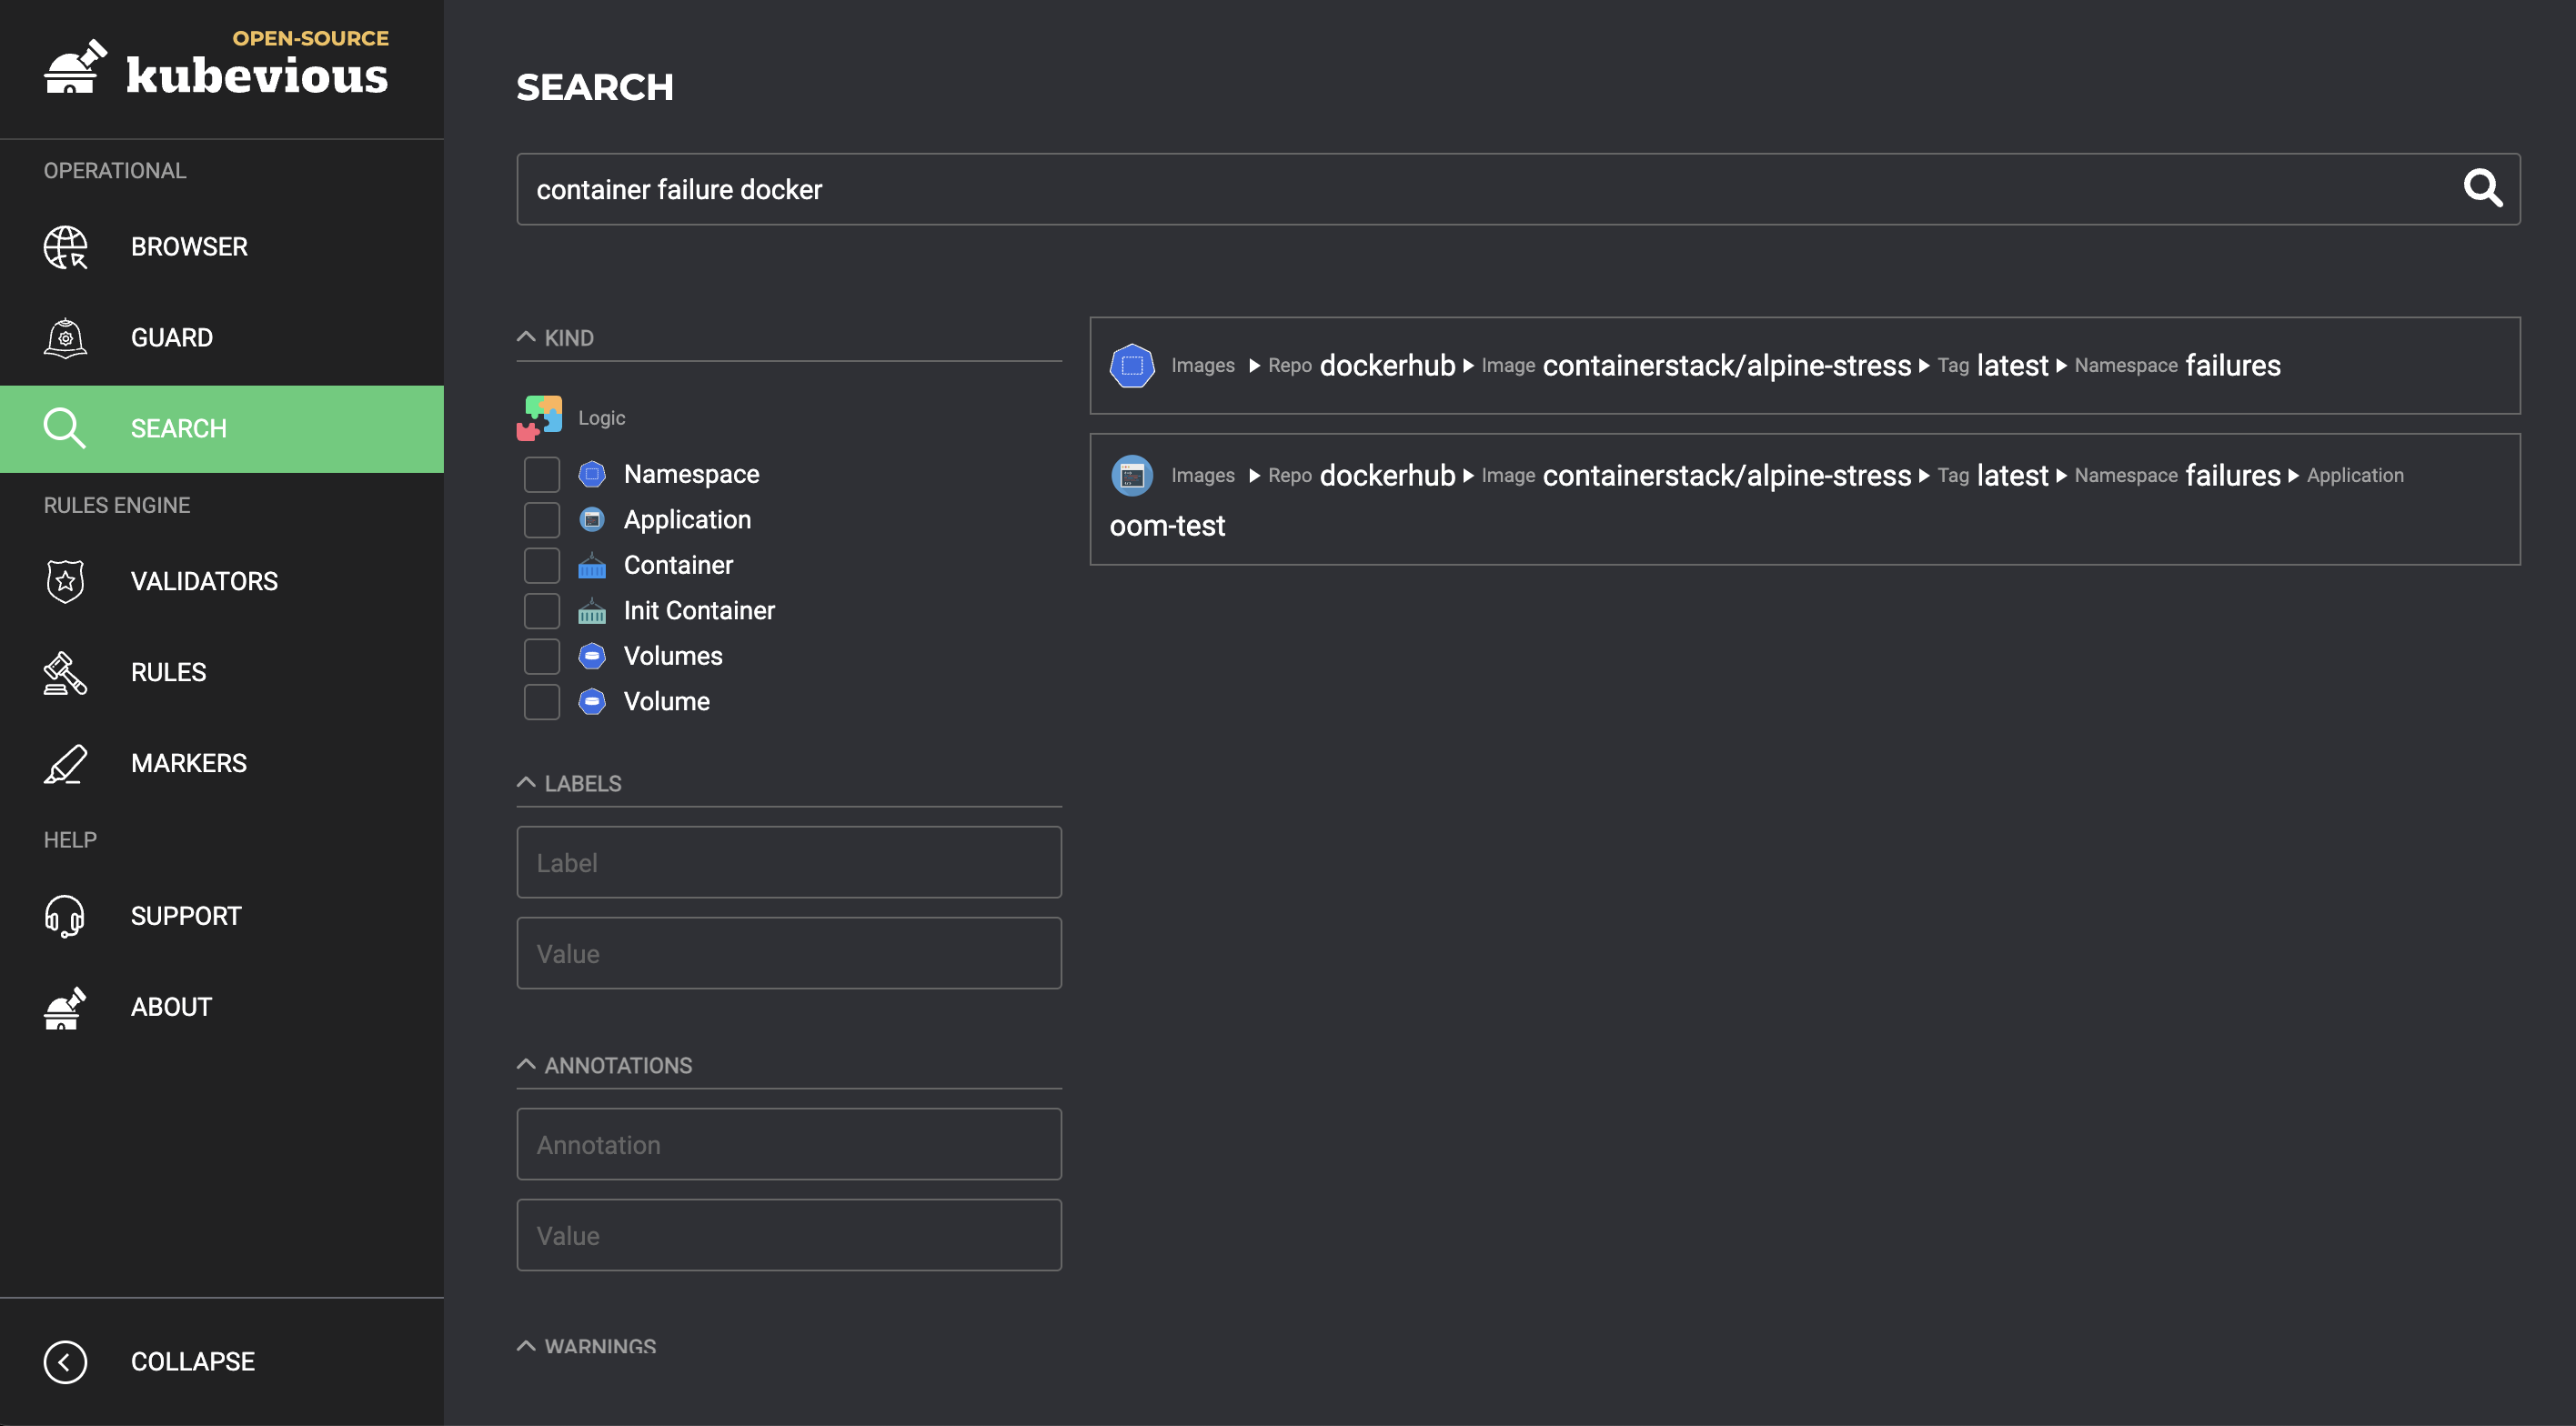
Full-text search
You can easily search through your resources by using the universal search functionality. You can enter your query using natural language, and the tool will find all possible matches.
Correlated views
Kubevious offers a number of correlated views to help you better understand the relationships between resources and correctly estimate the impact of your changes. There are a number of things you can do in this regard, including:
- Identify blast radius: Identify resources in the cluster that share a configuration
- Identify radioactive workloads: Identify apps that have excessive permission, like privileged containers, host network, and so on
- Correlate RBAC and NetworkPolicies: Identify all network policies, ServiceAccounts, Binding, and Roles that link to an application, and correlate them in a single view
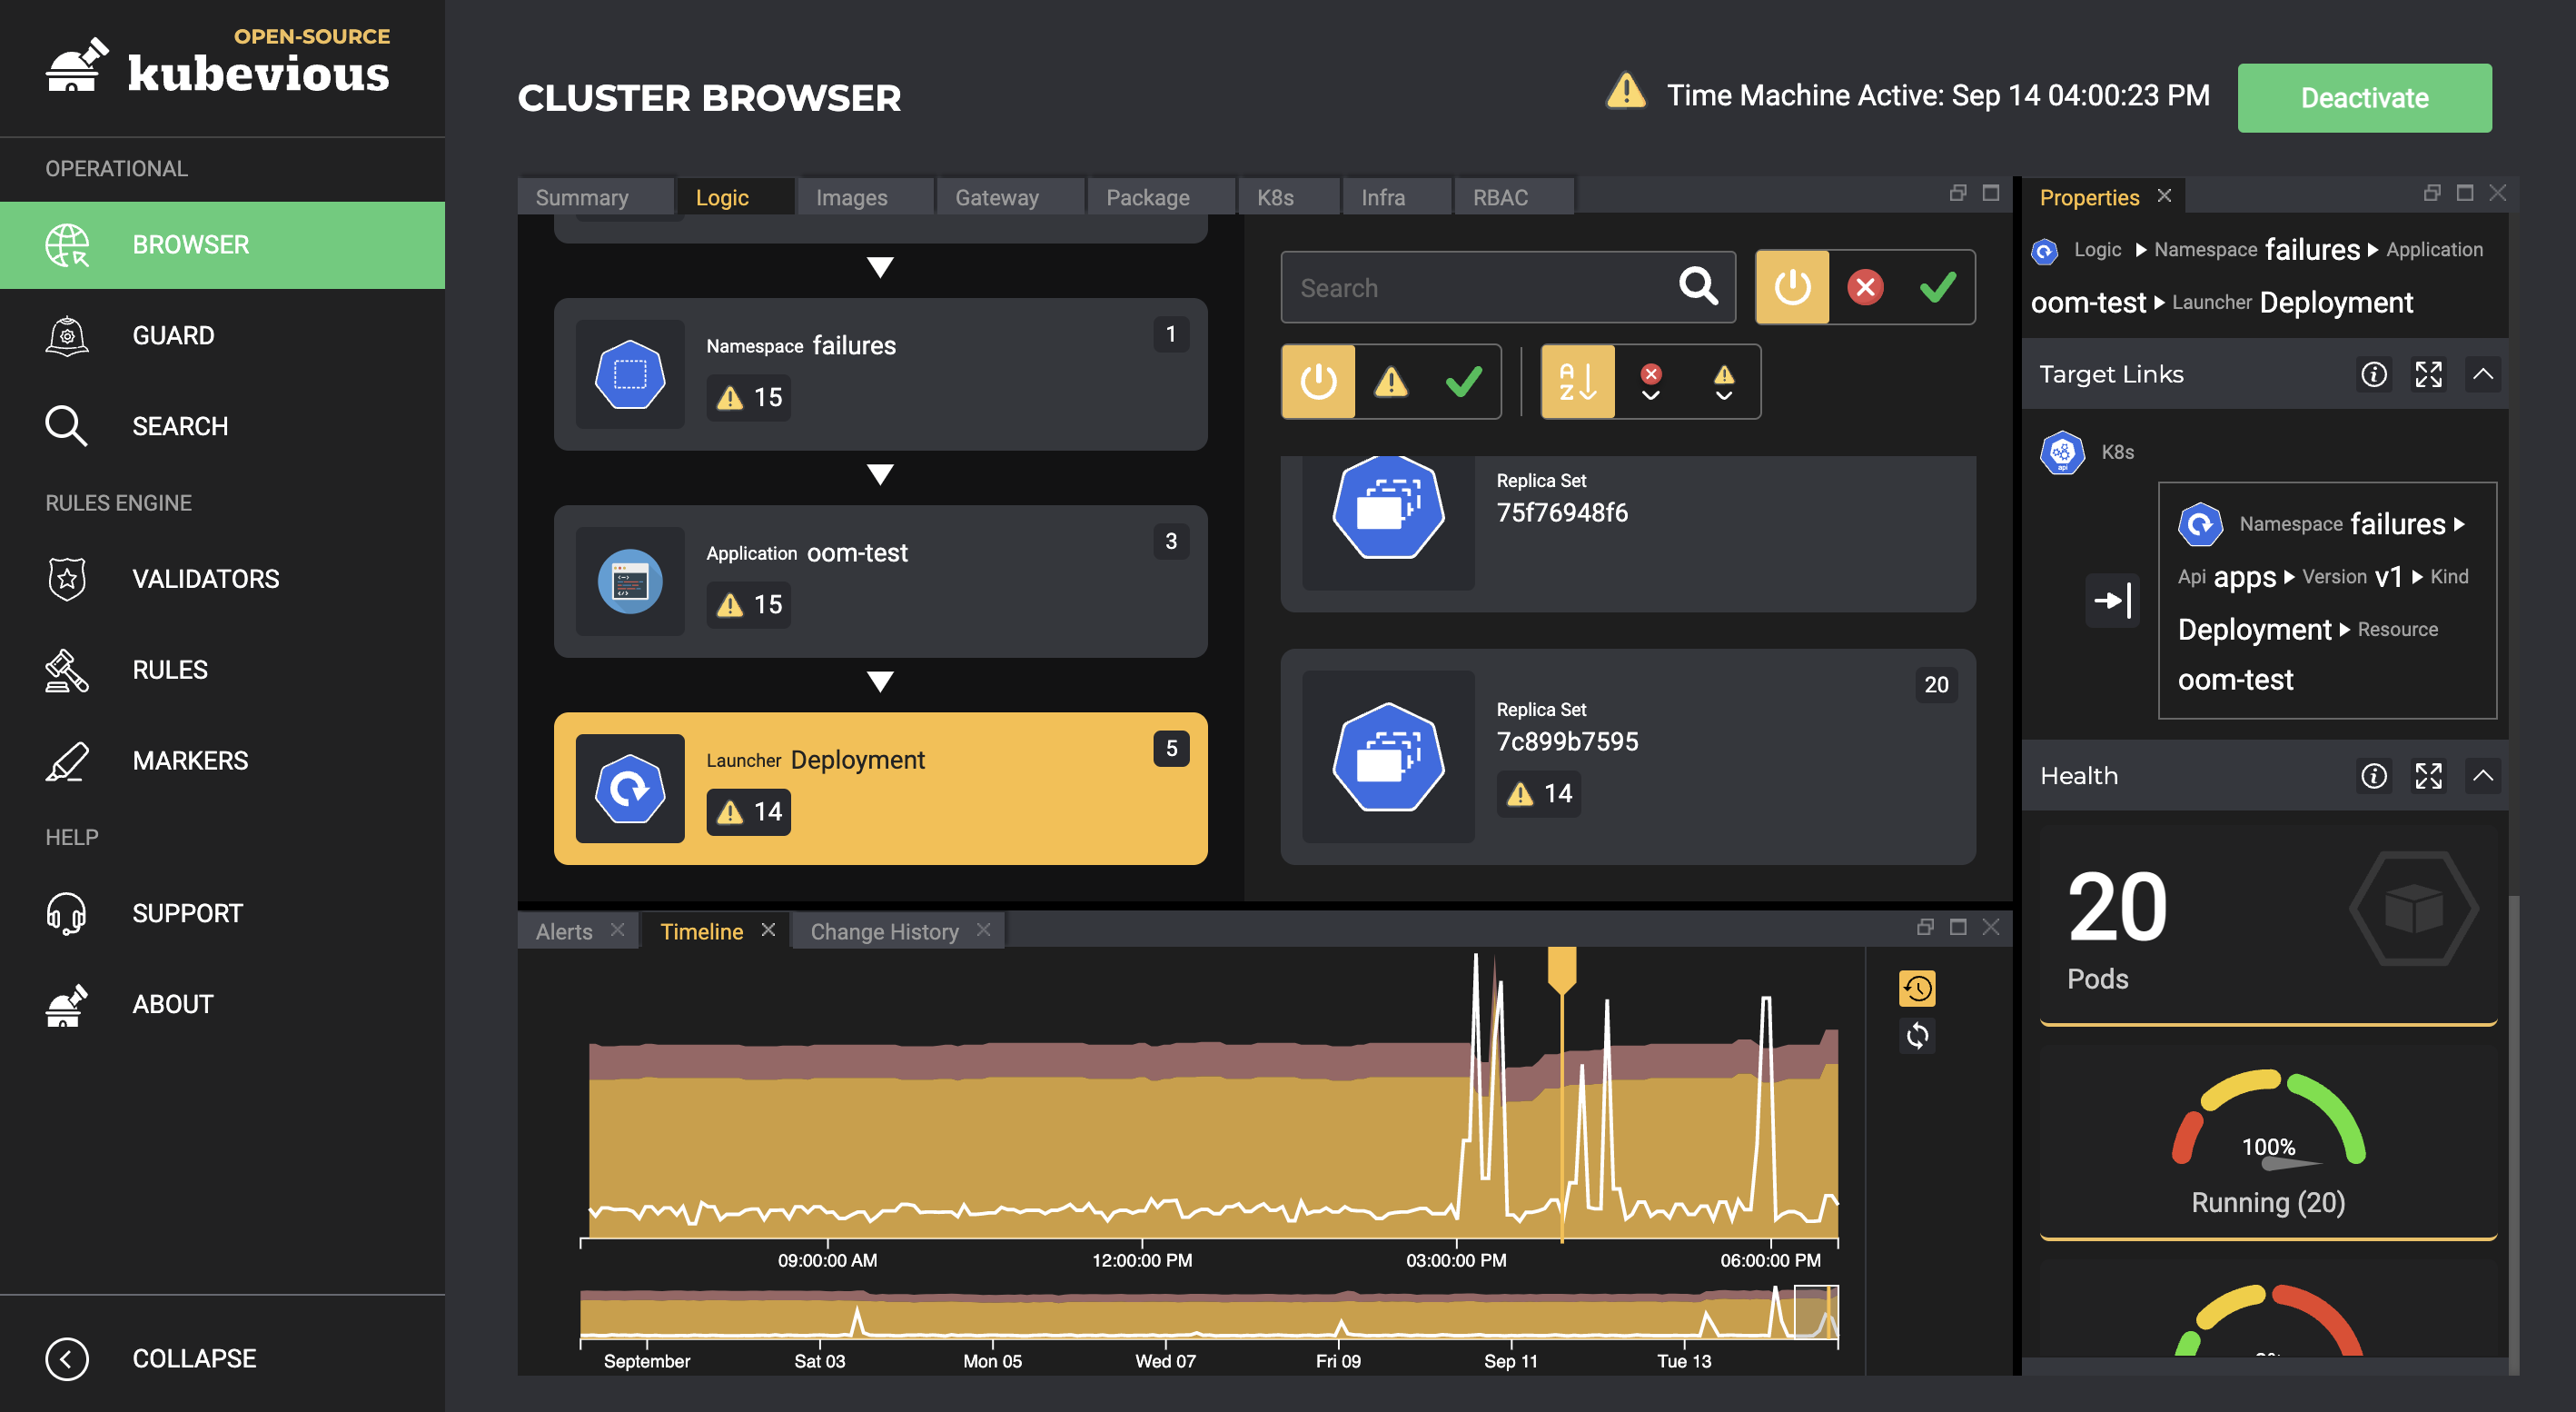
Time machine
The time machine is an innovative Kubevious feature that allows you to easily look into the history of your cluster’s activity.
You can click on any point in the time machine to activate it for that instance, and you can then browse the alerts and health of your resources as they were at that time.
Pricing
Kubevious offers a free open-source plan that you can use to set up a dashboard for one cluster. It includes all the features we’ve discussed so far and can be set up within minutes.
If you’re looking to use Kubevious on multiple clusters, you can start with the Ronin plan, which can support up to 5 clusters and offers a cloud-based dashboard along with support for up to 3 users to collaborate .
If you’re looking for advanced features like role-based access control, continuous CIS benchmark validation, and continuous validation scanning, you should check out the Samurai plan — it offers the aforementioned features, along with support for up to 10 users to collaborate .
And if you’re deploying Kubevious in an enterprise-level environment, you can check out the Shogun plan, which offers everything in the other plans, as well as features such as unlimited data retention, notifications integration with PagerDuty, and support for unlimited clusters and users.
To learn more about pricing details, talk to their sales team.
Why should you use Kubevious?
Now that you know what Kubevious is and how it works, here are a few reasons you should consider adding it to your K8s arsenal:
Makes change impact analysis easier
With many powerful analysis and investigative features, Kubevious makes it easy to understand the impact of changes that you make around your K8s clusters. The time machine feature can help you visualize the quality of changes by showing the number of alerts that have come up over time. Other features like blast radius and radioactive workloads can help you identify the resources that will be affected if a particular configuration is changed — so you’ll make better decisions, which will lead to fewer disruptions.
Enables complex custom validation
Most dashboards throw warnings and errors, but rarely will a dashboard tell you if a resource is a “spy.” With Kubevious, you have absolute control over how your resources are validated and marked, and if you pair it with the time machine, you can visualize your resources going through various categories and improving over time.
Reduces downtimes
With advanced features like Guard and change impact analysis, you can make changes to your clusters with confidence. With each change, you’ll be fully aware of what resources it will impact, and whether or not it follows K8s best practices. This will prevent you from pushing changes that lead to misconfigurations or downtimes.
Alternatives to Kubevious
If Kubevious doesn’t seem to fit your requirements, there are a few other tools that you can look toward:
Lens
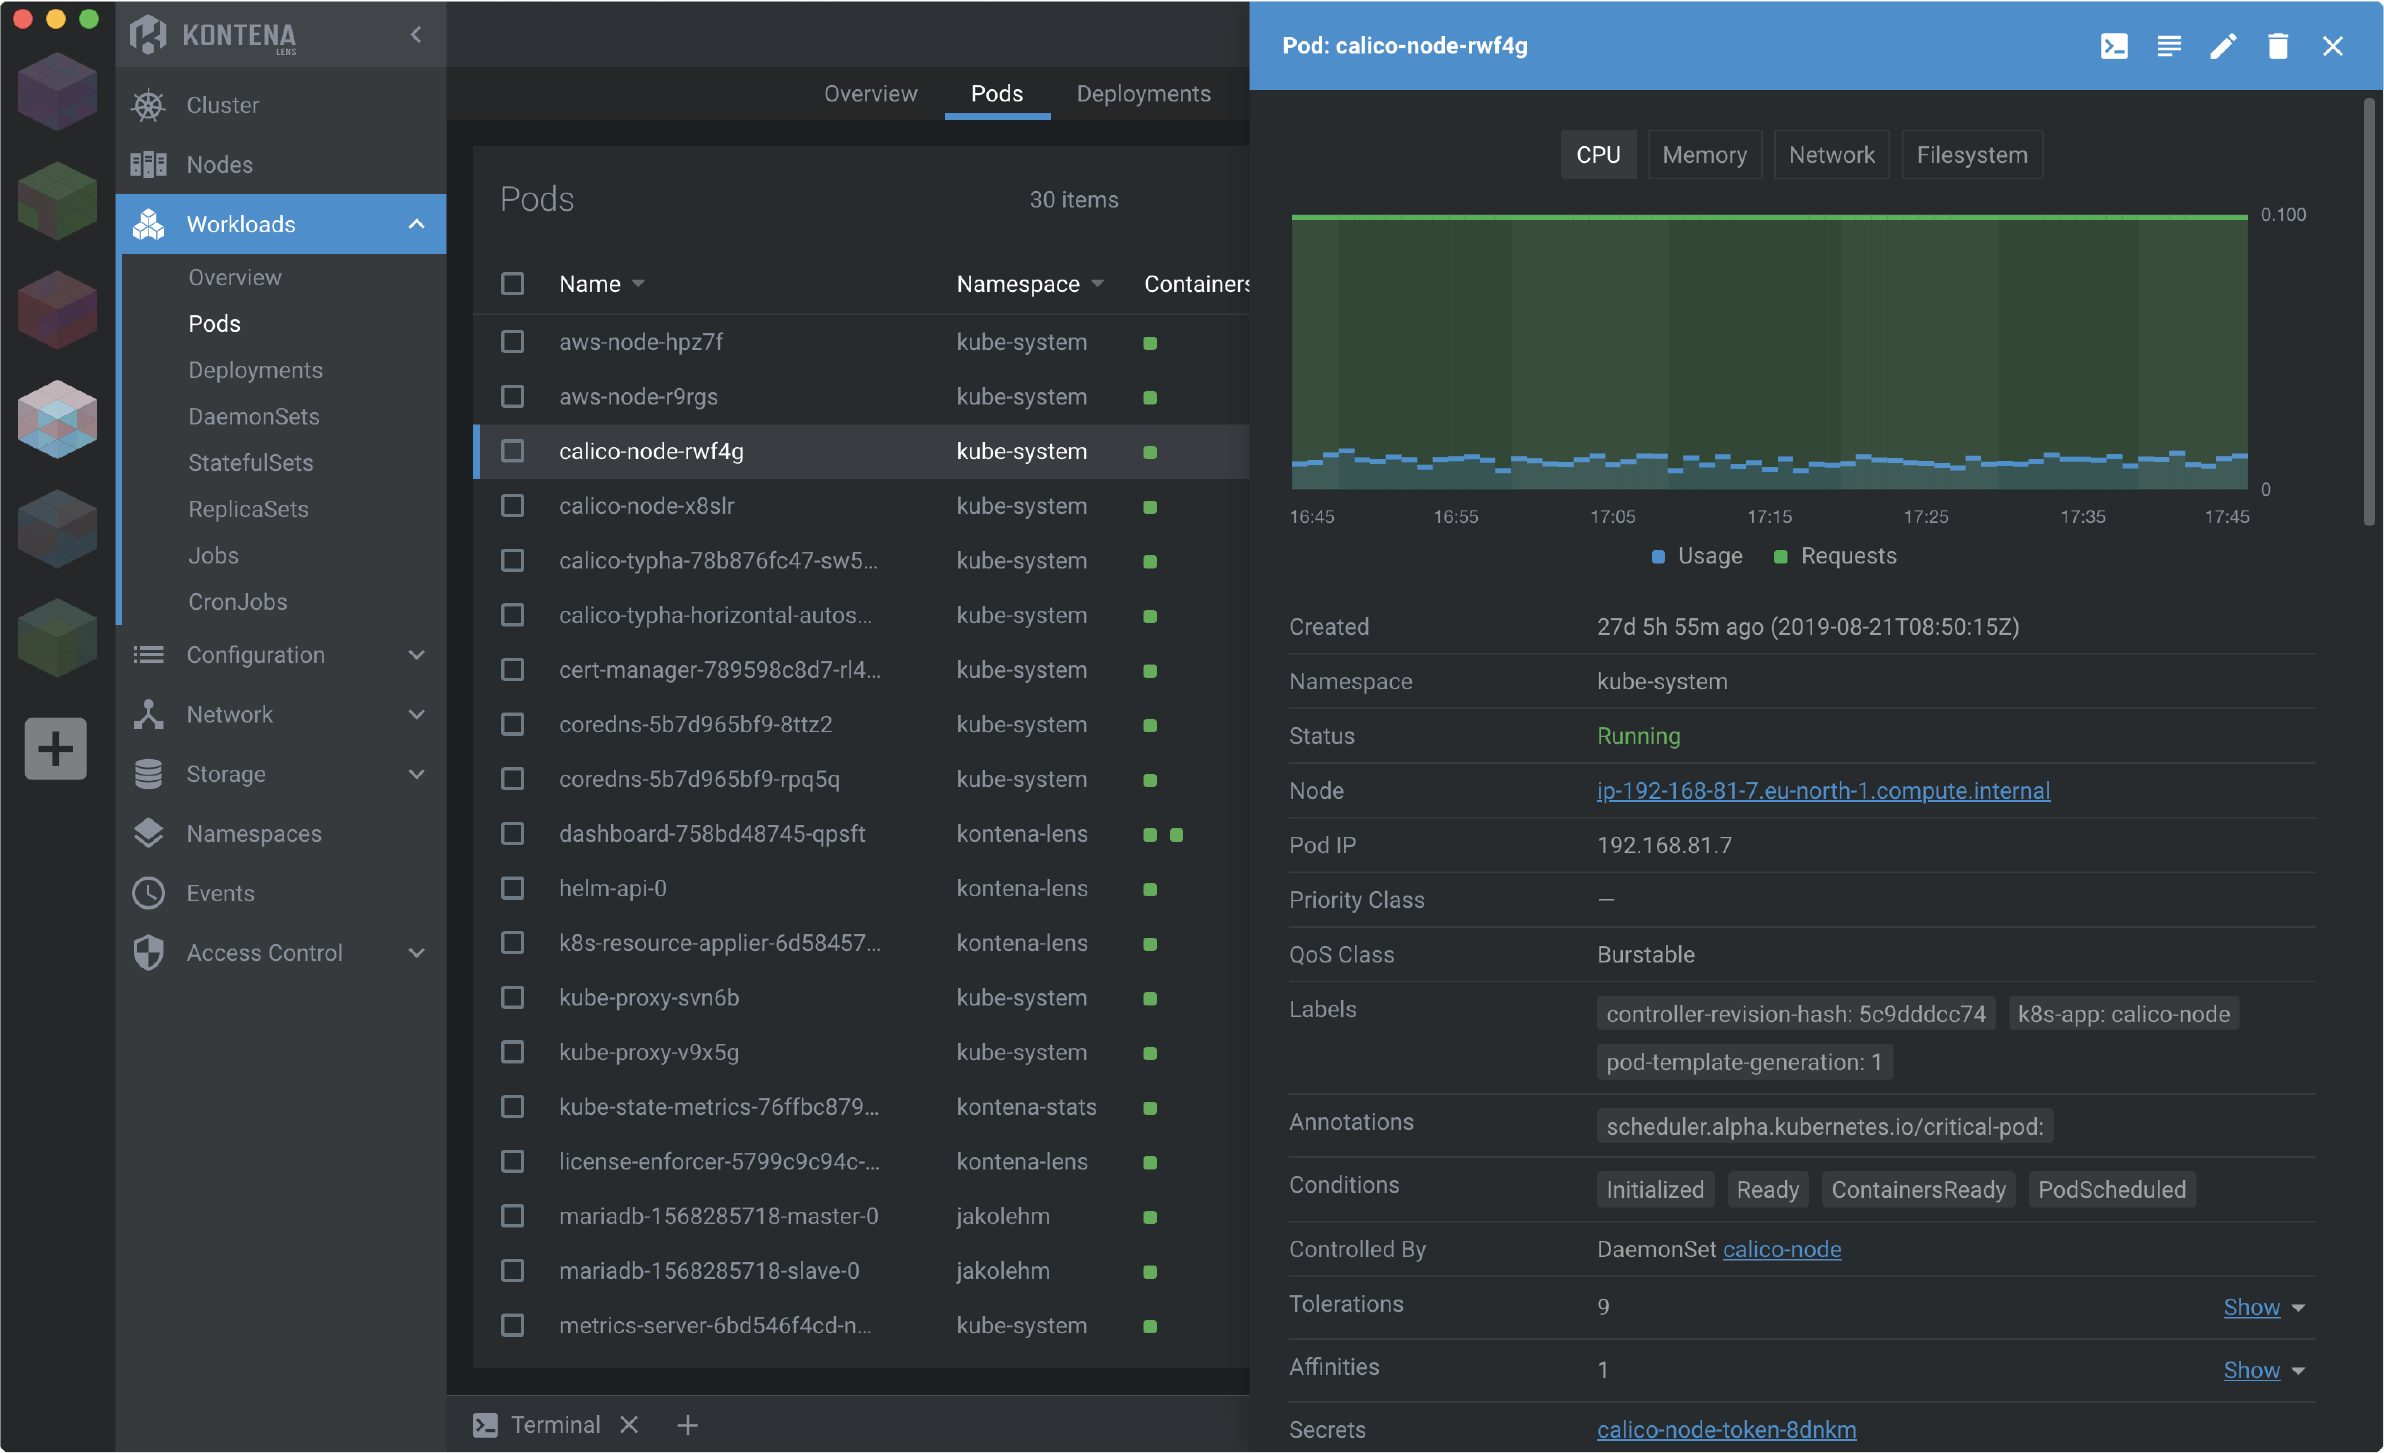
Lens offers you deep visibility into your Kubernetes clusters. Unlike Kubevious, Lens is a full-fledged IDE for Kubernetes. You can even completely replace the kubectl tool with Lens. Lens provides you with an overview of all K8s resources directly in the IDE. It allows you to easily switch between contexts as well.
If you’re just starting out with a Kubernetes cluster, Lens might sound like overkill. However, if you manage multiple clusters and are looking for a robust GUI to replace the terminal-based tools, Lens might just be right for you.
K9s
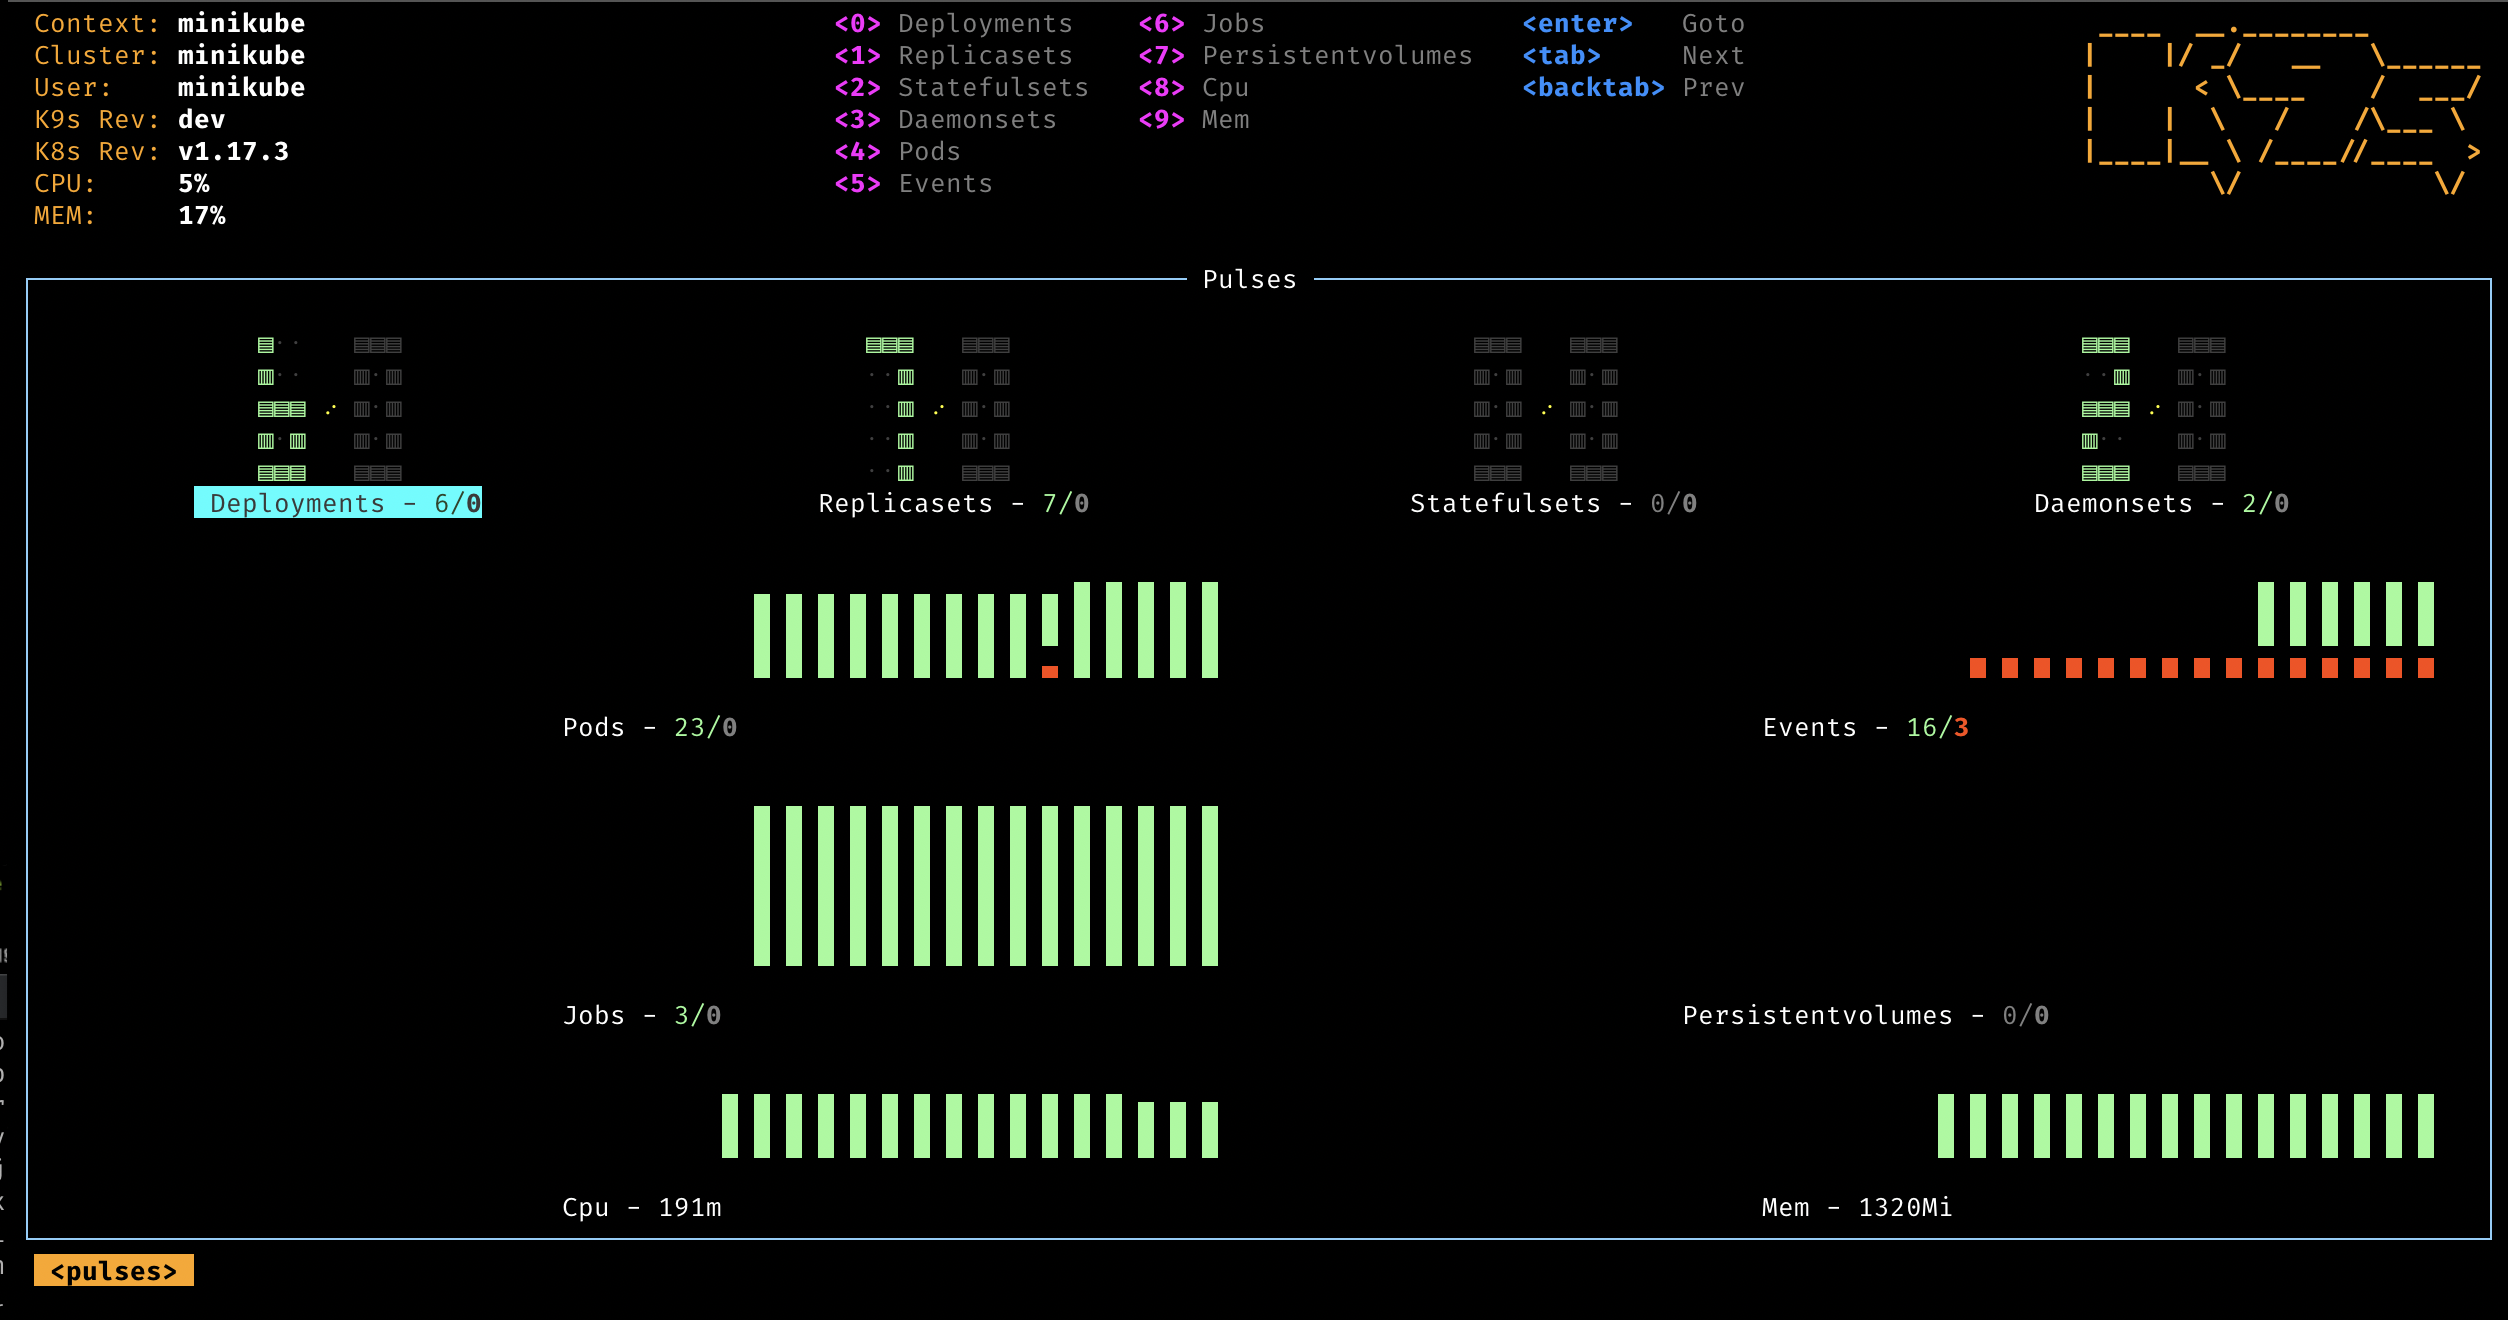
K9s is a terminal-based dashboard for people who prefer the terminal over GUIs. You can view the entire status of your Kubernetes cluster in a semi-graphic method inside your terminal. You can easily make your way through cluster resources, dependencies, RBAC, and more without leaving your terminal.
The issue with K9s is that it can work with only one cluster at a time. Also, the current design of K9s is probably as good as it can get, due to the fact that it is entirely dependent on the terminal.
Octant
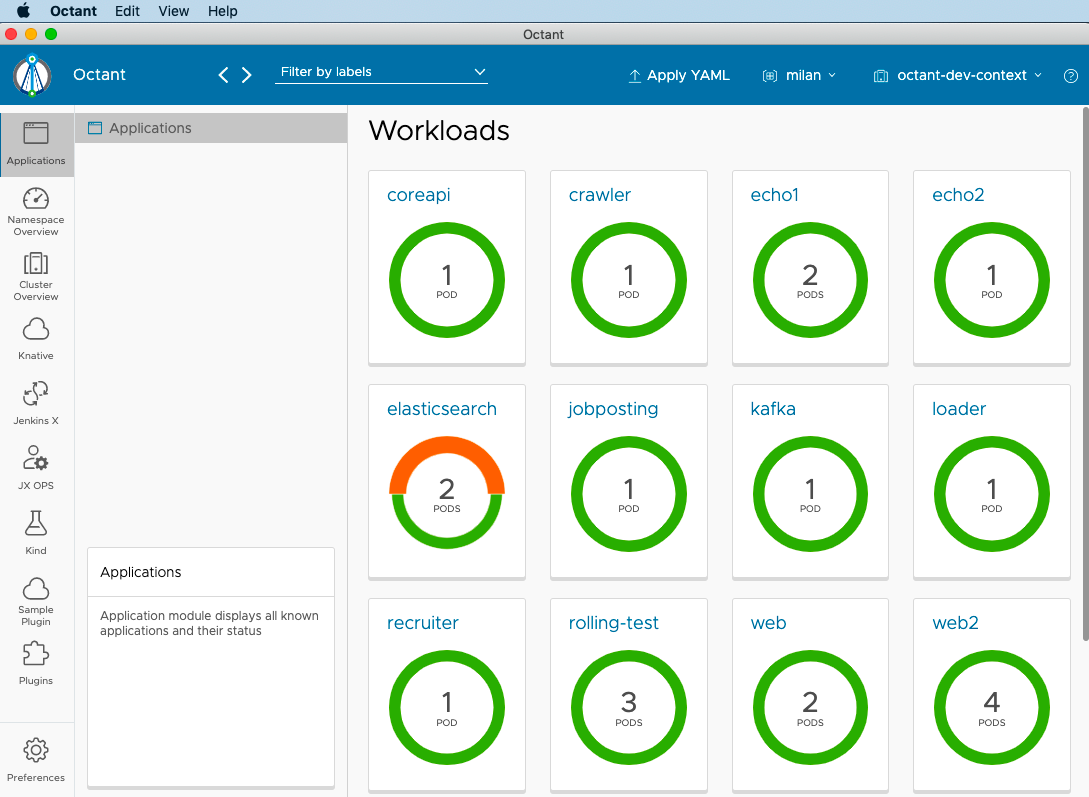
Octant is an open-source dashboard for Kubernetes. It is one of the most popular dashboards in the K8s community. Extensibility is a great selling point of the tool, as it enables you to create your own plugins in the Go language, to extend its functionality and connect to external services.
Octant is great if you’re looking for a complete dashboard solution that can do much more than just show metrics. It integrates well with the pre-commit phase of your DevOps process and is open-source, so you can use it in projects of all sizes.
Final thoughts
As an alternative to the classic Kubernetes dashboard, Kubevious does a great job of providing you with complete visibility into your cluster. The ability to run it outside of the target cluster empowers your development teams. Kubevious does a great job at providing you with an all-around dashboard.
If you’re looking for a dashboard solution that focuses only on insights into your apps and does a great job at it, Kubevious is the tool for you. If you’re looking for a solution that can match analytics with a GUI-based control panel for your clusters, Kubevious might not be the best choice.
If you're looking for a maintenance-free platform that makes it even easier to monitor your clusters in real time, then Airplane is a good solution for you. Airplane is the developer platform for building internal tools. With Airplane, you can transform scripts, queries, APIs, and more into powerful workflows and UIs. Using Airplane Views, you can build a React-based monitoring dashboard that makes it easy to manage and gain visibility into your Kubernetes clusters.
To build your first dashboard within minutes, sign up for a free account or book a demo.