One of the tools almost every business looks to build eventually is a dashboard that measures the key performance indicators (KPIs) of their business. And while this type of dashboard can be very useful, it also has the potential to be distracting or even detrimental to your business if the wrong metrics are selected or if it’s implemented poorly.
In this article, we’ll take a look at how to build a KPI dashboard with Airplane that pulls in metrics from multiple different pieces of software so you can keep track of all your important data in one place.
If you’re looking for the code behind this example, check out the Airplane Blog Examples GitHub repo.
How to select KPIs to track
When building a KPI dashboard, it’s important to decide up front which metrics are the most crucial. The best way to do this is to decide who the key users of the dashboard are going to be.
For example, if you’re building a dashboard for the marketing team, metrics from places like Fathom Analytics (to track website traffic) and Facebook Business Manager (to track ad spend) might be important to include. However, if you’re building a dashboard for the finance team, metrics from places like Stripe (to track revenue or churn) or Quickbooks (to track overall business financials) might be more relevant.
To avoid users of your dashboard getting overwhelmed by the amount of data presented, choose 3-5 important metrics and consider linking out to the full data sources from your dashboard. This way, anyone wanting to investigate more deeply can easily get some more detail.
Track down your data
Before you can start building your KPI dashboard, you’ll need to choose the metrics you want to track and figure out where that data currently lives. If it lives in software and can be queried via an API call, then you’re in a great position to move forward. However, if your data lives in software that isn’t web-based, doesn’t have an API or lives in some other manual process, you’ll have to figure out an extraction workflow that gets your data into a database or behind an API that your dashboard can access.
Once you’ve decided which metrics are most important for your dashboard and how you’re going to access data, you’re ready to get started.
For the purposes of this tutorial, we’ll be building a general KPI dashboard with 3 components:
- Web Traffic - We’ll pull in data from Fathom Analytics to show some historical pageview data for our website. If you use Google Analytics instead, take a look at how we built a Google Analytics-specific dashboard for code samples and inspiration.
- Revenue Data - We’ll pull in revenue data from Stripe to show off the 10 most recent sales of your product.
- Customer Support Data - We will query Help Scout to display the number of open support threads across our organization to make sure we’re staying on top of customer support.
These are just the examples that we’ll use, but with Airplane’s code-first approach, you can pull in relevant KPIs in a variety of ways, even using SQL queries to pull metrics directly from your database.
Build your KPI dashboard
For this KPI dashboard, we’ll be using Airplane’s Tasks and Views. Tasks are functions (we’ll write ours in Javascript) that can run arbitrary code to fetch the data that we need. In addition to supporting Javascript, Tasks can also be REST API calls, SQL queries, Python scripts and more. Views, on the other hand, are what we’ll use to display the data that our Tasks produce. Airplane comes with a pre-built component library that allows you to render many different types of UI elements just by passing in the data that you want to display and we’ll take advantage of those throughout this tutorial.
Prerequisites
Before you get started, you’ll need to sign up for a free Airplane account and download and install the Airplane CLI. This is how we’ll develop our dashboard locally before we deploy it to Airplane for the rest of our team to use.
Create our View
Once we have that installed and set up, we can start our project by creating a View. From the directory that you want to contain your project, run airplane init on the command line. Select the option to create a View and answer the rest of the prompts. It should look something like this:
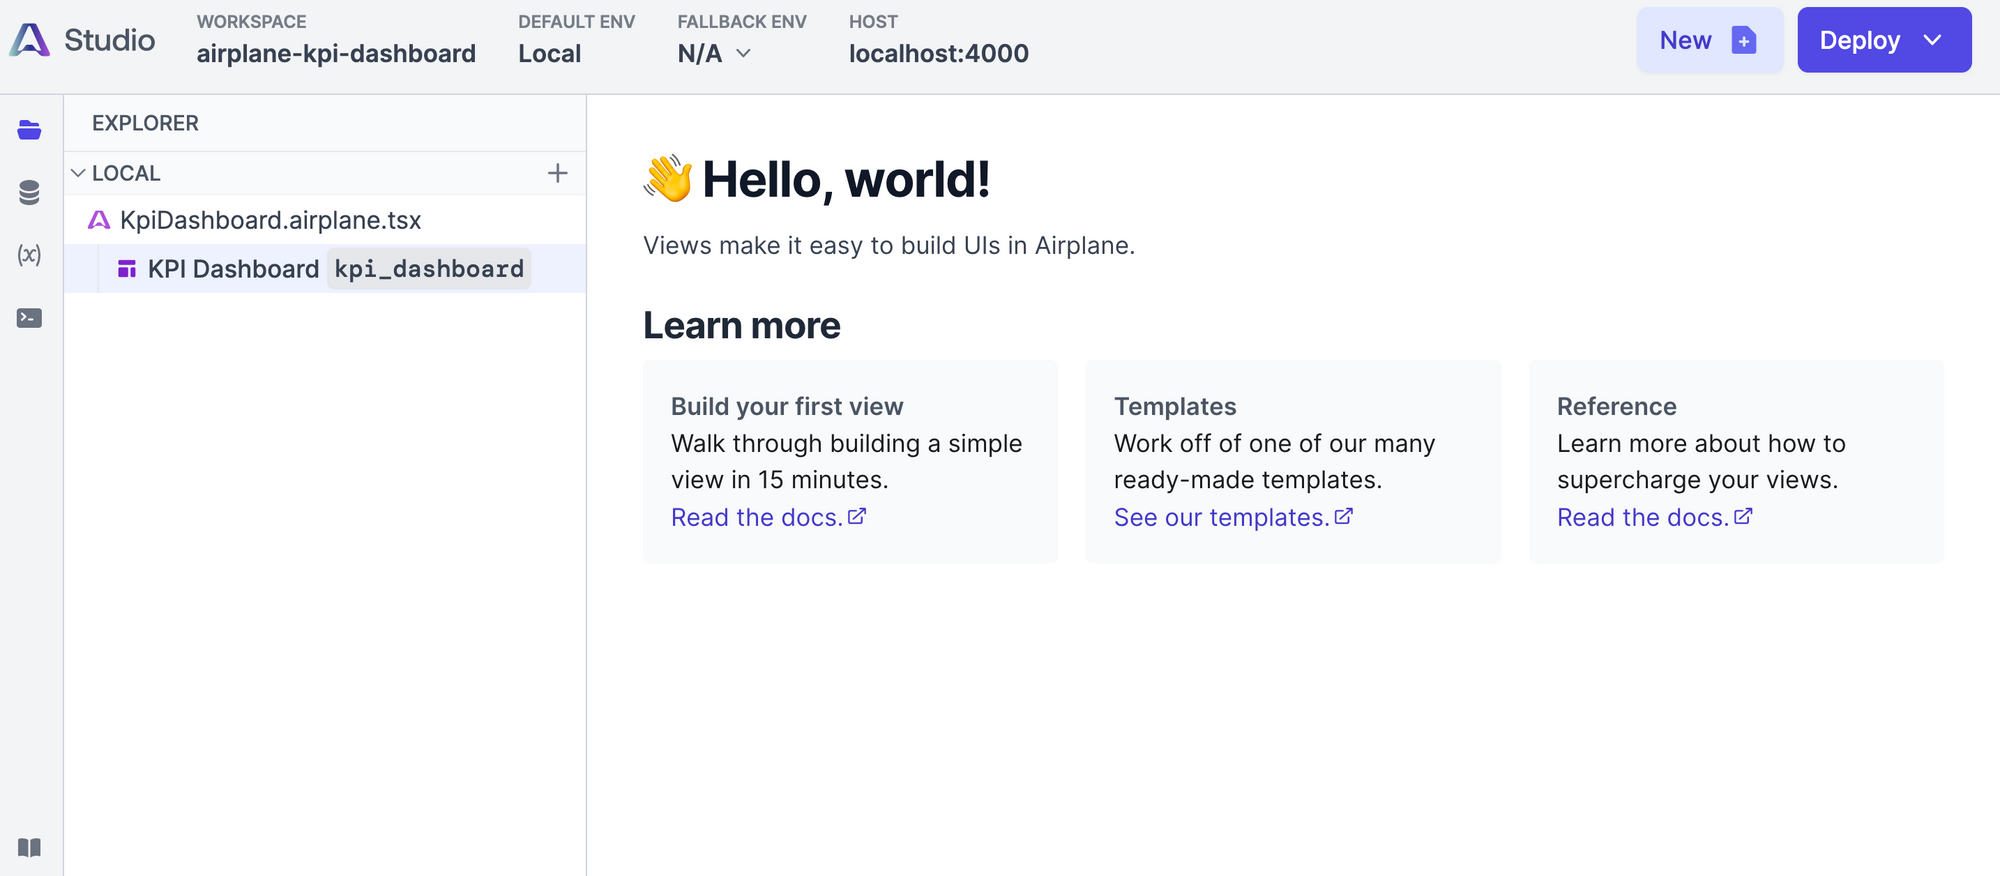
After you see that output finish, you can run airplane dev and launch your View in your browser. You should see your newly-created View ready to be populated with data!
Querying analytics data
Now that we have our View all set up, we need to actually query some data to put in it. First, we’ll query Fathom Analytics to get pageview data for our site going back a few months.
To get started, head over Fathom and create a new API token. This is how we’ll authenticate with the API to get the correct pageview data. You can create this token as a read-only key, as we’ll only be querying data and not adding any.
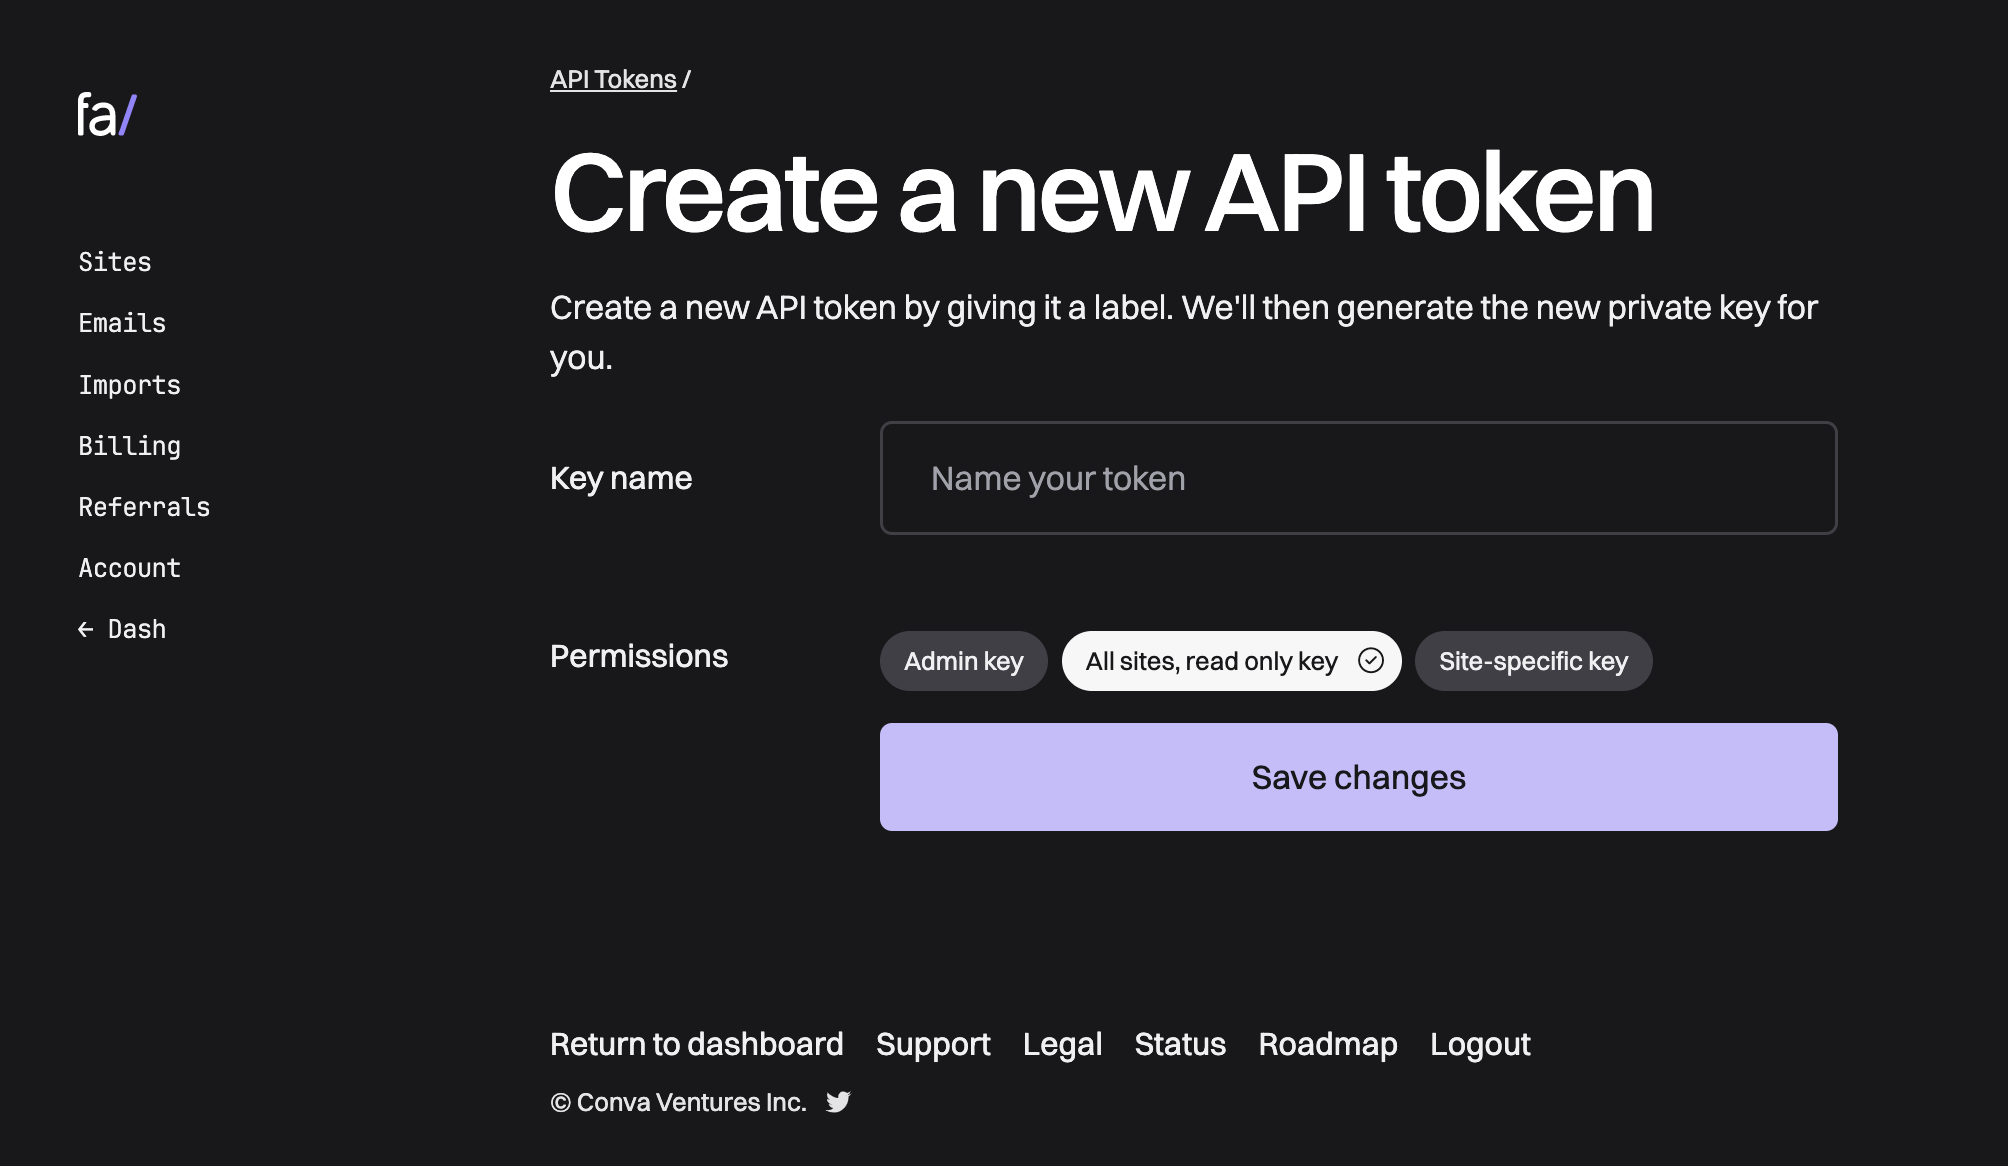
Once you have your key, make sure it’s saved somewhere because we’ll need it when we actually create our Task.
You’ll also want to get the site ID for the site that you want to query (it should be 8 characters) and save that for later as well.
Now that we have our key, run airplane init again, but this time, select Task when prompted.
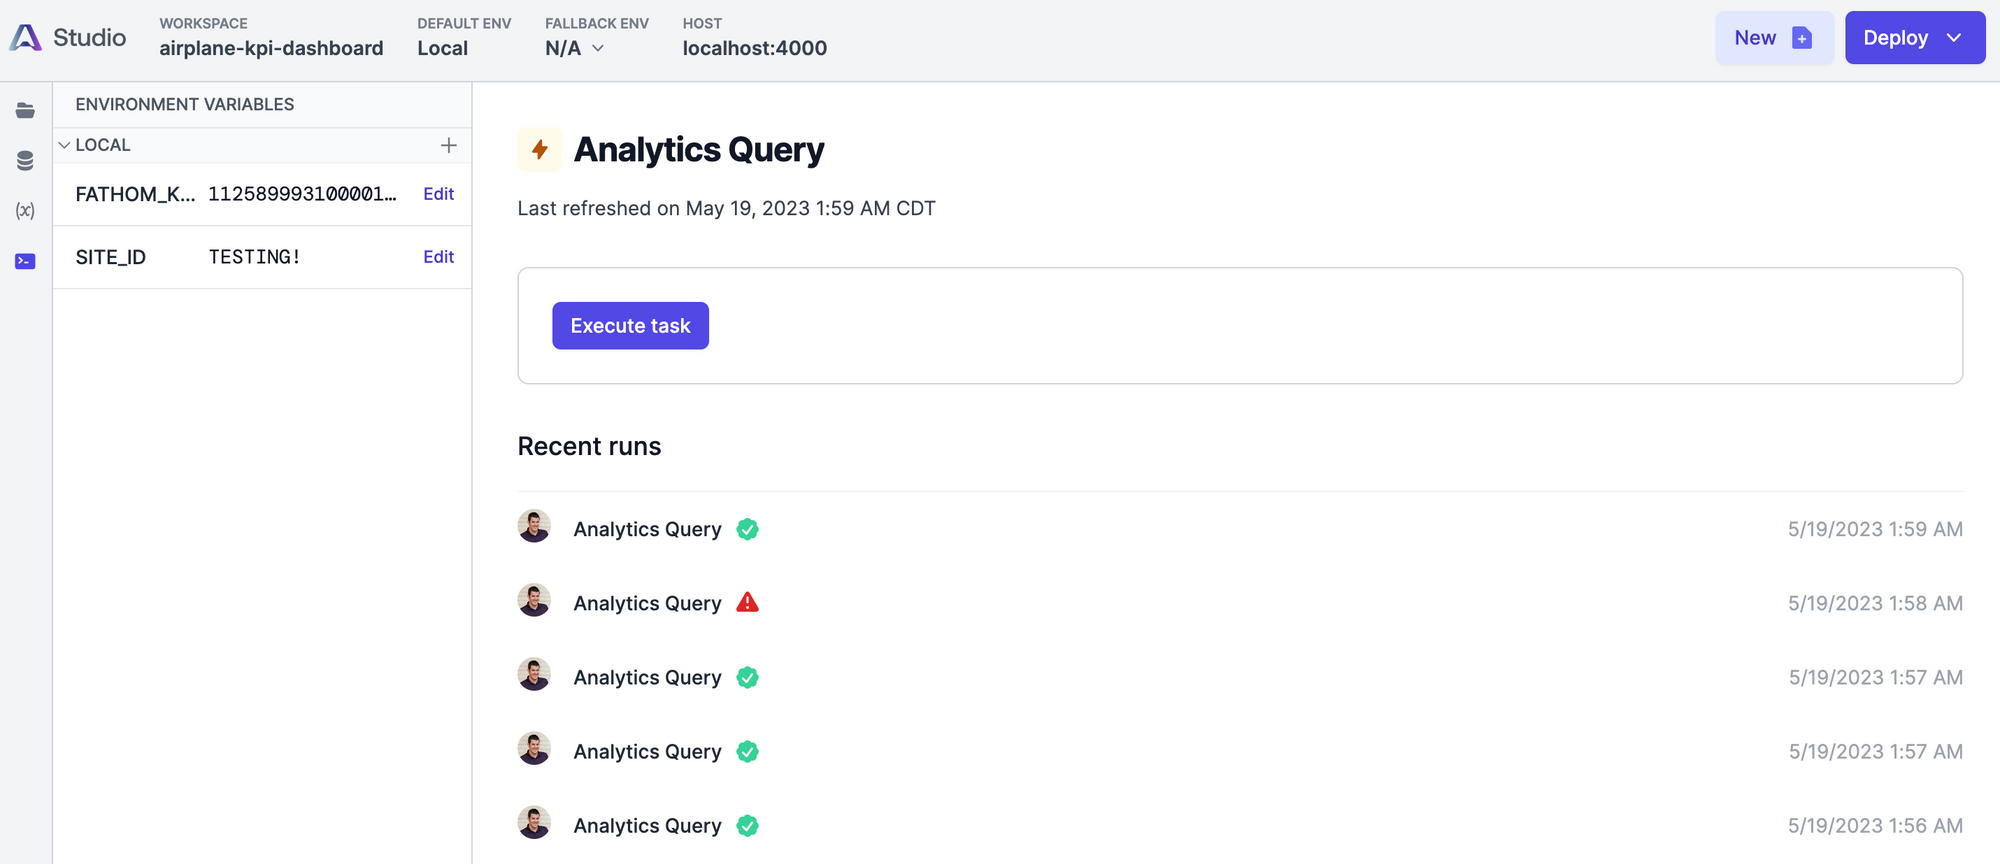
Since we’re already running airplane dev you should now see your Task in the Studio view.

Executing the Task as-is should give you some sample output. After confirming that your Task was created successfully and can be run from within the Studio, you can fill in your Task (in analytics_query.airplane.ts), like the following:
You’ll notice that the Fathom API key and your Site ID that you gathered earlier are not part of this code, but rather referenced as environment variables. Store these as environment variables inside your local Airplane Studio and you should be able to run the Task successfully!
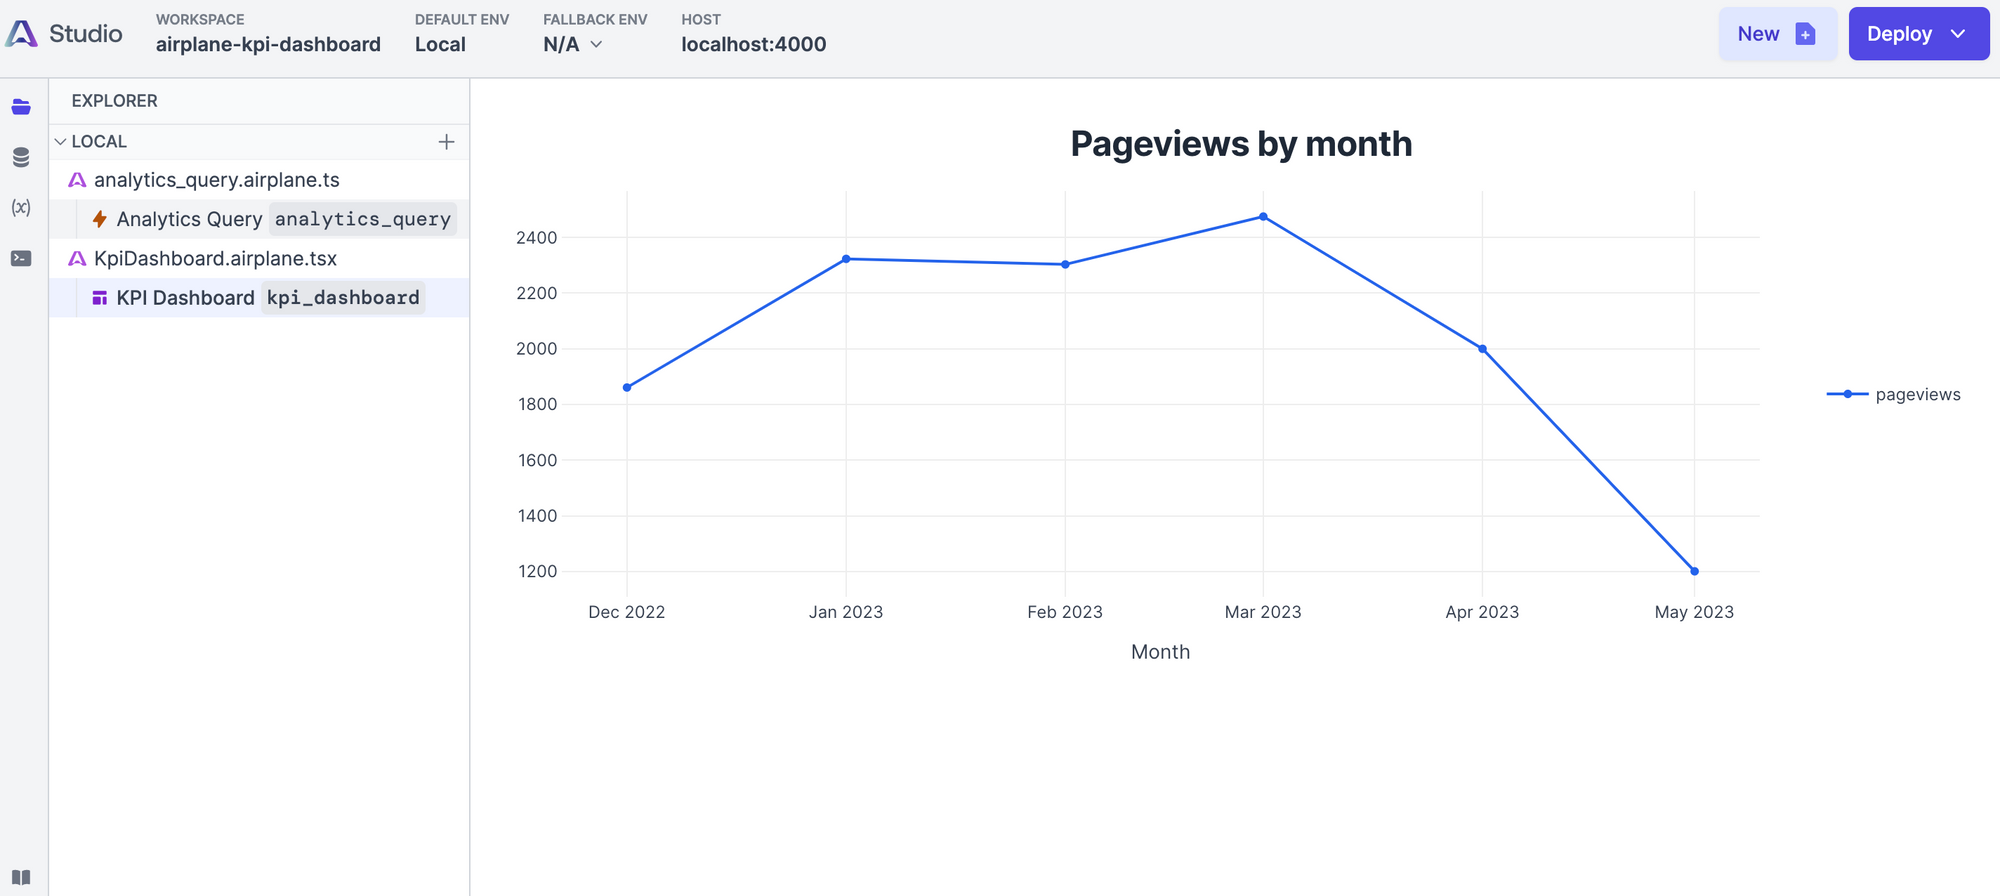
Now that your Task is outputting data, it’s time to get this data integrated into your View. You can remove much of the placeholder code that exists in your View and replace it with something that looks like this:
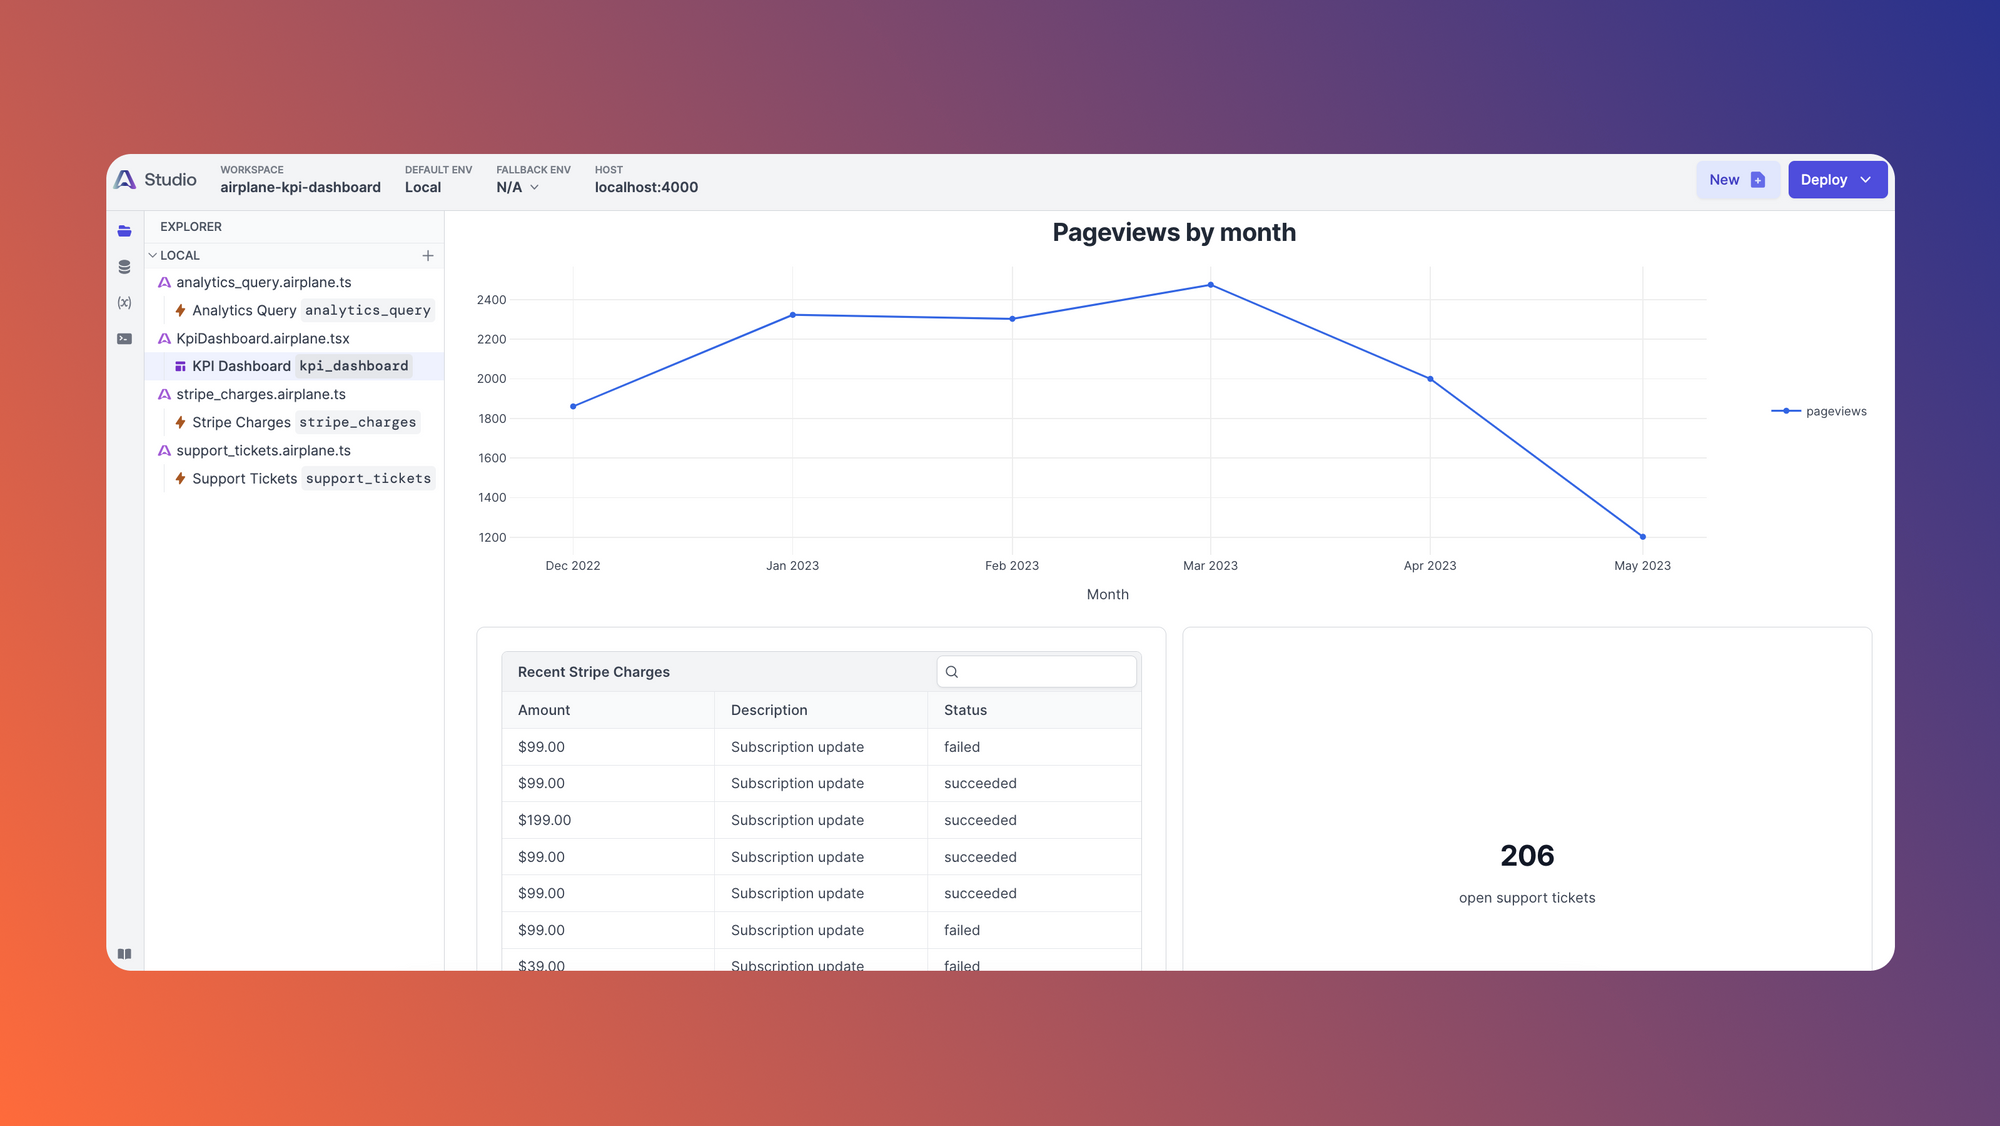
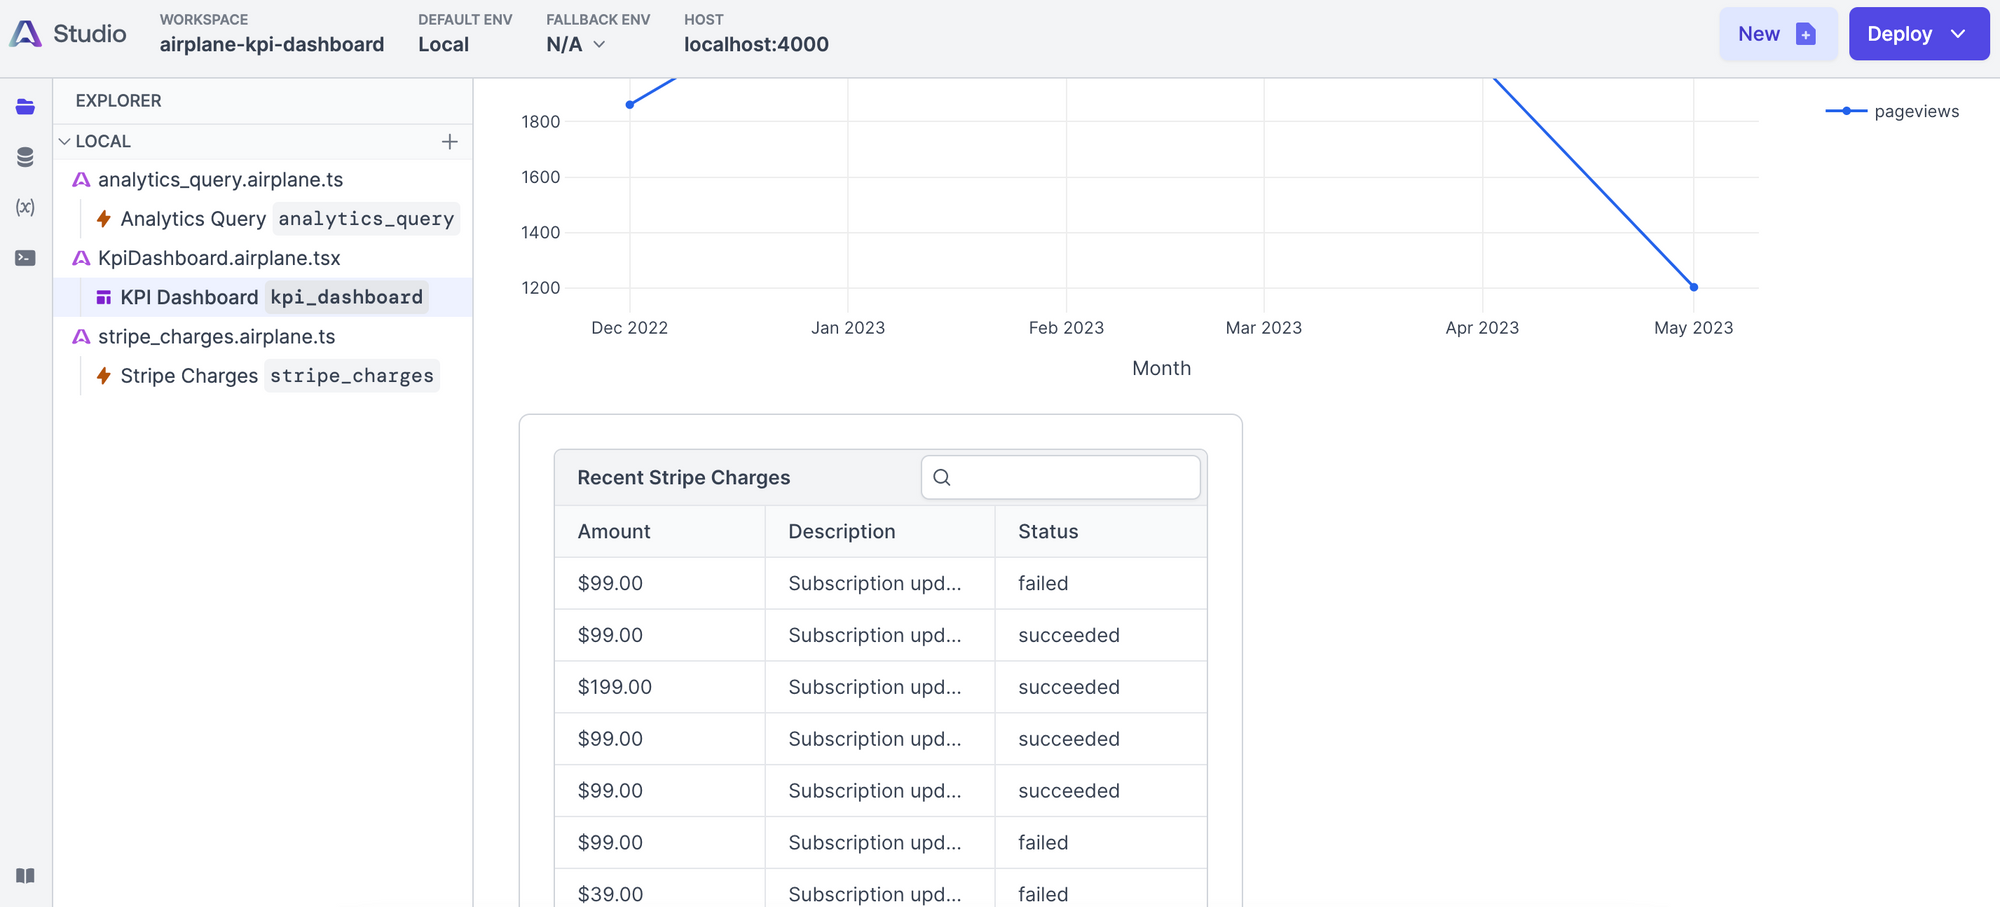
With that in place, you should see your pageview data coming through in your View!
Adding a Stripe component to show recent sales
Now that we have analytics data displaying in our dashboard, let’s pull in some financial data and show the 10 most recent sales of our product. To do that, we’ll query the Stripe API.
Before we get started with this integration, you’ll need your Stripe secret key, stored as an environment variable just like we did with our Fathom API key.
Once you have this key saved as an environment variable, run airplane init to create a new Task, filling out the prompts that it gives you.
Before you start filling out your Task, include the Stripe NPM package to make querying the API easier by running npm install stripe --save. Once you have done that, you can fill out your Task like this:
This will return a list of the 10 latest attempted credit card changes from Stripe with some information about each.
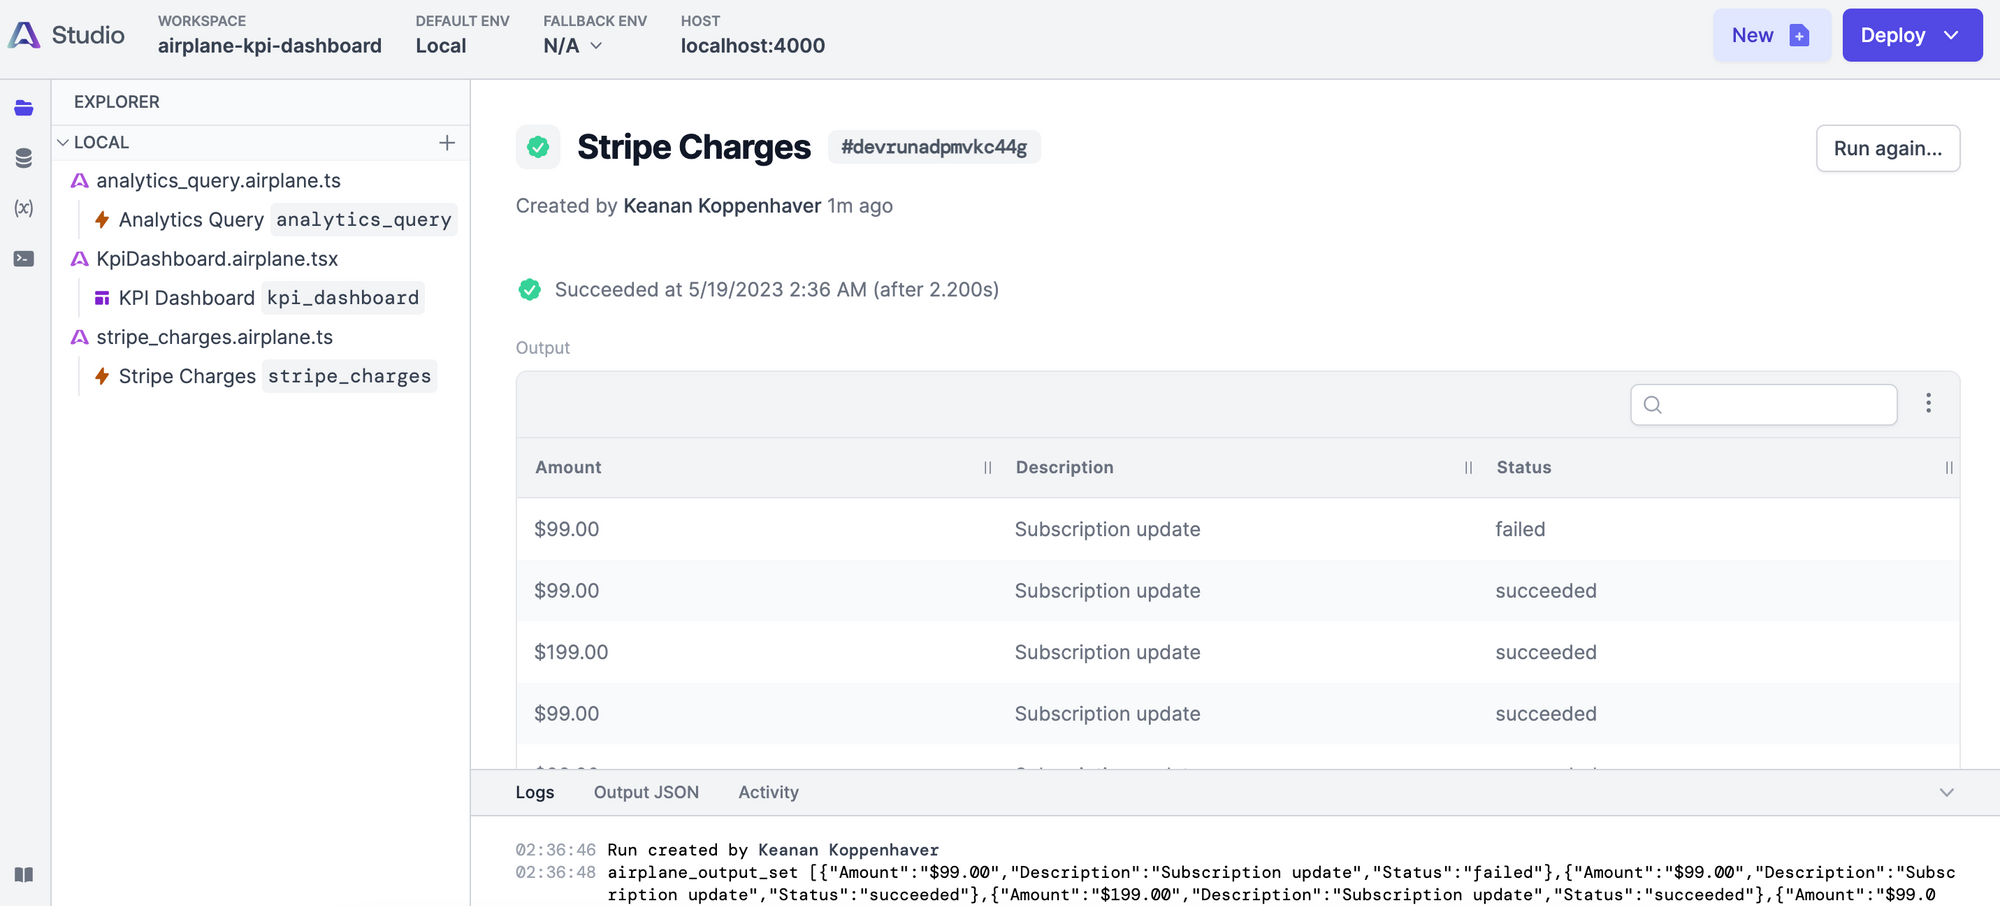
Once you have this data being returned in your Task, you can add it to your View as well.
And with that, our dashboard is really starting to come together!
Add the customer support component
To round our our dashboard, let’s add a Card that shows the number of open customer support threads. This is a helpful metric to keep track of that helps make sure all our customers are getting the help they need.
To start, log in to your Help Scout account and navigate to your profile. Under My Apps you can create a new “app”, which will be what holds the credentials you will use to authenticate to Help Scout. Make sure to save both your App ID and App Secret into environment variables in Airplane. In addition, head over to the Settings page for the Mailbox you want to query to get the 5 digit Mailbox ID, which we’ll need to store as an environment variable as well.
Then, when you’re ready to get started, create a new Task with airplane init and follow the prompts. Because Help Scout uses an OAuth flow to authenticate, you’ll have to fill in your Task like the following:
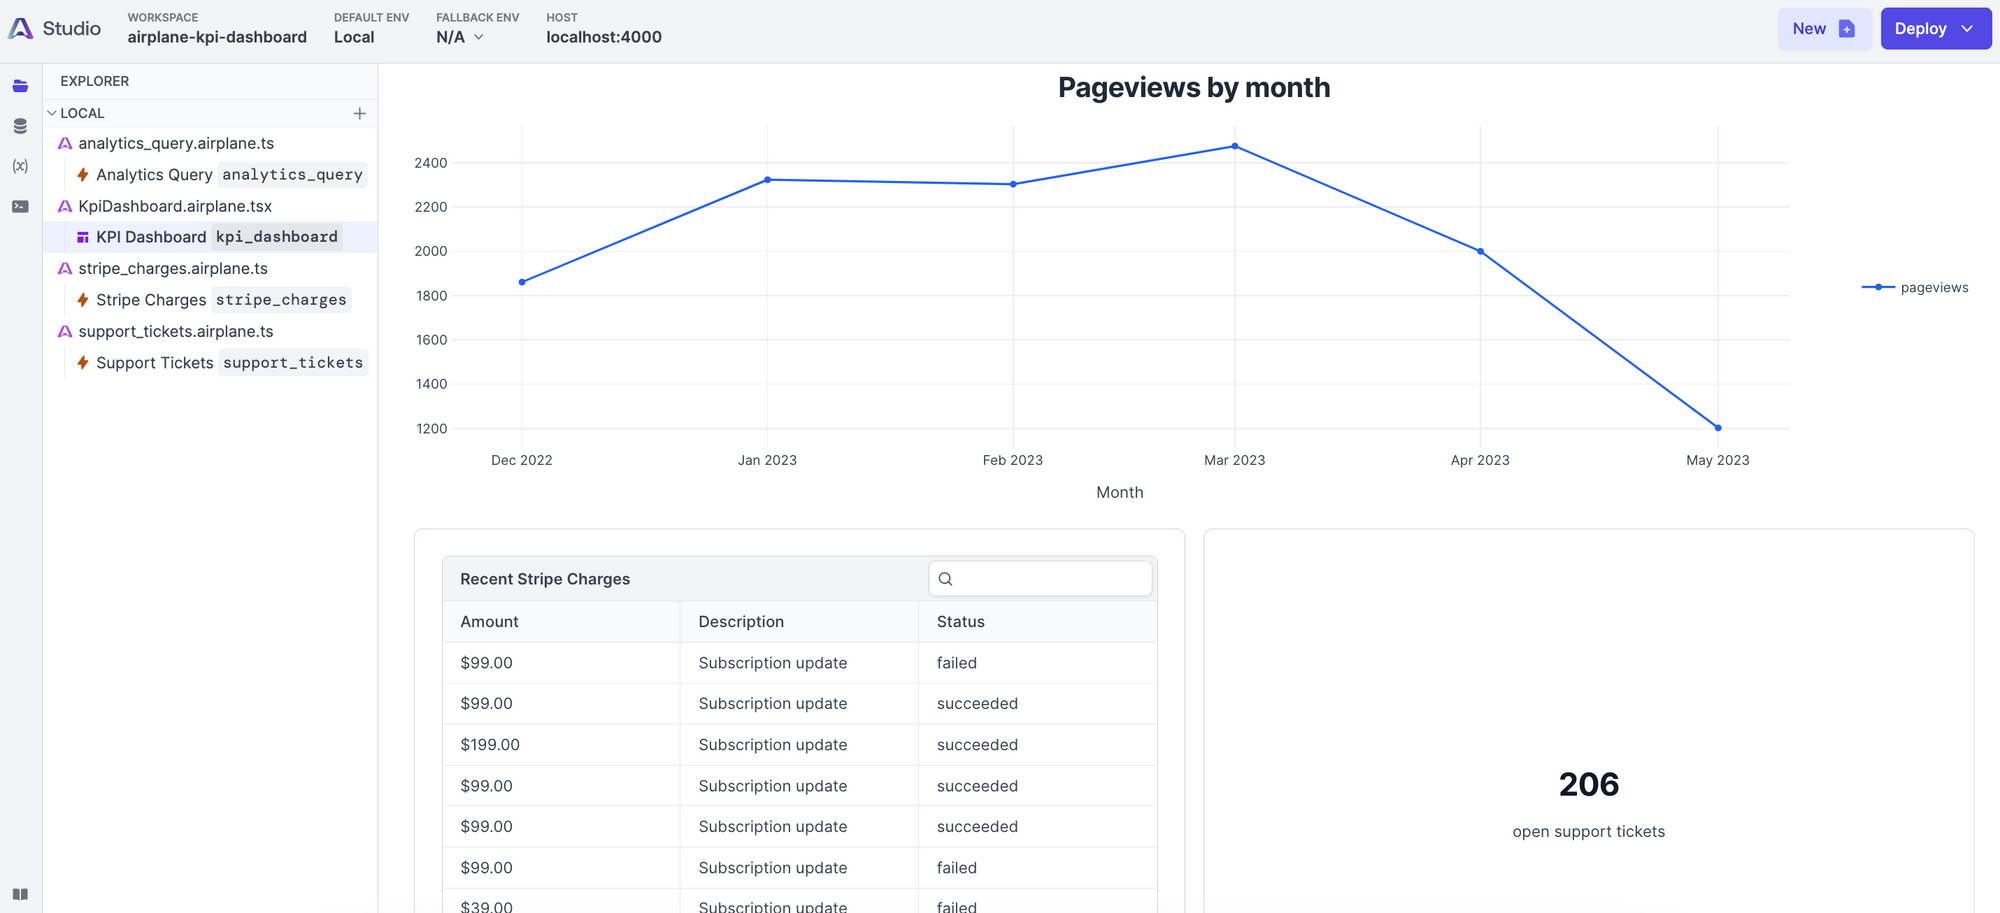
Now that we have this task that returns the total number of open conversations from Help Scout, we can add it to our View.
Once we have added that, we have a completed dashboard!
Deploying to Airplane
Now that your Tasks and Views are built, you can deploy them to Airplane and let everyone on your team use your brand new dashboard. From within the root of your project, run airplane deploy, answer the prompts and within a couple of minutes your dashboard will be available inside your Airplane Library.
Internal tools made easy with Airplane
As you can see, Airplane allows you to scaffold and build internal tools very quickly. With a flexible UI layer, a code-first architecture that allows you to build anything you can write the code for and the ability to share the tools you’ve built with your teammates, Airplane is a powerful platform that helps you build quickly with the ability to scale.
Now that you’ve seen what the platform can do, we can’t wait to see what else you build on Airplane. If you’re a startup with under 100 employees and are Series A or earlier, check out Airplane for Startups to get even more out of Airplane.