Just like you wouldn’t drive a car without some of the very important dials and gauges on the dashboard, you shouldn’t run your business without having some idea of what your key performance indicators (KPIs) and metrics are.
However, the data necessary to generate these metrics and answer essential questions about your business exists in disparate systems. This makes these insights scattered, difficult to synthesize, and inaccessible. That’s where the concept of a business intelligence dashboard comes in.
In this article, we’ll take a look at exactly what business intelligence dashboards are, some of the tools available to help you build one, and some common pitfalls to avoid.
What are business intelligence (BI) dashboards?
At their core, BI dashboards are single views where you can look at all the key metrics in your business. Sometimes these dashboards, especially for software and web-based businesses, are analytics-focused and contain traffic and usage statistics, active user counts, and more. Other businesses need more financially-focused dashboards with metrics like revenue, customer churn, and profit at the forefront.
Depending on the size of your organization, individual teams might have different dashboards for their particular areas of the business. For example, your marketing and growth teams might care more about traffic to the website, top referral sources, and how links are performing on social media, and less about other product-specific areas of the business.
For a business intelligence dashboard to be effective, it’s less about what metrics it tracks, but rather, that the metrics the dashboard is tracking will help anyone monitoring the dashboard move the business forward. These metrics can and will likely change over time, so any dashboard solution needs to be straightforward enough to implement quickly, while still being flexible enough to evolve with the changing needs of the business.
Get started building a BI dashboard
If you look at some examples of dashboards online, you might feel overwhelmed by the idea of building one of your own. Fortunately, taking it one step at a time can simplify the process of creating a useful dashboard.
Define your requirements
One of the most important parts of any project like this is to define what the dashboard you are building needs to accomplish. This will include deciding what key performance indicators (KPIs) and metrics you need to measure. You want your dashboard to be focused and track the metrics that will actually help your business as opposed to being a random collection of numbers and visuals that are confusing to interpret. For example, at Airplane we track metrics such as how many Tasks an organization has created and how often those Tasks are being run. We do this because this gives us an idea of whether our customers find our product useful and whether that usage continues to grow as they become more proficient with using Airplane.
Identify your data sources
Once you’ve identified the metrics that your dashboard needs, you need to figure out where the data for those metrics exists. One of the main benefits of building a business intelligence dashboard is bringing together data that exists in separate systems, so it’s likely that you will have to pull together multiple different data sources to create your dashboard. Some of the data sources you might want to consider include:
- Google Analytics (for page view data and other website or application-specific information)
- Stripe, Paypal, or another payment provider (for any relevant revenue and financial information)
- Help Scout or another customer support tool (for information on how effectively support is being handled)
- Jira or some other ticketing system (for measuring the progress and flow of work)
There might be other data sources that make sense for your specific business, but hopefully, the above list gives you some idea of what sort of data might make sense to include in your business intelligence dashboard.
Data cleaning and transformation
Once you’ve identified your data sources, you then need to examine whether your data needs to be cleaned or transformed in any way to be useful on your dashboard. For example, if your payment provider accepts payment in multiple currencies, does your financial data need to be converted to a single currency so your dashboard metrics make sense?
Or if you have page view and user activity data coming from two different systems that measure data in different time windows, you might want to adjust this data to be consistent and measure the same unit of time.
The important takeaway from this step in the process is that all your data is in the most useful format to be displayed on your dashboard.
Design and implement the dashboard
Now that you have decided on your data sources and ensured that your data is transformed as necessary, it’s time to actually implement your dashboard. While it’s possible to design and build your own dashboard completely from scratch, there are a number of tools on the market that can help you create a dashboard a lot more quickly and easily. We’ll discuss these in the next section.
Business intelligence dashboard tools
Because business intelligence dashboards are a common need for businesses of all sizes, there are already a variety of tools on the market. At a glance, these tools share some similarities, but differ in important ways depending on your use case.
| Name | Primary use case | Benefits | Drawbacks |
|---|---|---|---|
| Tableau | Flexible dashboard configured with drag-and-drop | Flexibility to build logic in a variety of programming languages | Some limits to the visual display make it incompatible with larger datasets |
| Power BI | Upgrading existing Microsoft Office-powered solutions | Wide-ranging support within the Windows ecosystem, familiar interface for Office users | Only works in Windows environments. Limited programming support. |
| Airplane | Code-first dashboards that are both visual and flexible | Infinite flexibility due to the entire dashboard being code-driven | No drag-and-drop or visual builder |
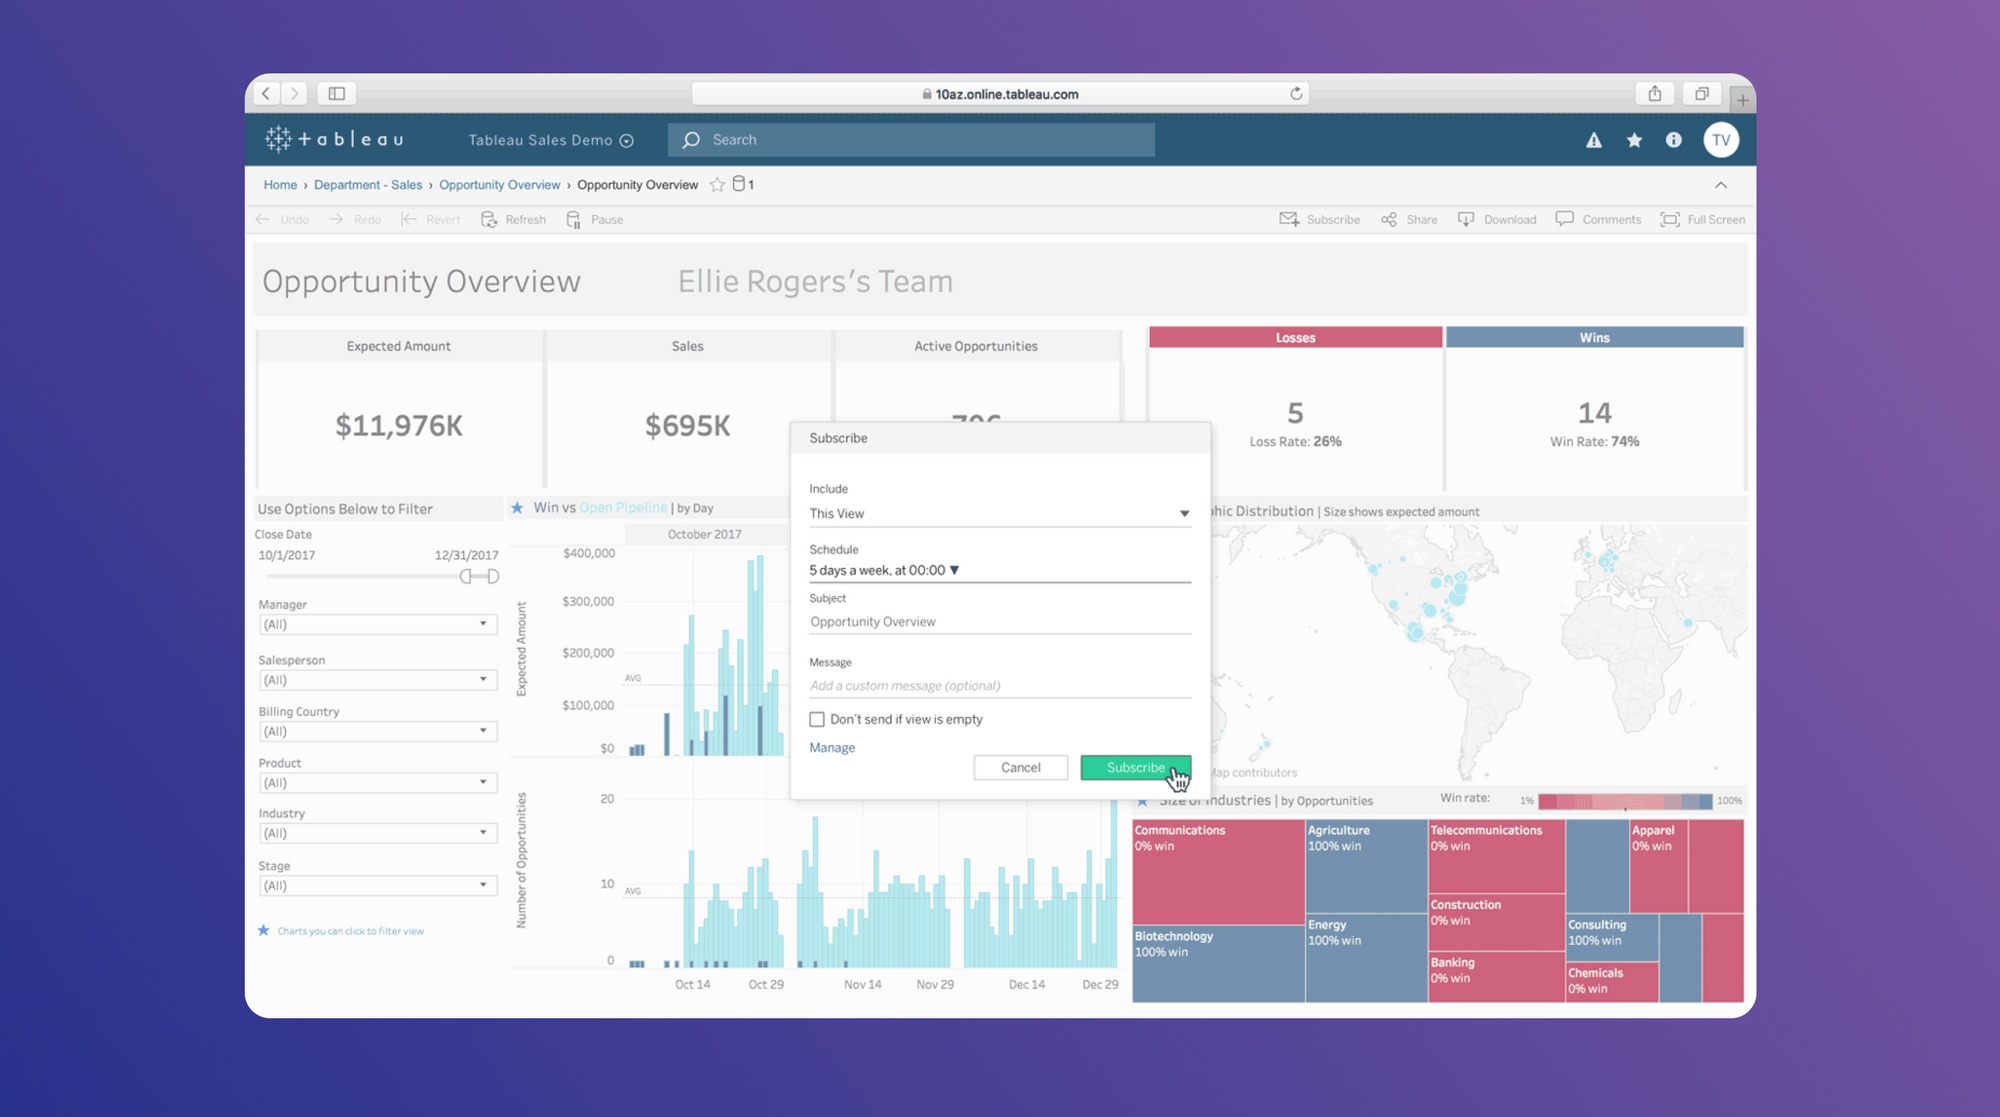
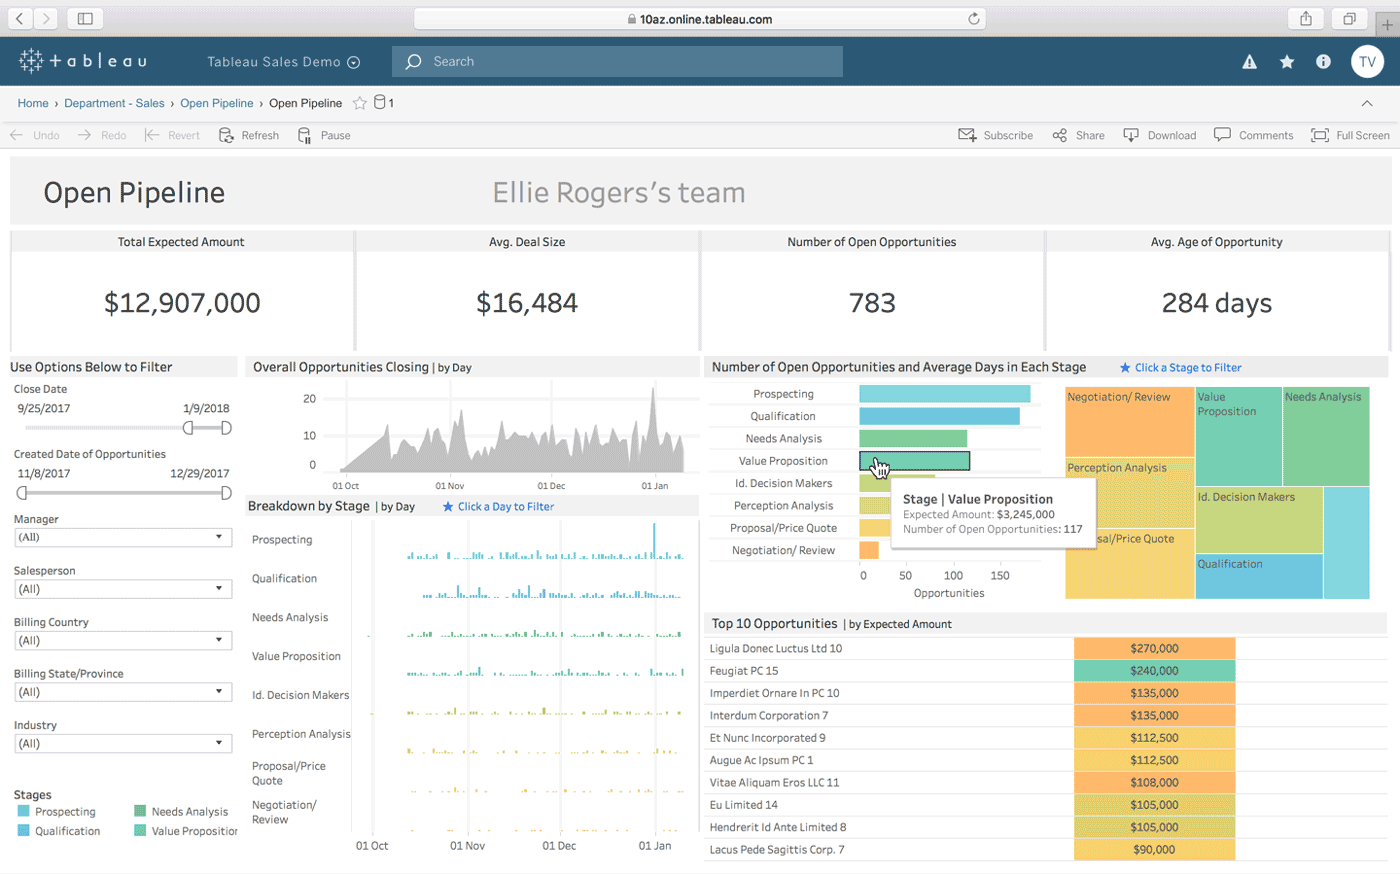
Tableau
Tableau is a business intelligence platform that helps teams build data-driven, visual dashboards to track metrics from across their business. Tableau focuses on drag-and-drop functionality and being easy to use, especially for first-time users, without sacrificing the customizability and power of other BI solutions. Tableau allows you to use a variety of programming languages to interact with your data and make your dashboards more powerful. However, some users have reported limits to the visual builder that may not fit all types of datasets.
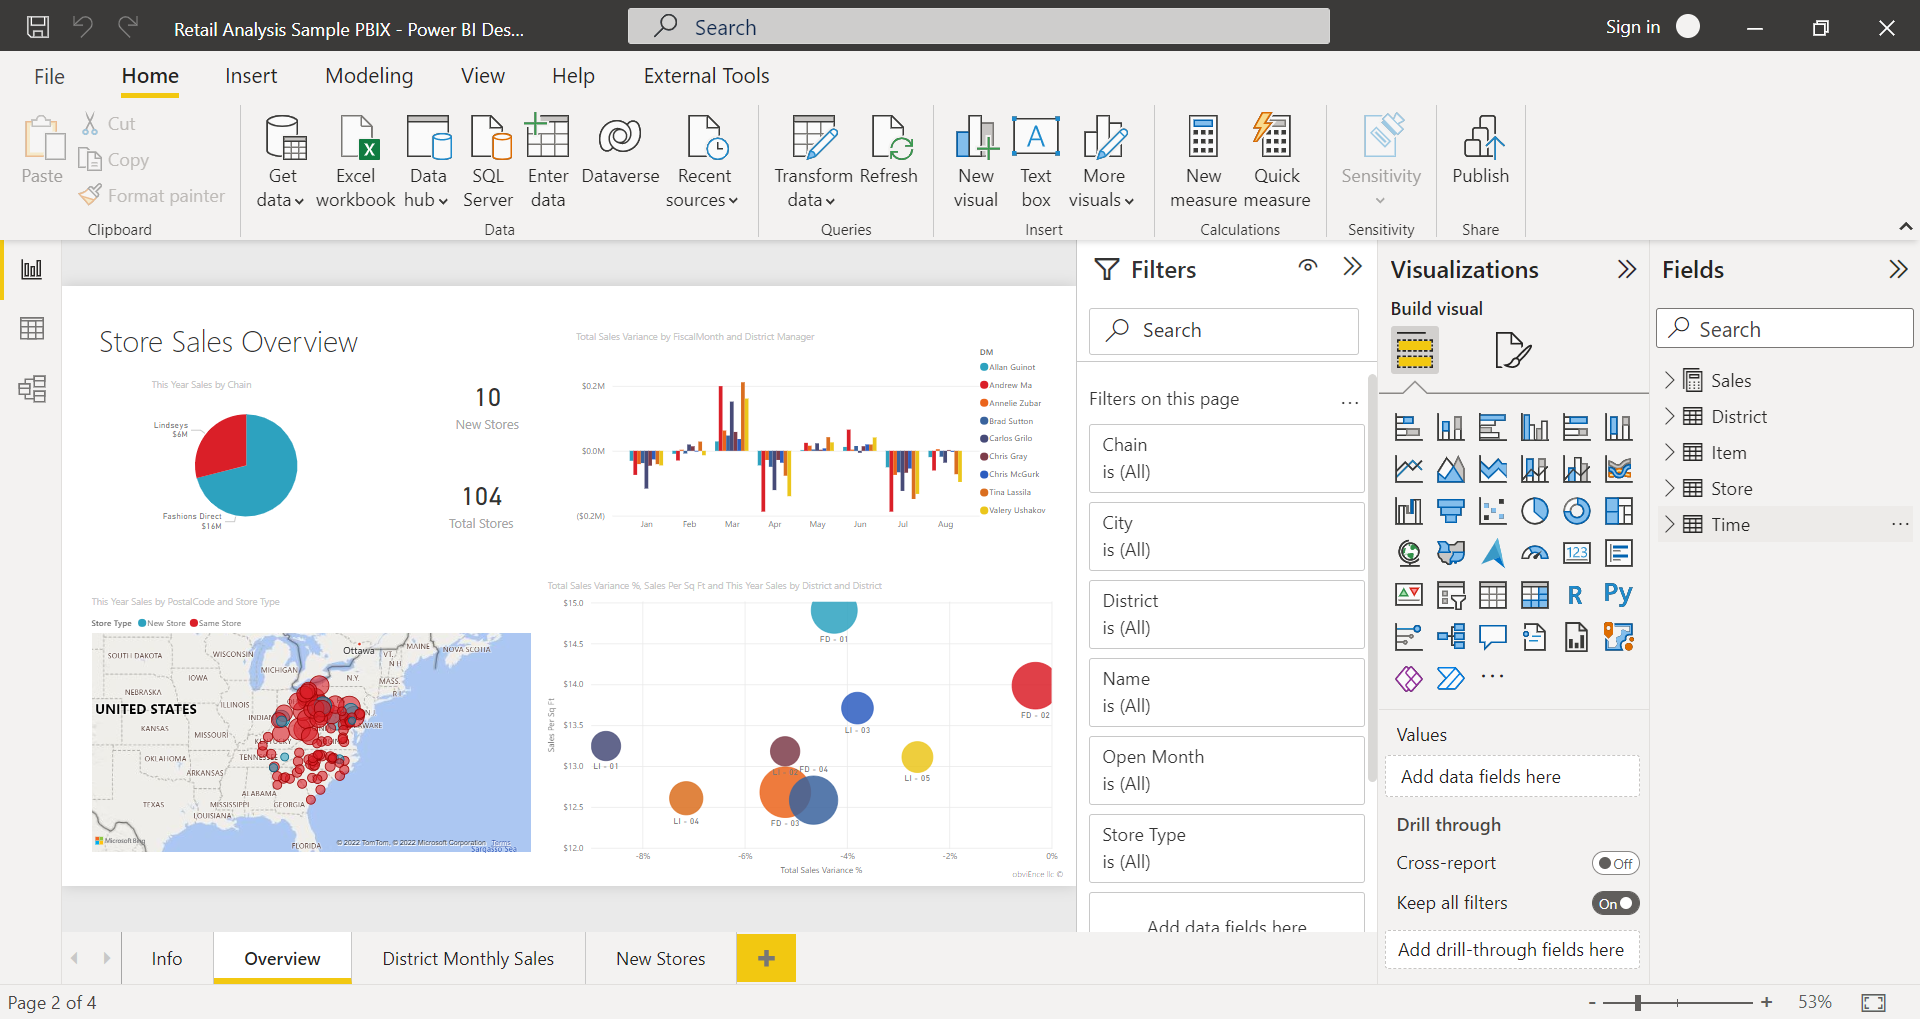
Power BI
Power BI is Microsoft’s business intelligence tool. If you’re familiar with manipulating data in Excel, you’ll feel right at home with Power BI. One of the biggest differentiators between Power BI and some of the other BI tools out there is that Power BI only works on Windows. Power BI is a bit more limited in terms of what programming languages it’s compatible with, but if you’re already managing your business with Microsoft Office toolset, Power BI is a natural step up.
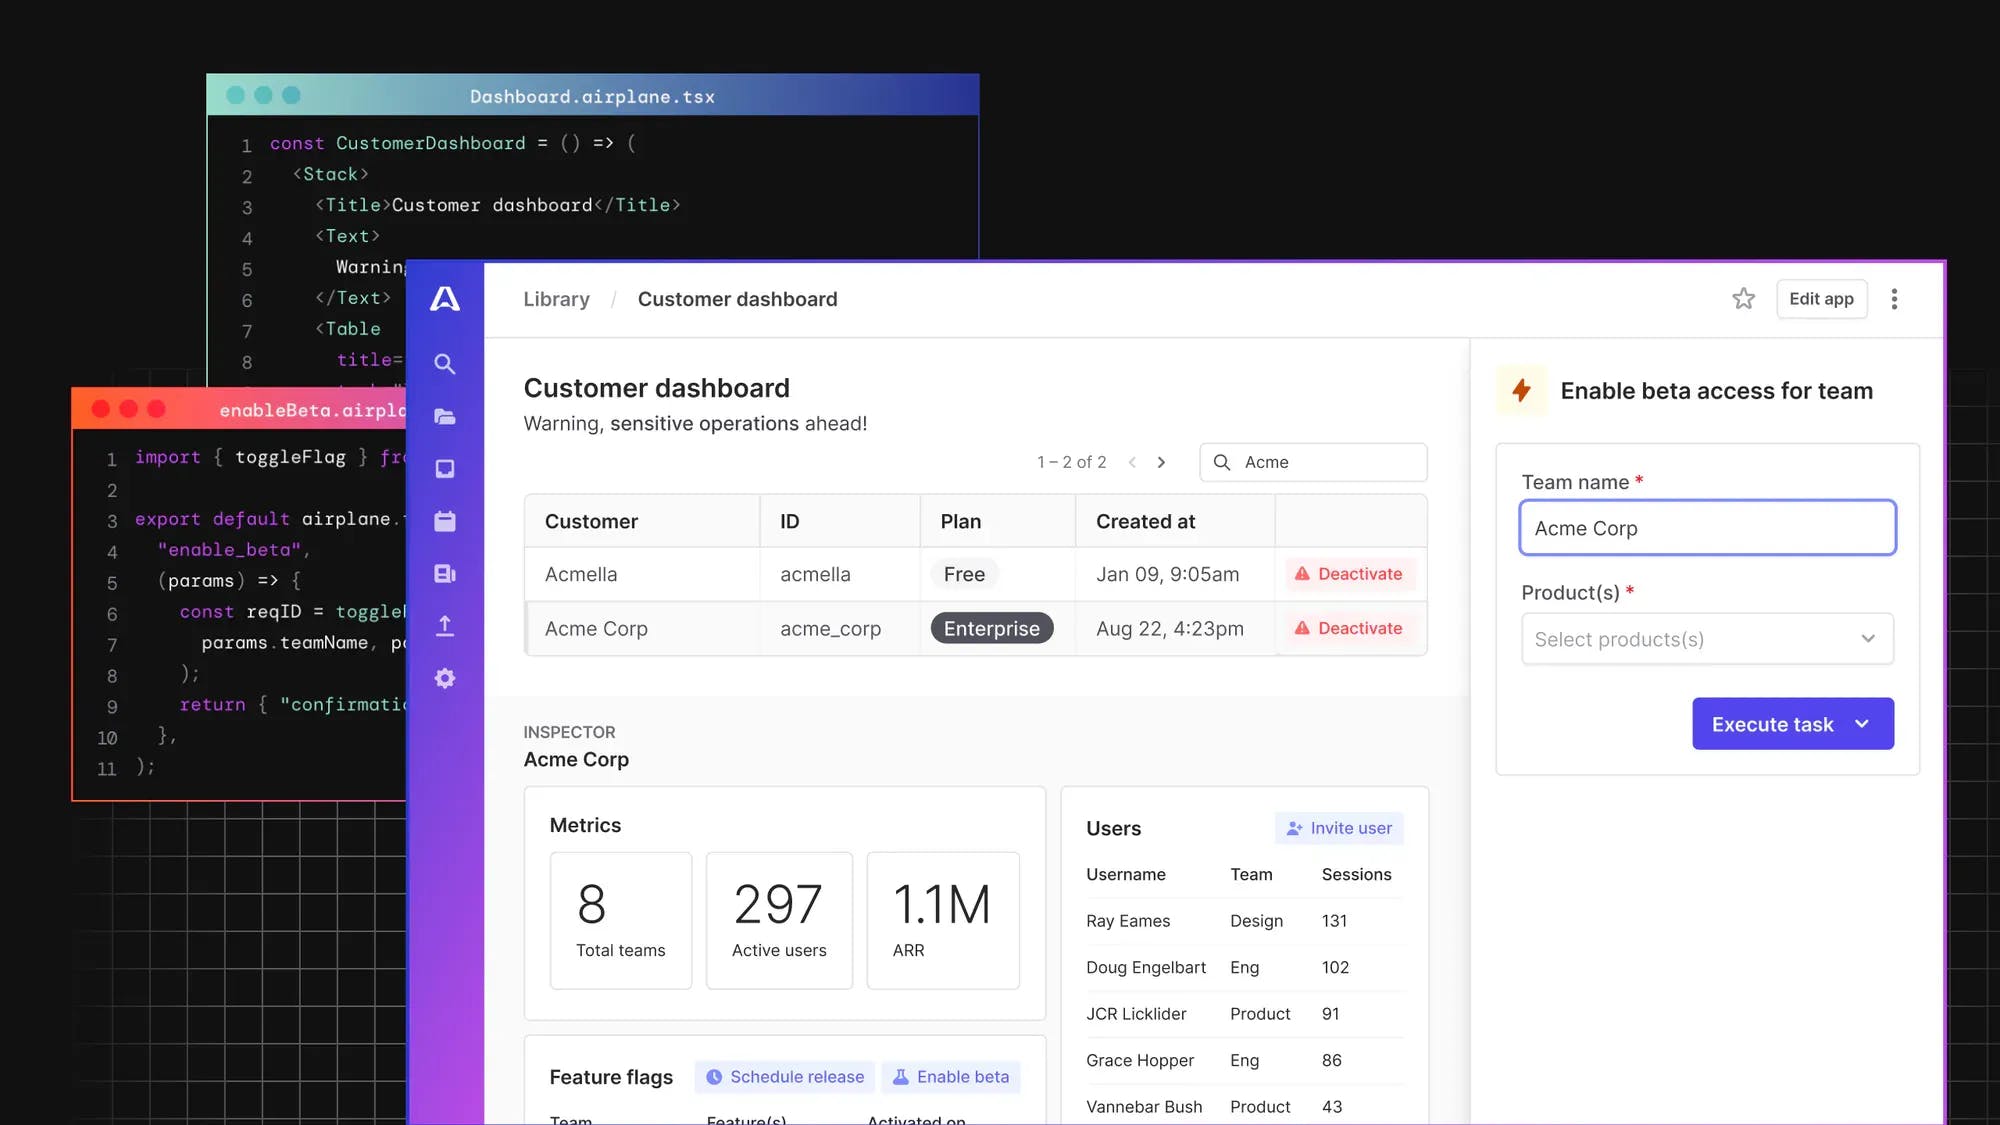
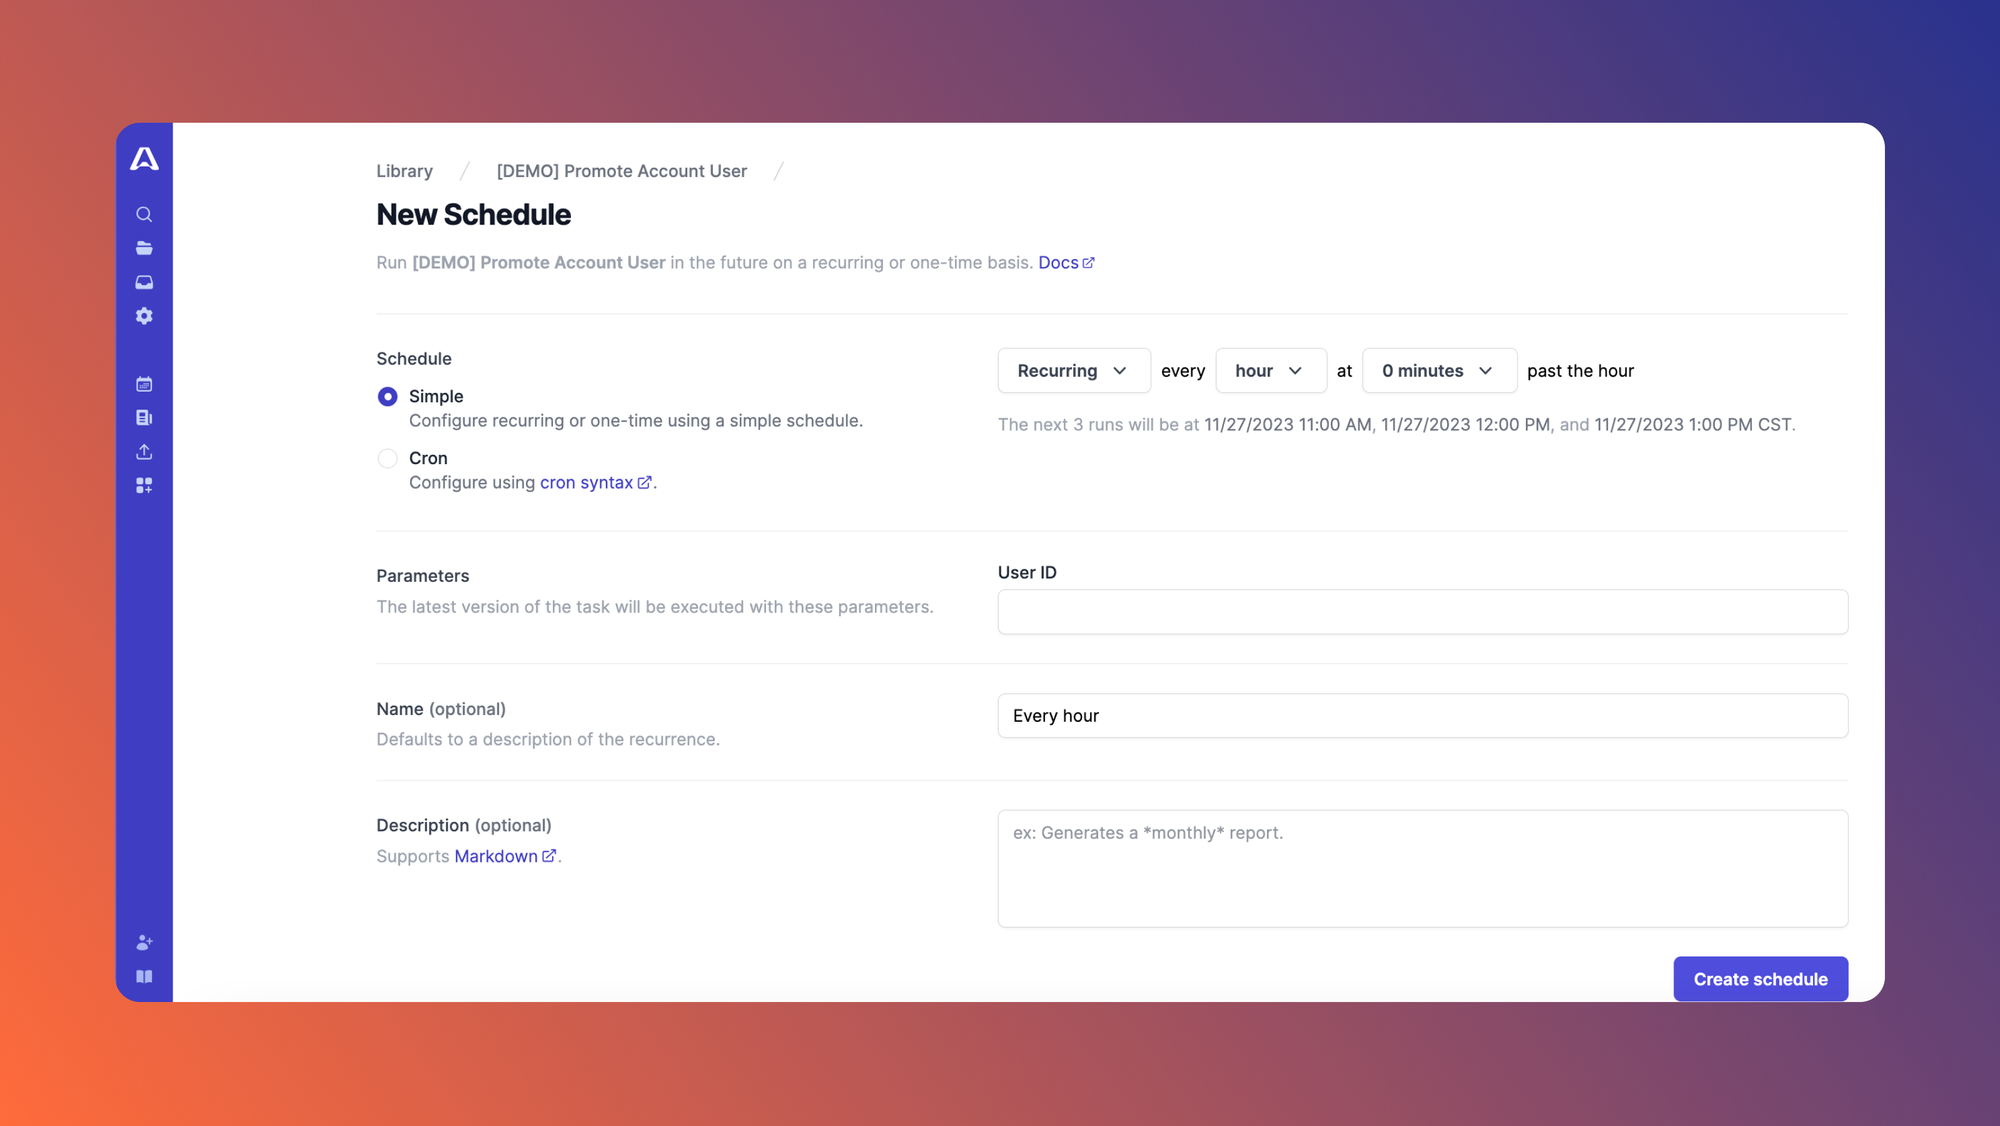
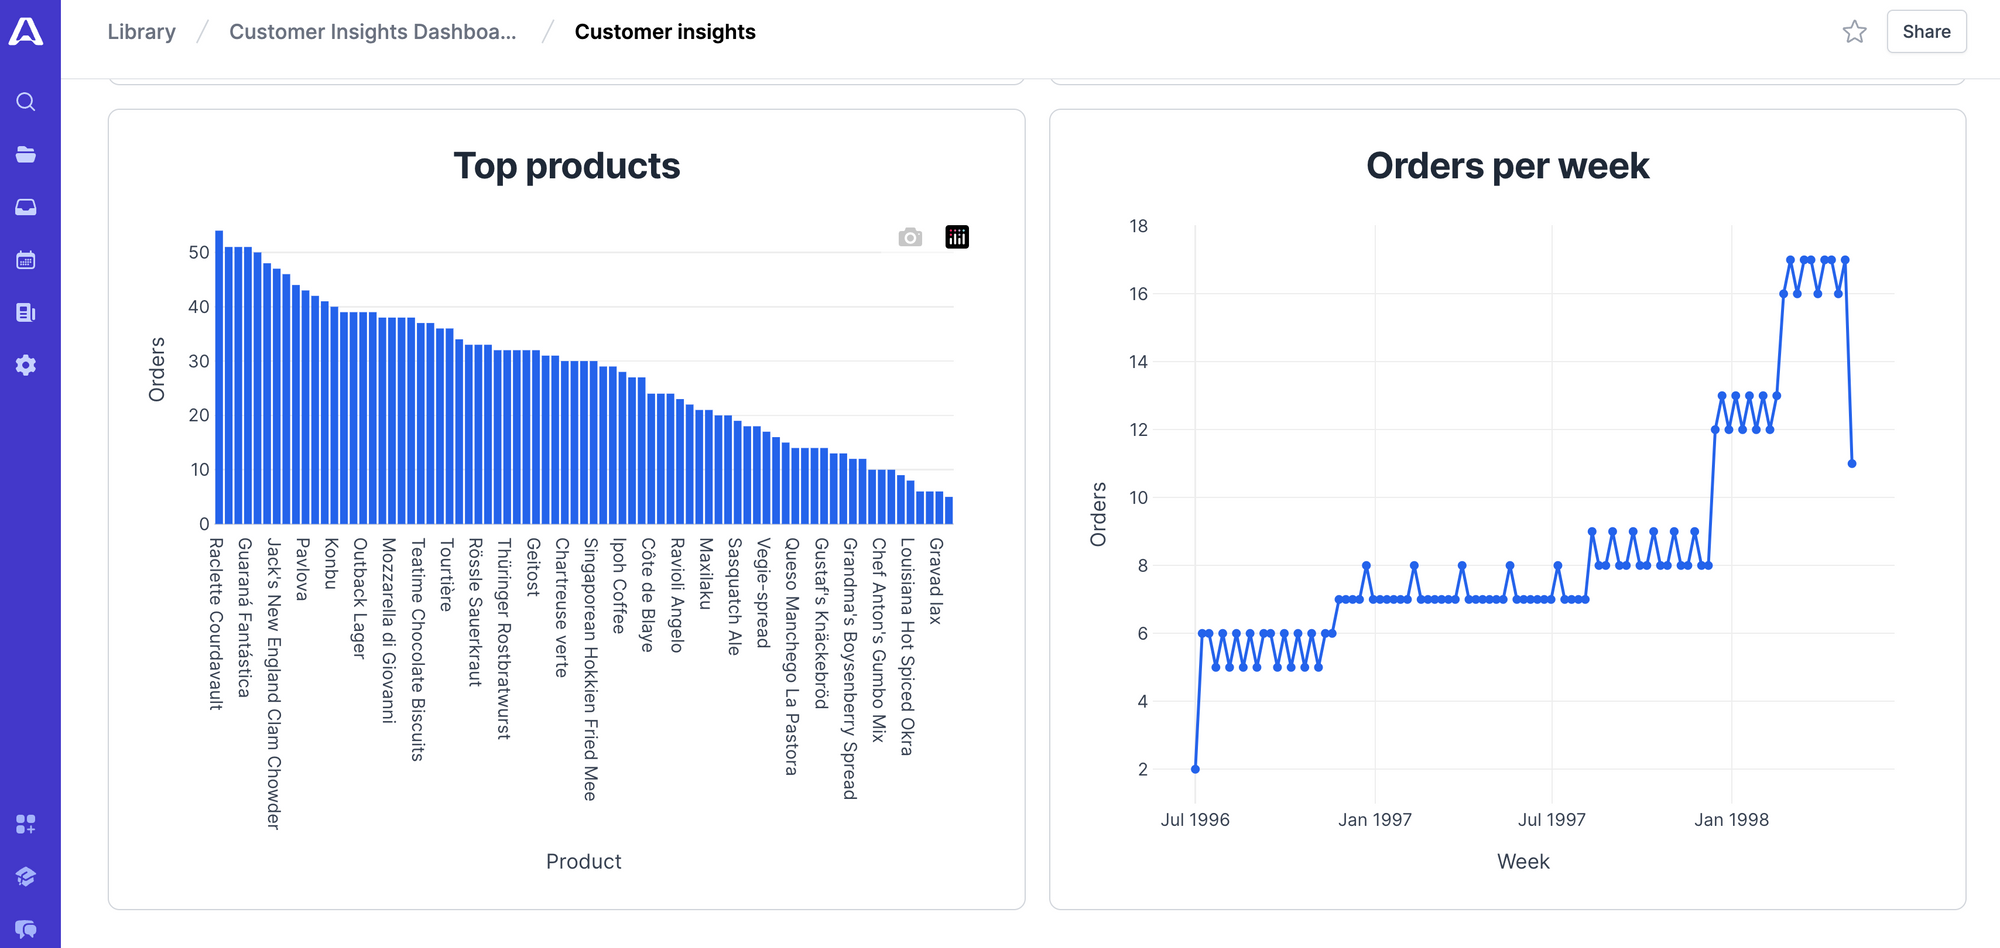
Airplane
If you’re looking for a flexible, code-first tool to help you build out your business intelligence dashboard, Airplane is a great choice. Airplane lets you integrate REST APIs, SQL queries, shell scripts, and even code in Python or Javascript to ensure you can build exactly the dashboard you need. With an easy-to-integrate visual component, you can be sure that whether your stakeholders are technical or not, everyone knows what’s going on with the business.
Best practices for business intelligence dashboards
Regardless of which tool you choose, some common best practices that you should keep in mind when building your dashboard include choosing the right tool, keeping the UI simple, and making sure to focus on the end-user experience. We discuss these in more detail below.
Choose the right tool for the job
Based on your workflow, data needs and what you want your dashboard to look like, some tools will likely be a better fit than others. Consider how a given dashboard tool fits into your existing business rather than how you might have to change your business processes to fit a given tool when making your decision.
Keep it simple (and visual)
Even though BI dashboards are data-driven, they work best when that data can be quickly parsed visually. All of the solutions above allow to drill down and get more specific with individual metrics if you want to, but the dashboard itself should display all the relevant information at a glance.
Focus on end-user experience
In the end, whether a dashboard is useful comes down to whether those looking it can quickly get the data they need and use that information to make decisions that positively impact the business. Before you start building and even after the dashboard is up and running, it’s important to get feedback from the people in your organization actually using it to make sure it’s serving that purpose.
Common mistakes to avoid
With the above best practices in place, it’s also a good idea to make sure your BI dashboard isn’t making some common mistakes: overcomplicating the dashboard, not addressing important security concerns, or missing data. We discuss each of these in more detail below.
Overcomplicating the dashboard
Once a BI dashboard is live, there are usually tons of feature requests from all sorts of stakeholders. If every one of these requests is honored, eventually the dashboard becomes overcomplicated and way too messy to provide any useful insights. To prevent this, consider creating dashboards specific to certain teams with relevant data for that part of the organization rather than trying to cram everything into one dashboard.
Security concerns
Because many dashboards start as internal projects, security is something normally left until the very last minute. However, it’s important to treat a BI dashboard just like any other piece of software in your organization. You want to make sure that only the right group of people inside your company have access to the dashboard and that the dashboard isn’t showing any sensitive user information. These concerns are easier to address as you’re building a tool rather than retroactively, so it’s important to consider security from the very beginning of your BI dashboard project.
Missing data/integrations
A BI dashboard is only as good as the data it contains. If the tool you select can’t ingest a certain type of data that’s crucial to making business decisions, the dashboard you build will be much less useful. When you’re considering which tool or framework to use, make sure it can handle all of the data and integrations that your specific business needs. If it can’t, consider a code-first solution like Airplane for even more flexibility.
Start building your dashboard with Airplane
Creating a business intelligence dashboard is no small undertaking, but it is one that can have a massive impact on your business if done correctly. As with most any project, planning and careful evaluation of the available tools can take you a long way towards making your newly-created dashboard successful.
If, during that evaluation process, you feel like the BI-specific solutions aren’t going to fit your needs, consider a solution like Airplane. As a code-first platform with a powerful visual component library, any tool or dashboard you can imagine, you can build in Airplane.
You can get started today by signing up for a free account. If you’re a startup that’s Series A or earlier with less than 100 employees, take a look at Airplane’s Startup Program, which gives you $10,000 in free credits for your first year!