Key performance indicator (KPI) dashboards contain visual representations of an organization's performance on important business objectives. They can be used to unite different data sources and give users the ability to view many data points at a glance. KPI dashboards are used to track business performance, marketing effectiveness, customer service, and so on.
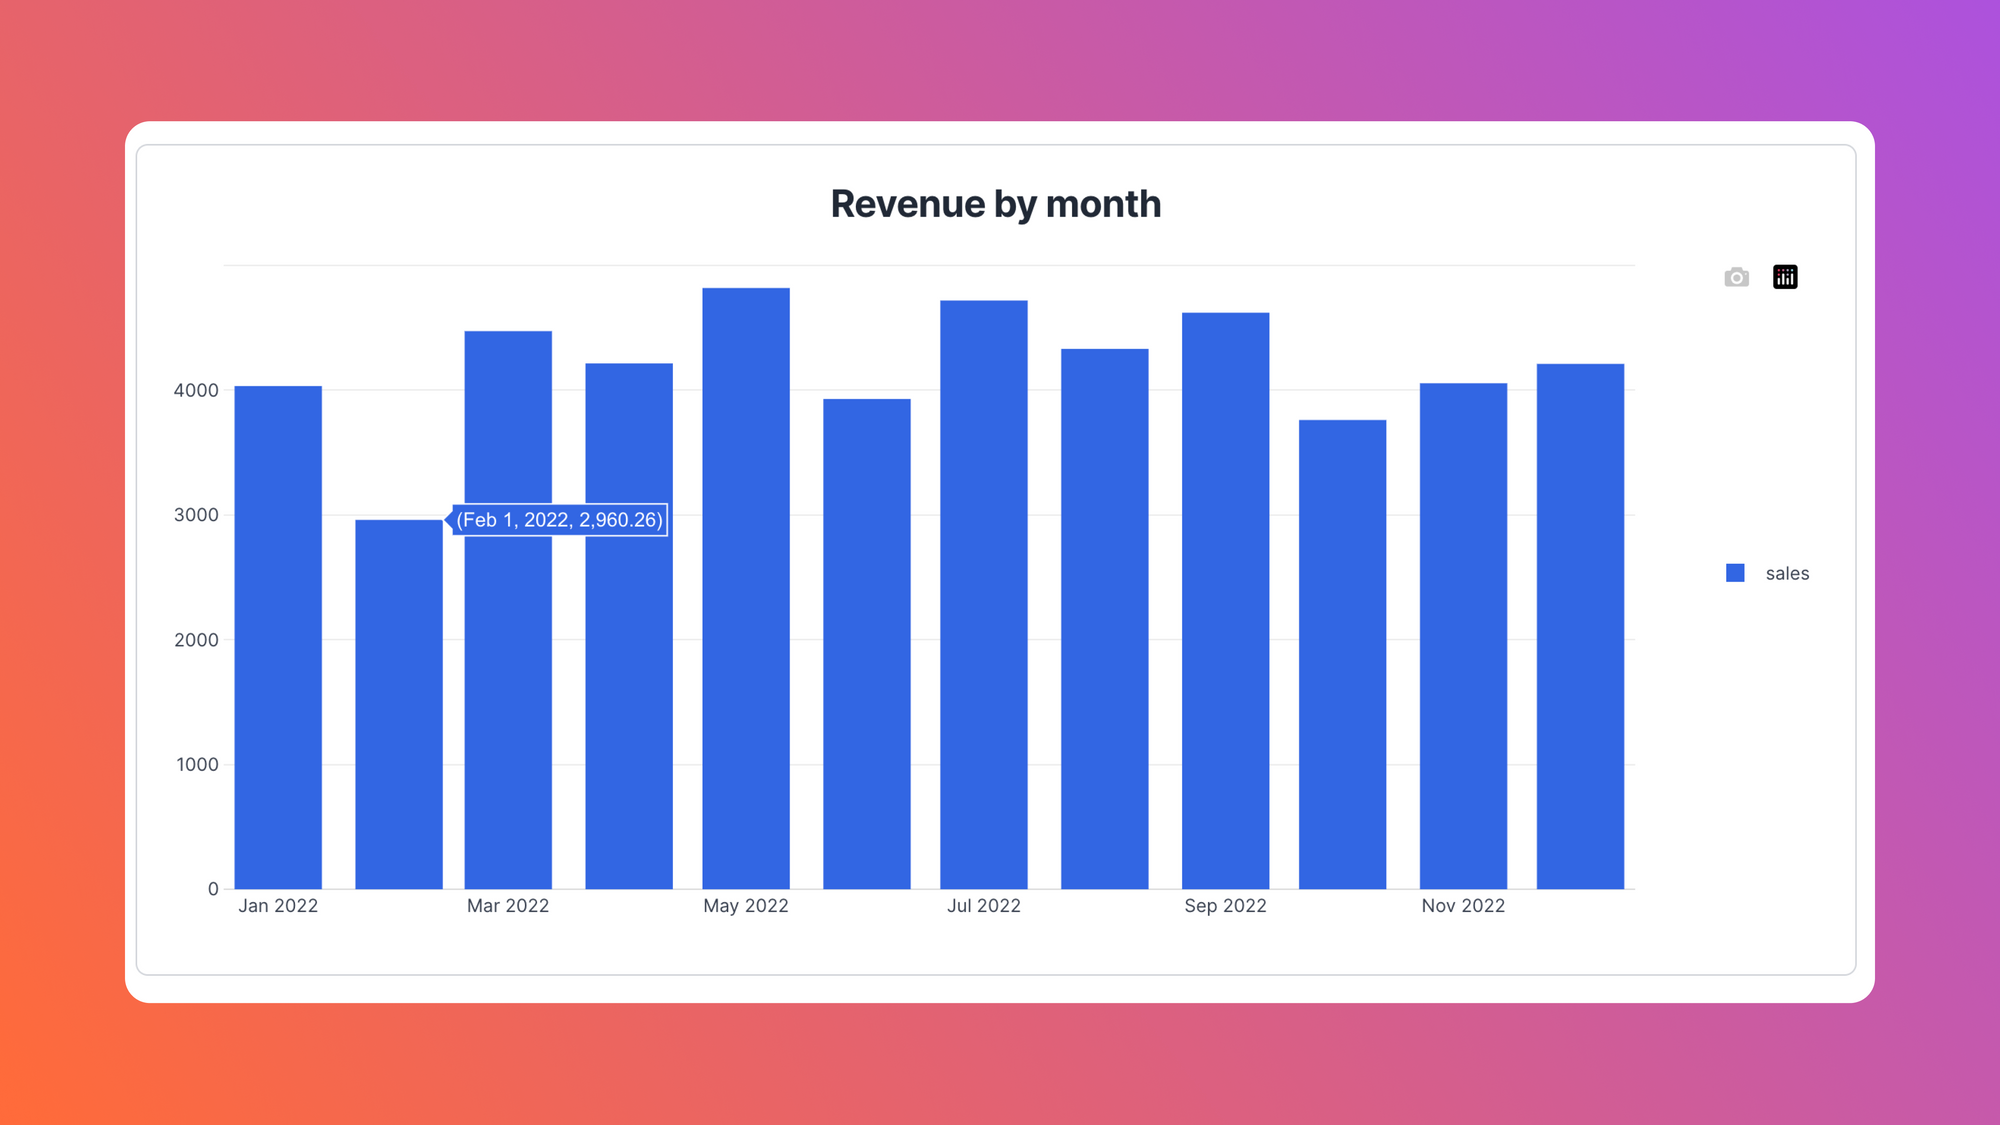
KPI dashboards collect, organize, and display important business data in a digestible manner, making it easy to measure and view a company's performance in key areas. They do so using a variety of charts and tables that are often interactive, giving the user the opportunity to drill into statistics for more information. For example, a KPI dashboard might include a bar chart showing monthly revenue. The user might be able to click a bar representing a single month and drill further into the data to see more information about that month's revenue.
KPI dashboards can be used for a variety of businesses and types of metrics. For example, they can be used to monitor business performance by tracking metrics such as the number of sales, average sales value, and number of new customers. Similarly, they can be used to monitor marketing effectiveness using metrics such as keyword performance, conversion rate, and average time on a page. Finally, KPI dashboards can be used to measure customer service effectiveness by tracking metrics like customer satisfaction score, average resolution time, and customer retention rate.
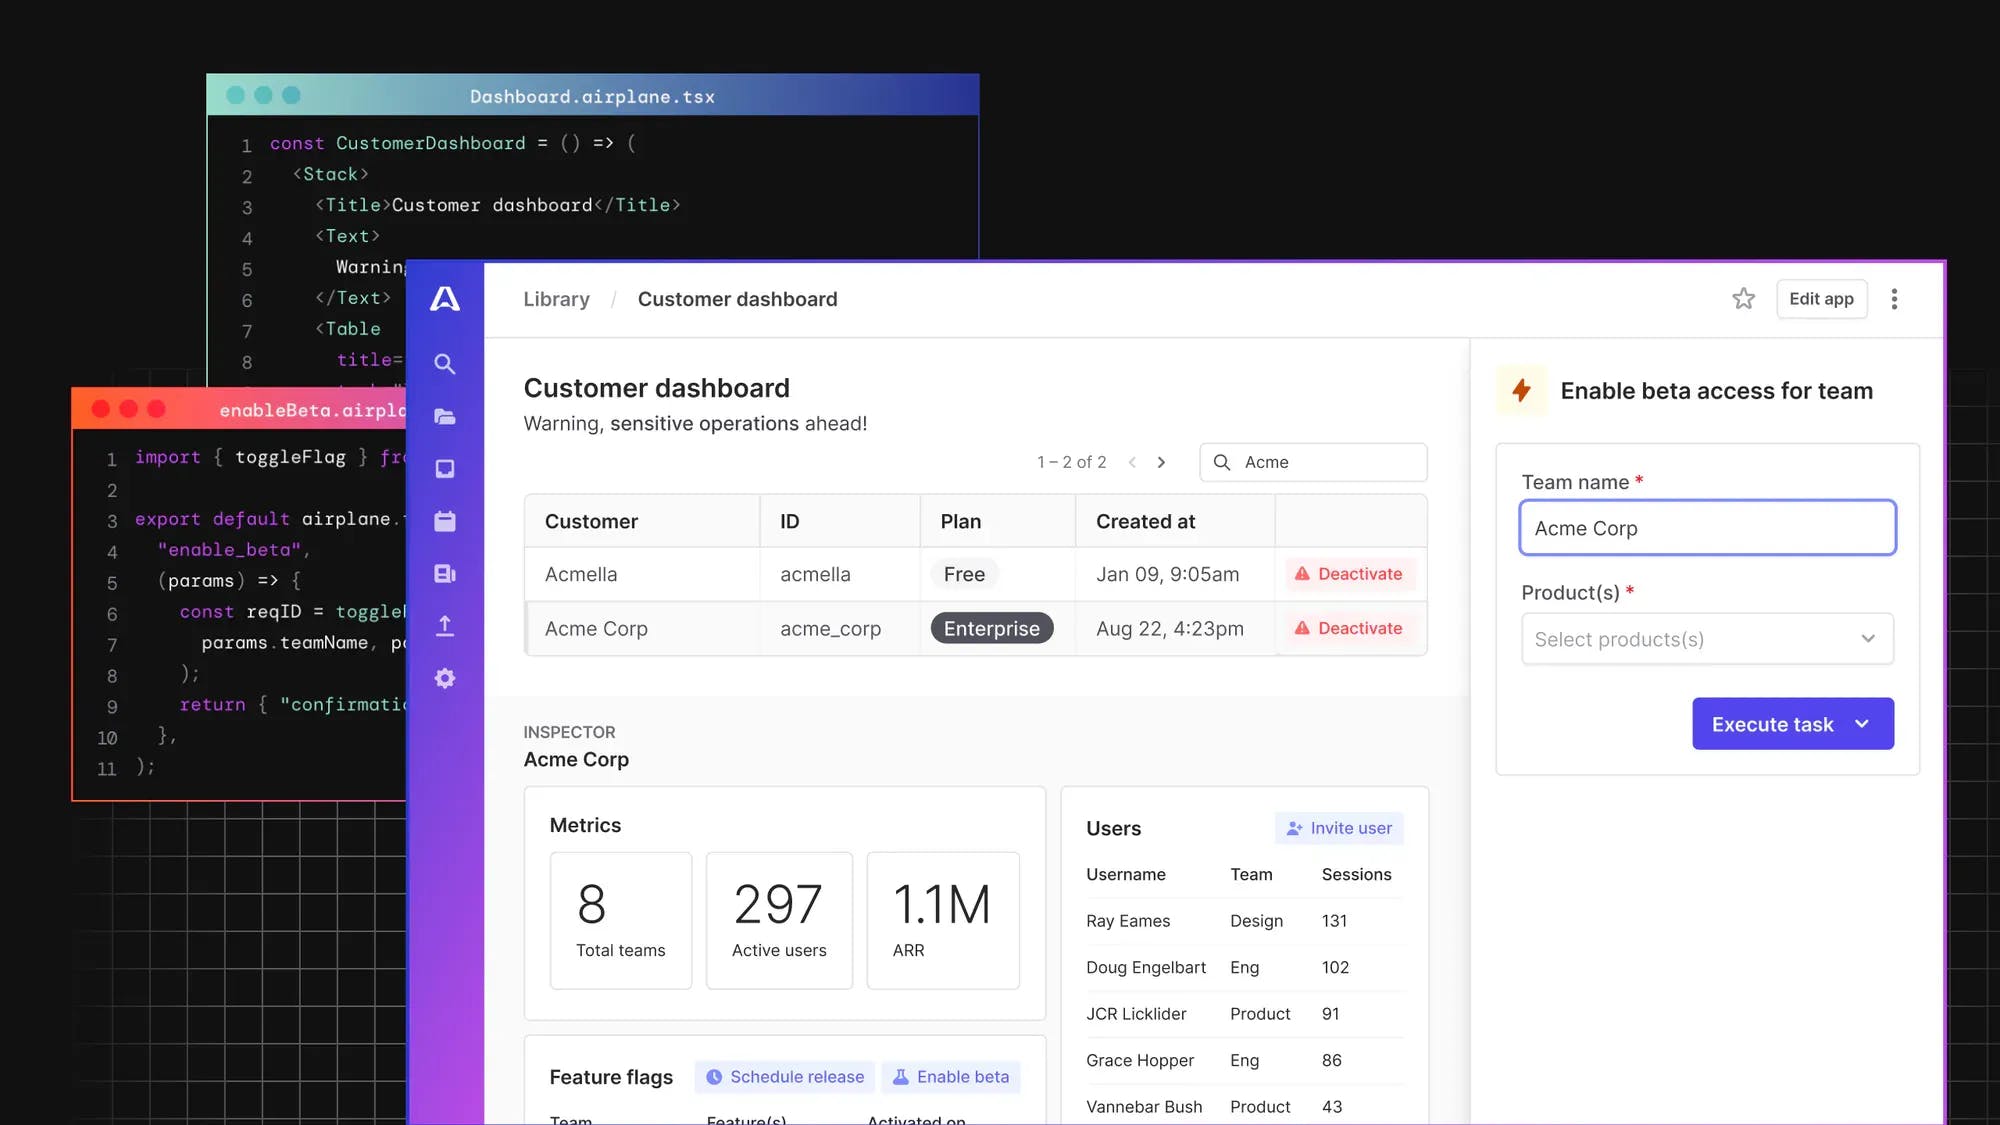
Airplane is the developer platform for building internal tools. With Airplane, you can transform scripts, queries, APIs, and more into custom UIs and workflows. The basic building blocks of Airplane are Tasks, which are single or multi-step operations that anyone can use. Airplane also offers Views, which are React-based UIs that users can quickly build and customize.
In this tutorial, we'll walk through how to easily use Airplane Tasks and Views to create a customizable KPI dashboard. Check out this project's GitHub repo to get a closer look at the code.
Prerequisites
Before we build the dashboard, ensure you have the following:
- Node.js and npm (installing Node from the official site also automatically installs npm)
- An Airplane account
- The Airplane CLI
- An empty folder for files associated with this project, which you can call anything you want
- The ability to create a database somewhere
This project uses ElephantSQL, but you can use whatever database you are comfortable with. If you are using ElephantSQL, you might find it helpful to use a tool like Postico to import data and connect to the database from your desktop.
Creating sample data and a database
To start, we will need some sample data. We can generate data easily using Mockaroo, which allows users to generate realistic data for any use case. This tutorial uses 1,000 rows of sales data created with Mockaroo, which can be found in this project's GitHub repo in CSV format.
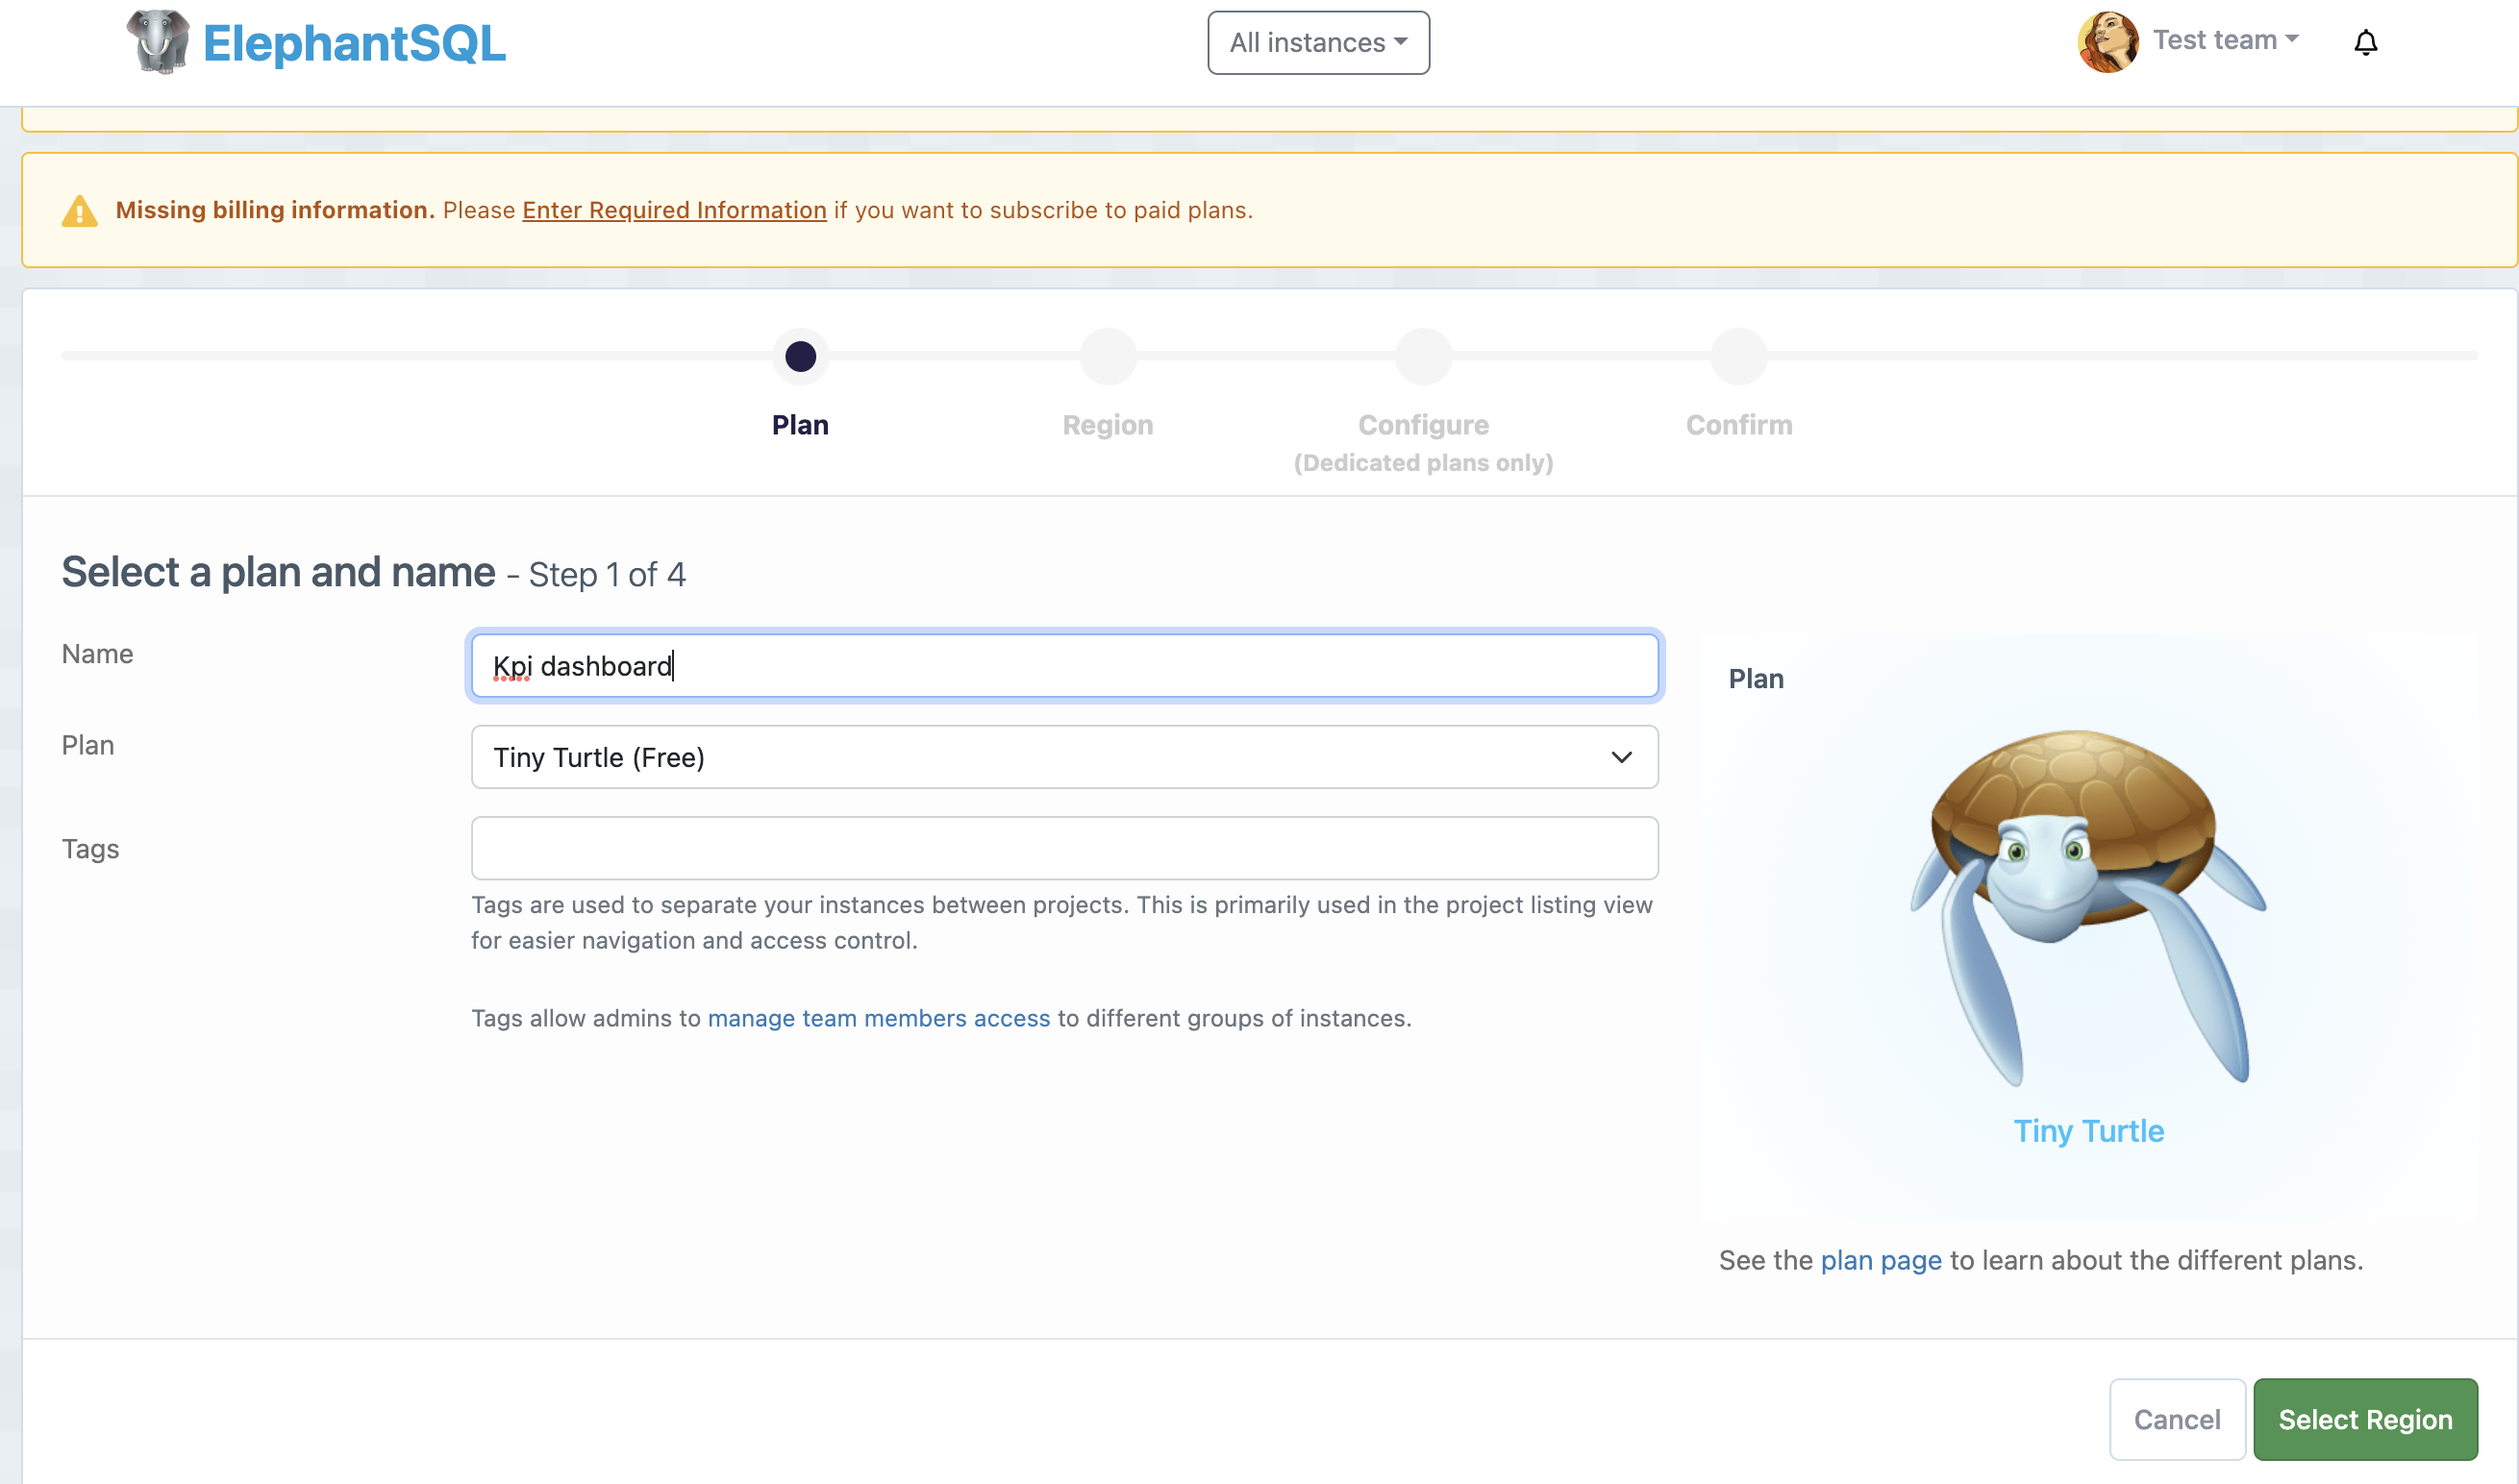
Next, we need a database for the data. For ElephantSQL, log in and click Create New Instance, then give the instance a name:
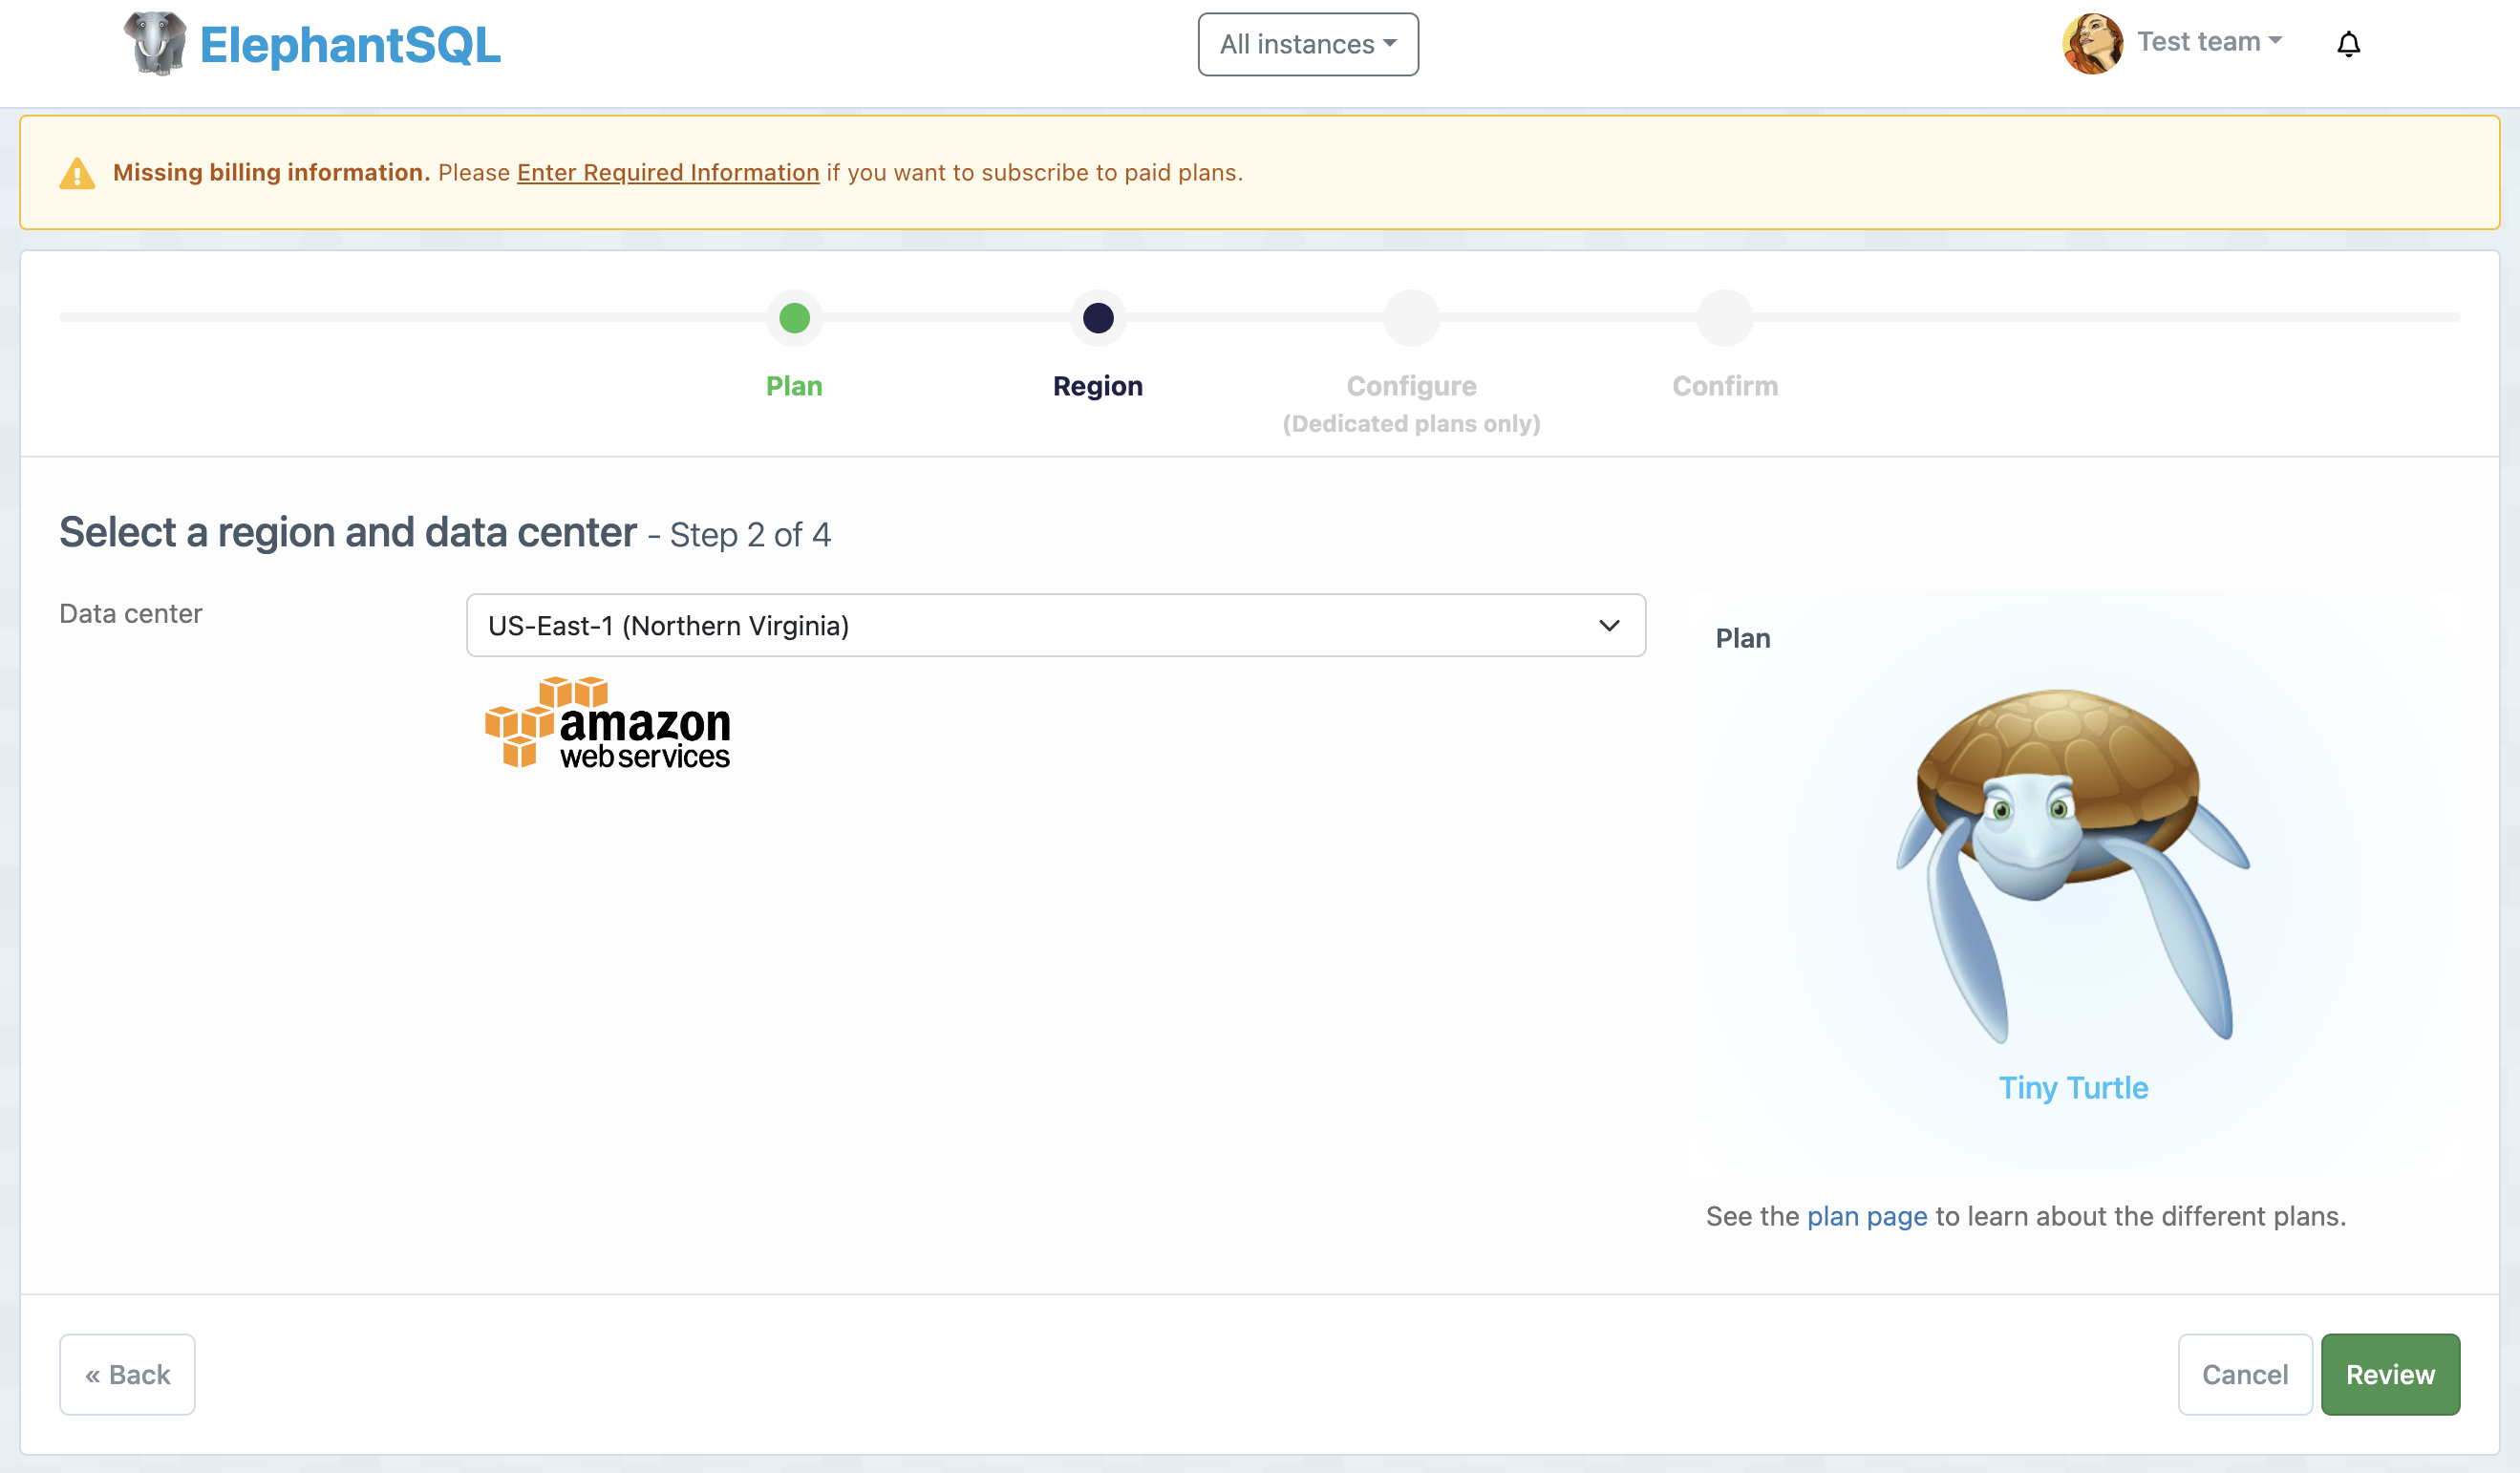
Then choose a region:
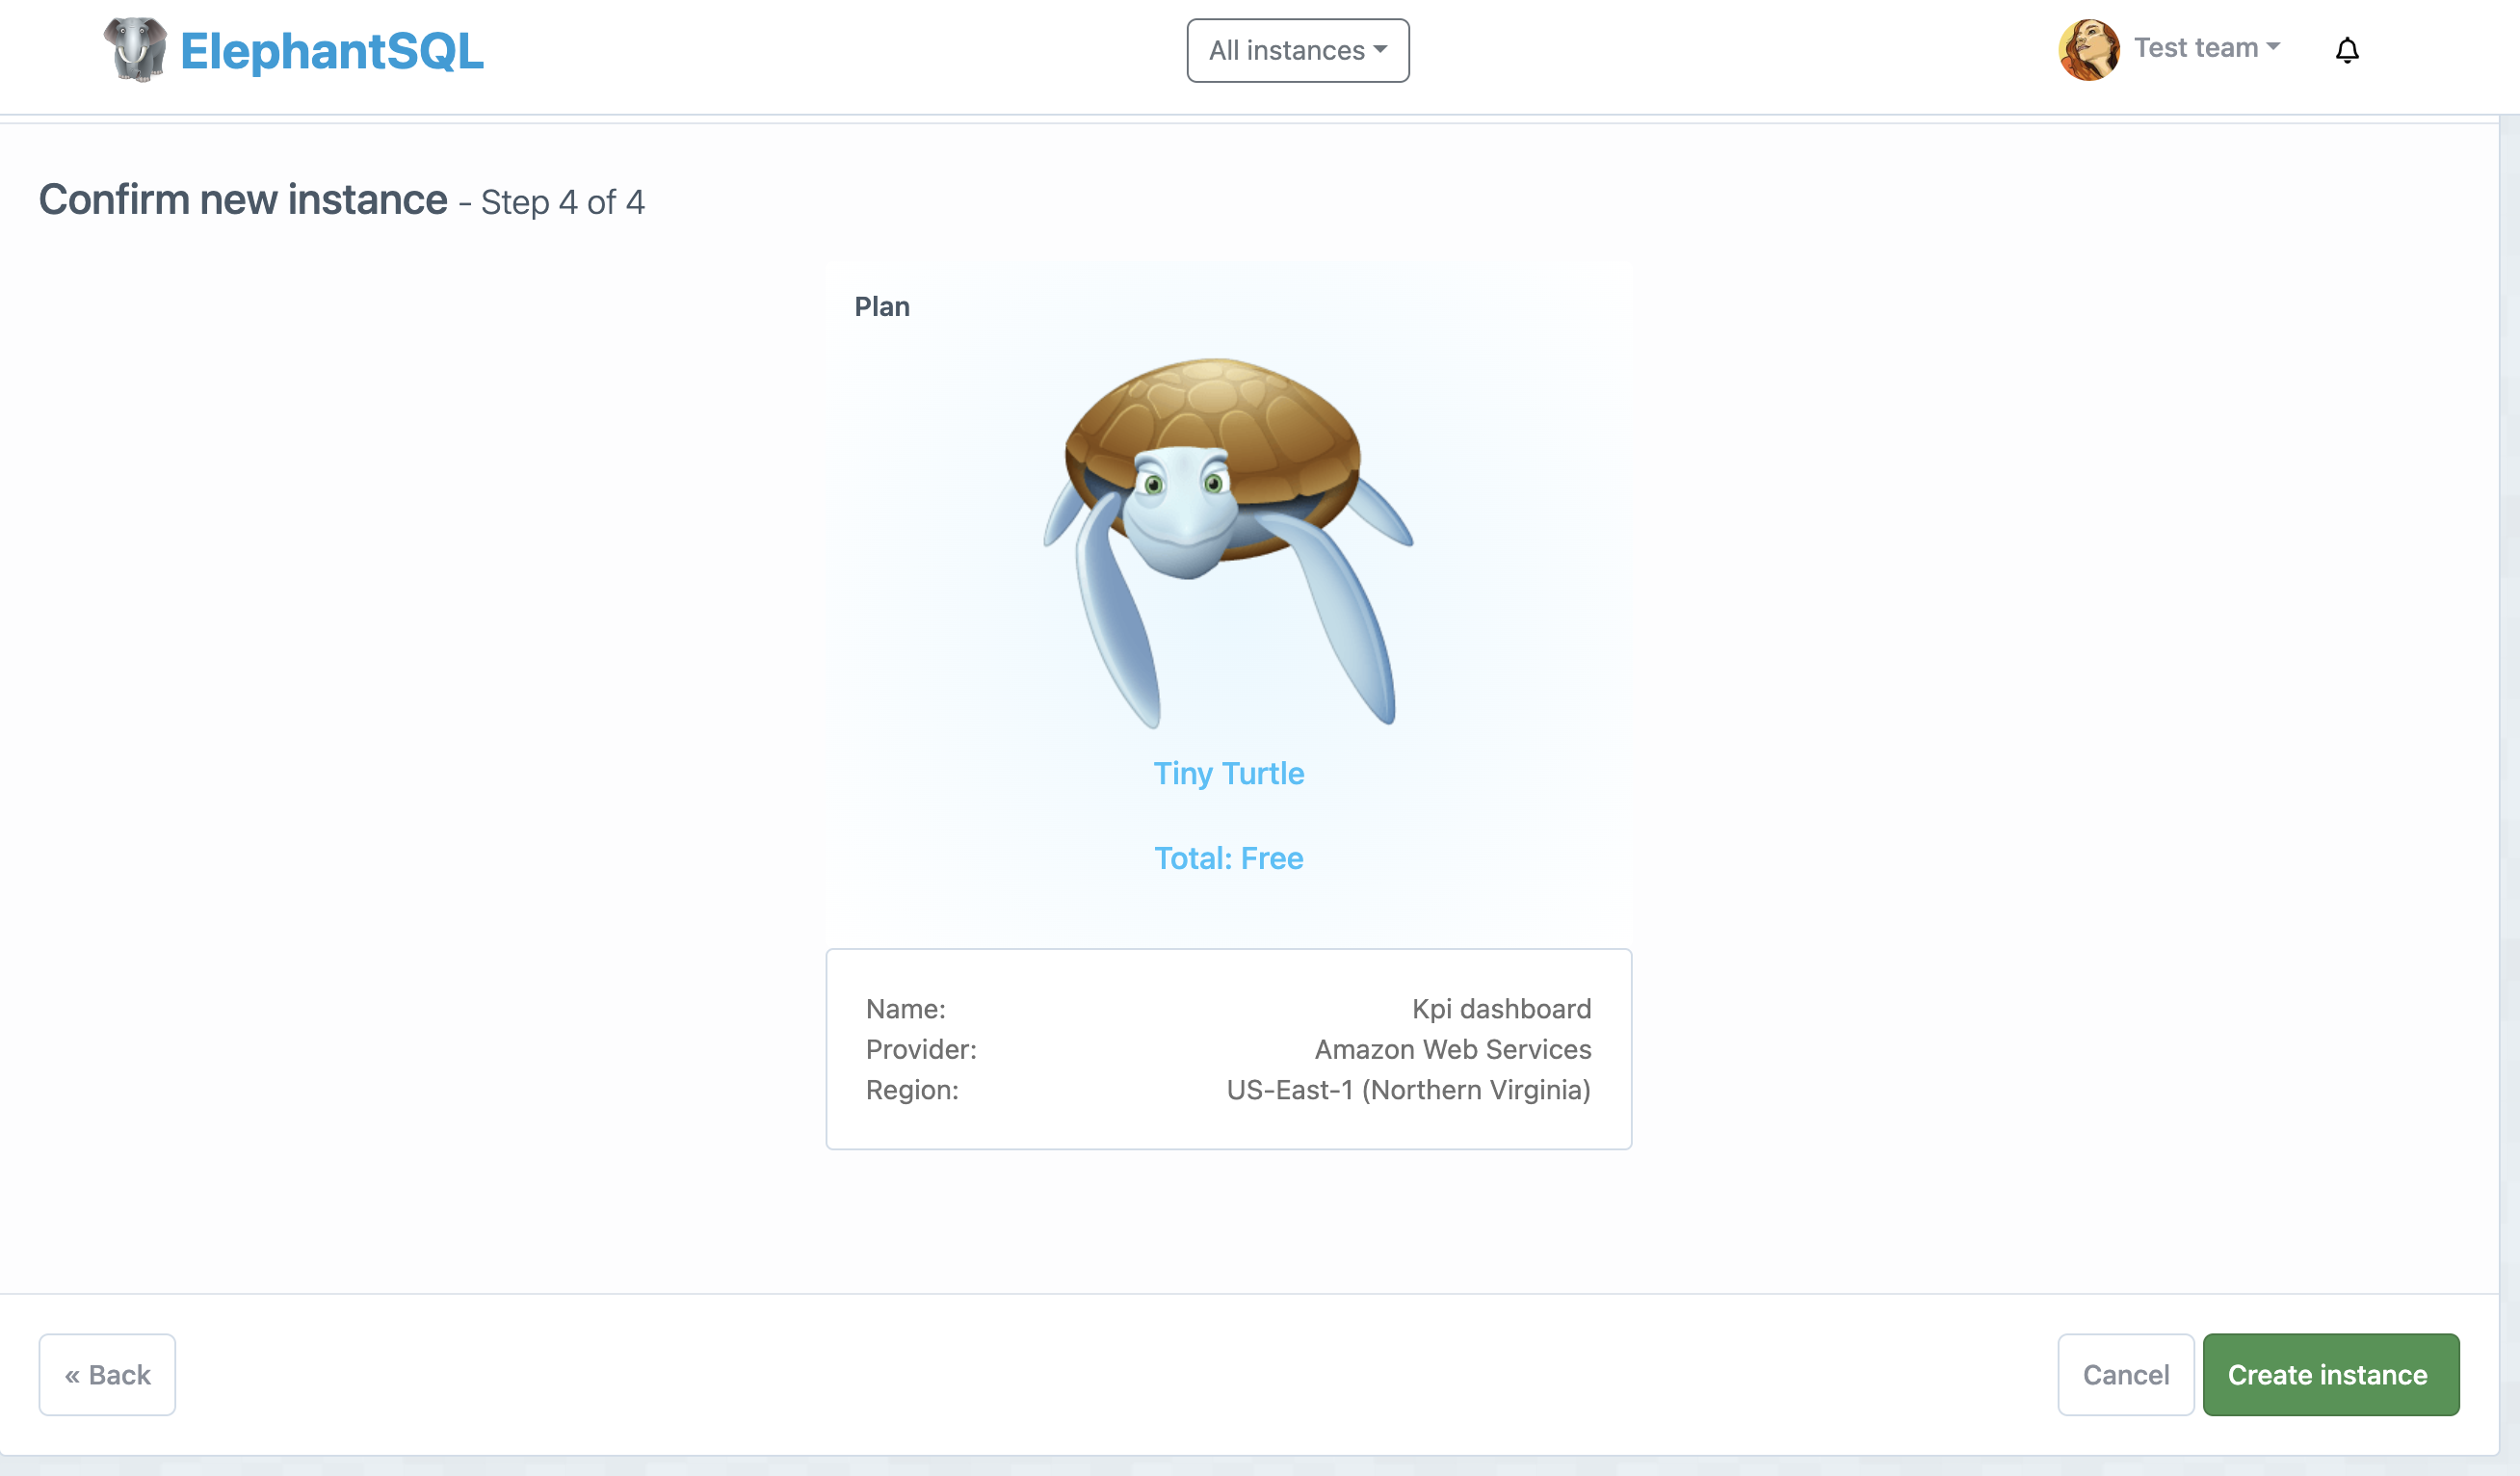
Finally, click Review, and if everything looks good, click Create instance:
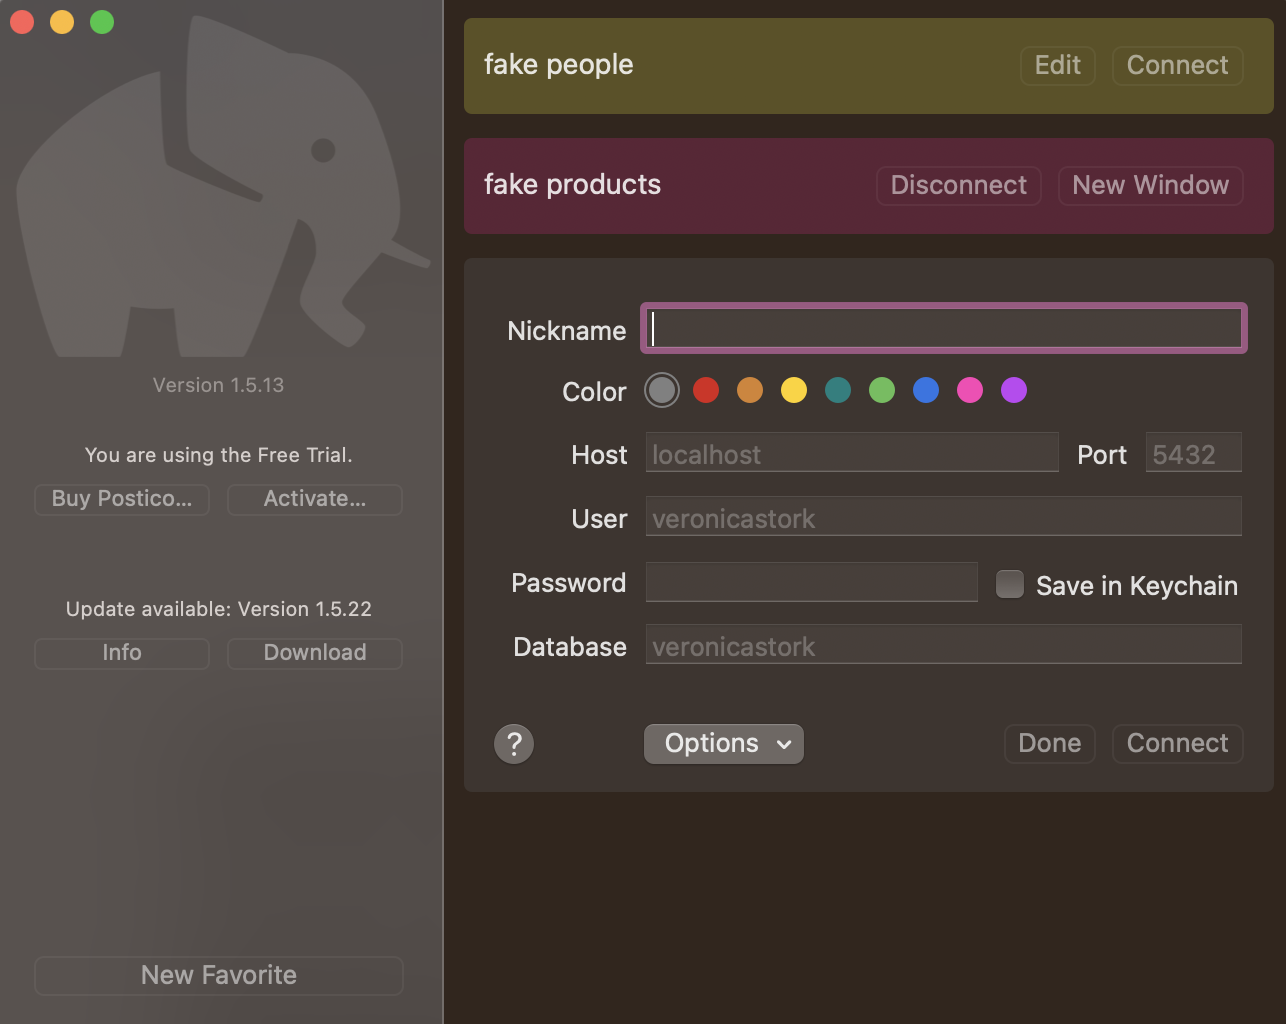
Once we have created the database instance, we need to connect to it. To do this, open Postico and click New Favorite. In the dialog box, enter a nickname for the database, then fill in the host, user, and password fields using the information displayed in the Details tab of the ElephantSQL instance. Finally, click Done, then click Connect:
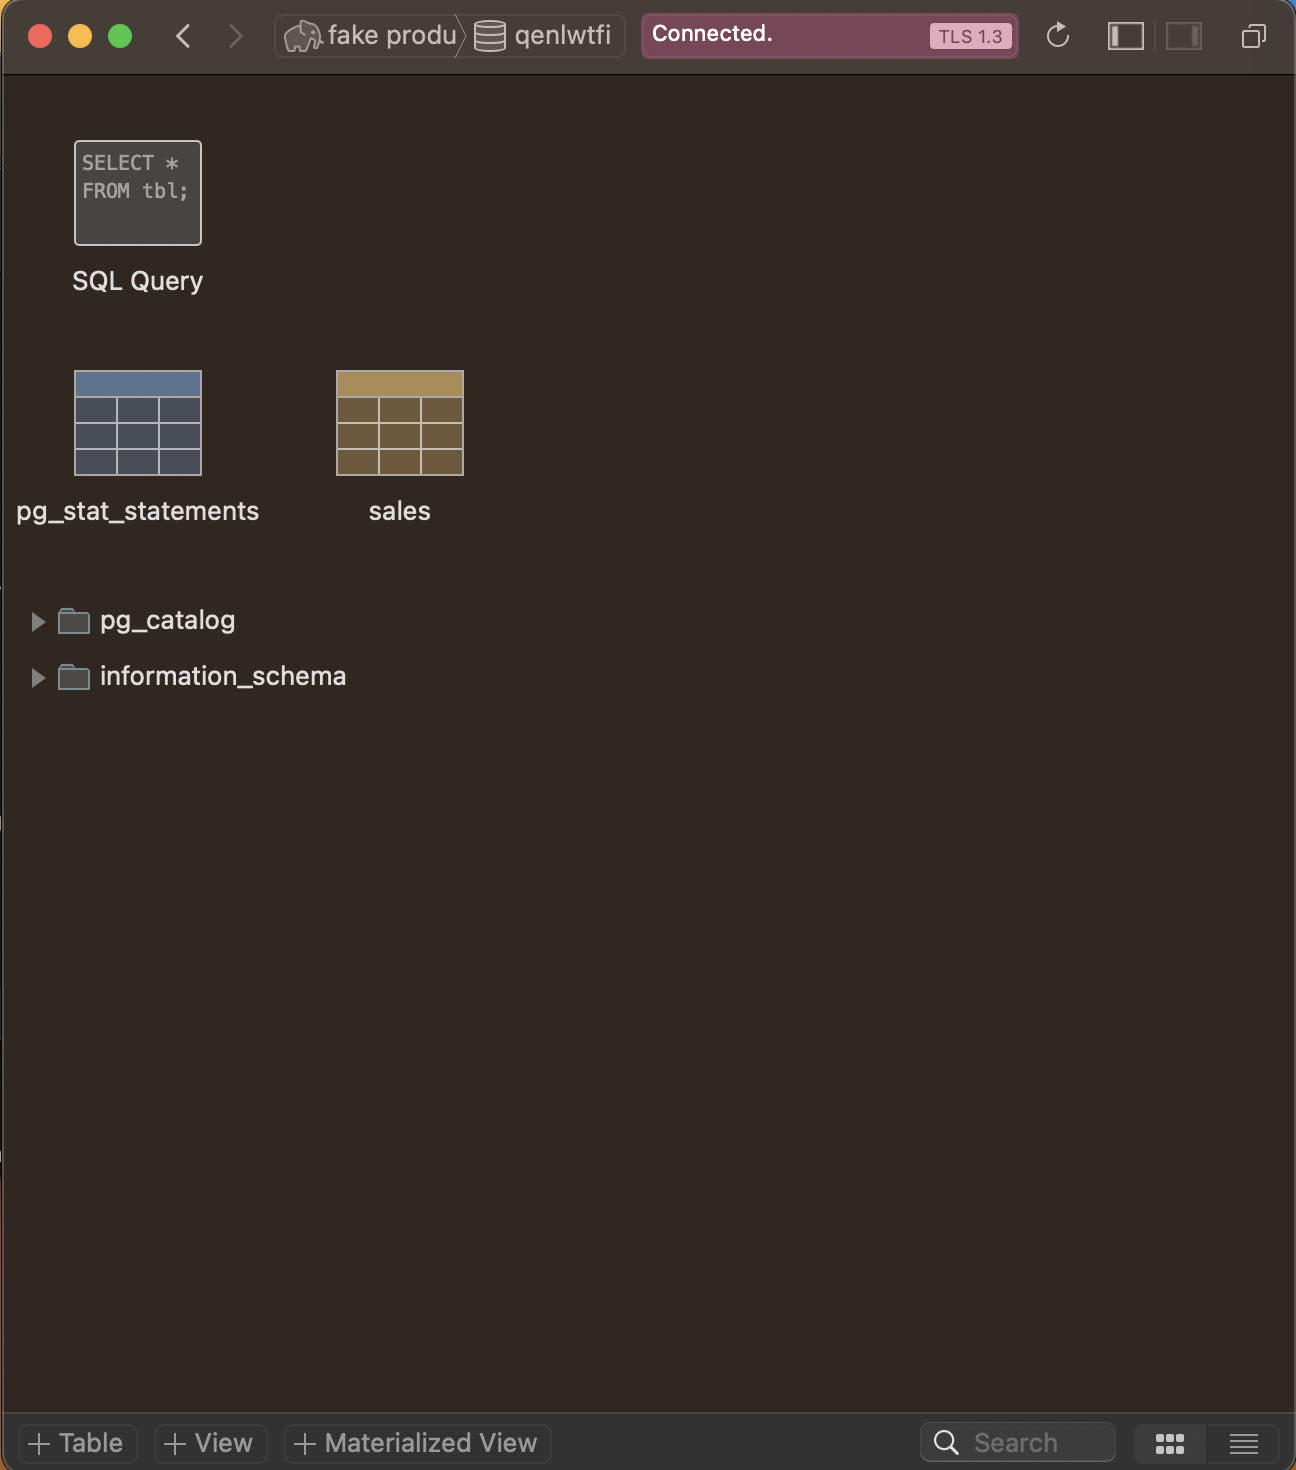
After connecting to the database, use Postico to create a new table. To do this, click the + Table button on the bottom of the window, which opens a table edit screen:
Name the new table sales, then populate it with the columns shown in the following image using the + Column button on the bottom of the window:
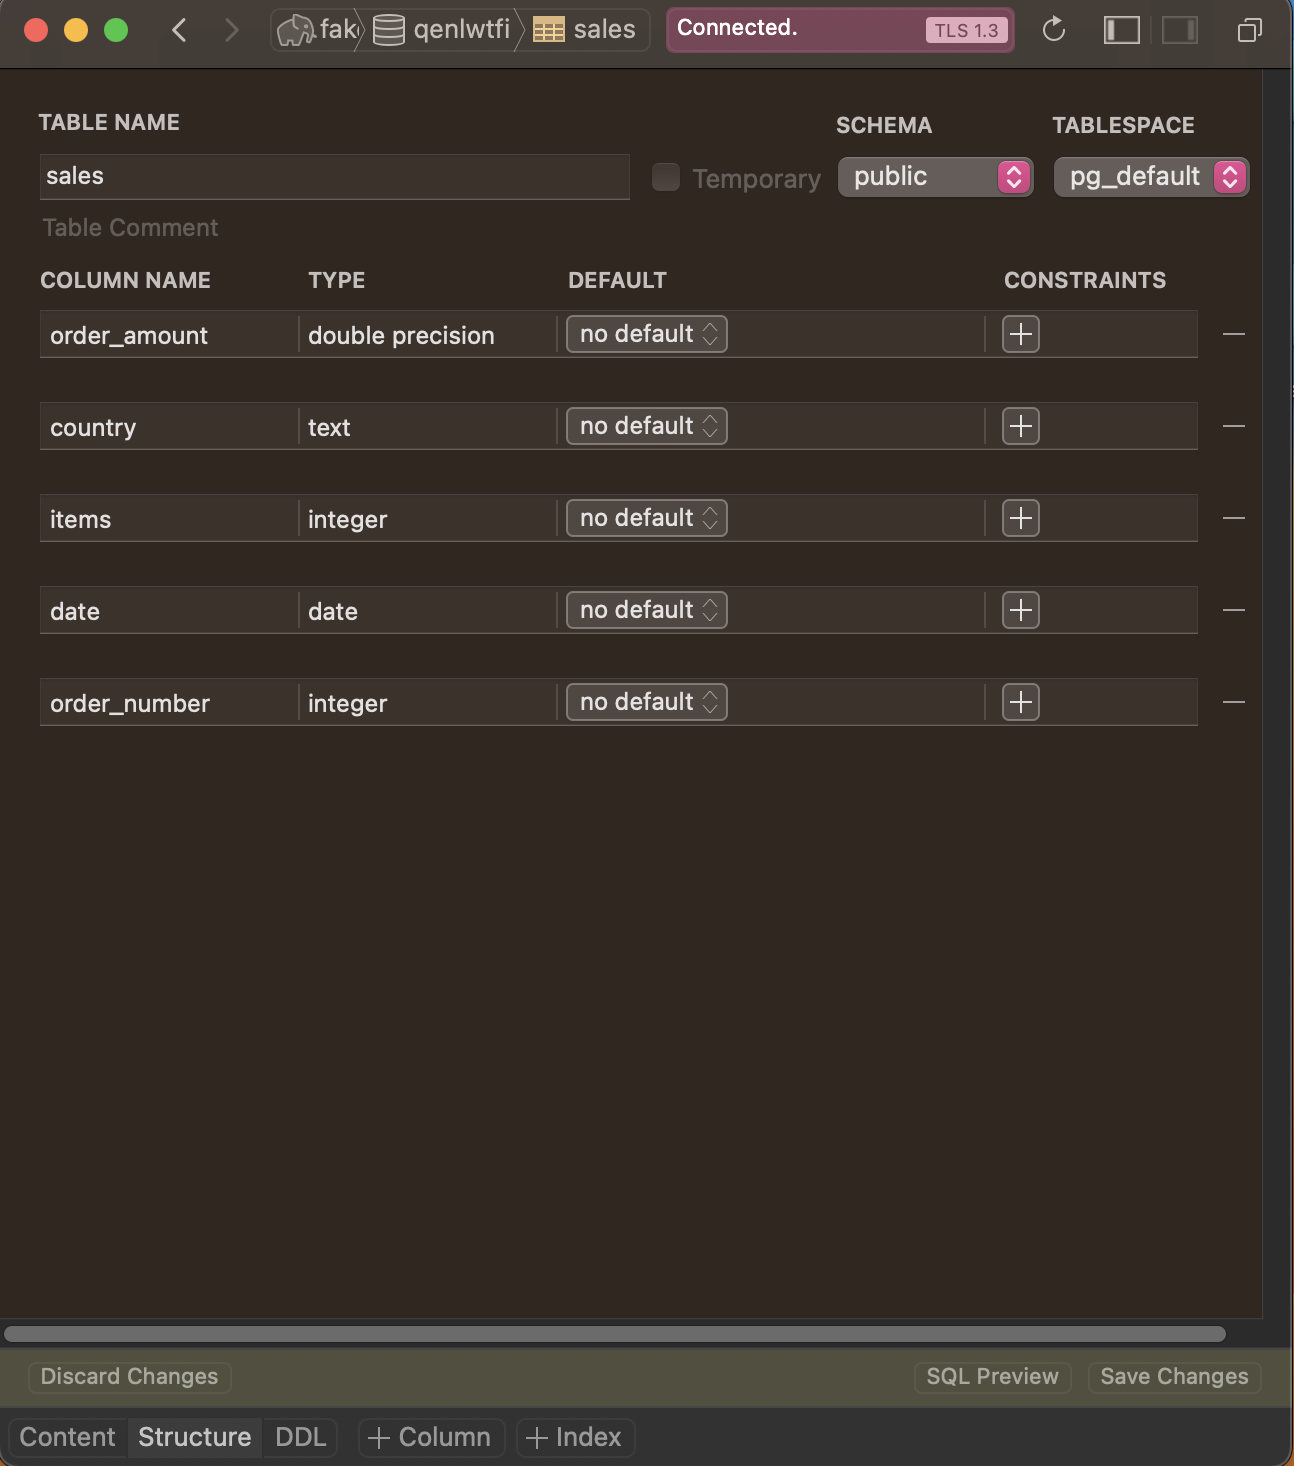
Once all the columns have been added, click Save Changes on the bottom right of the window.
To import the CSV and populate the database with the mock sales data, click File > Import CSV, select the file that you downloaded earlier, and click Open. Then, click Match Columns and select Match Columns By Name. Make sure that First Row is Header is checked. Finally, click Import:
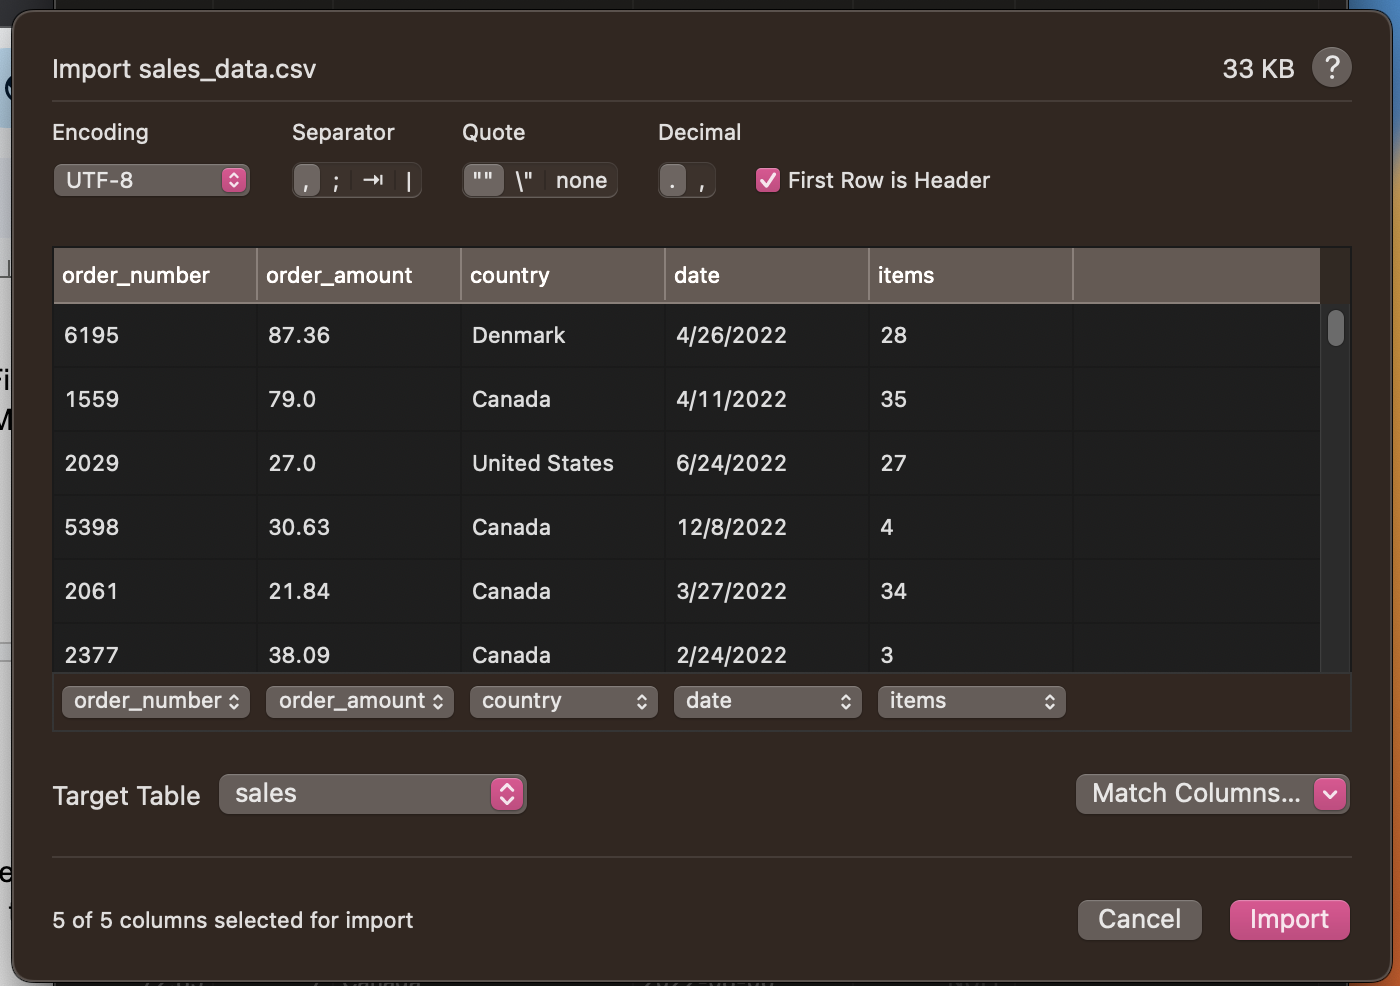
We now have a database full of mock sales data to use for the KPI dashboard.
Connecting to the database from Airplane
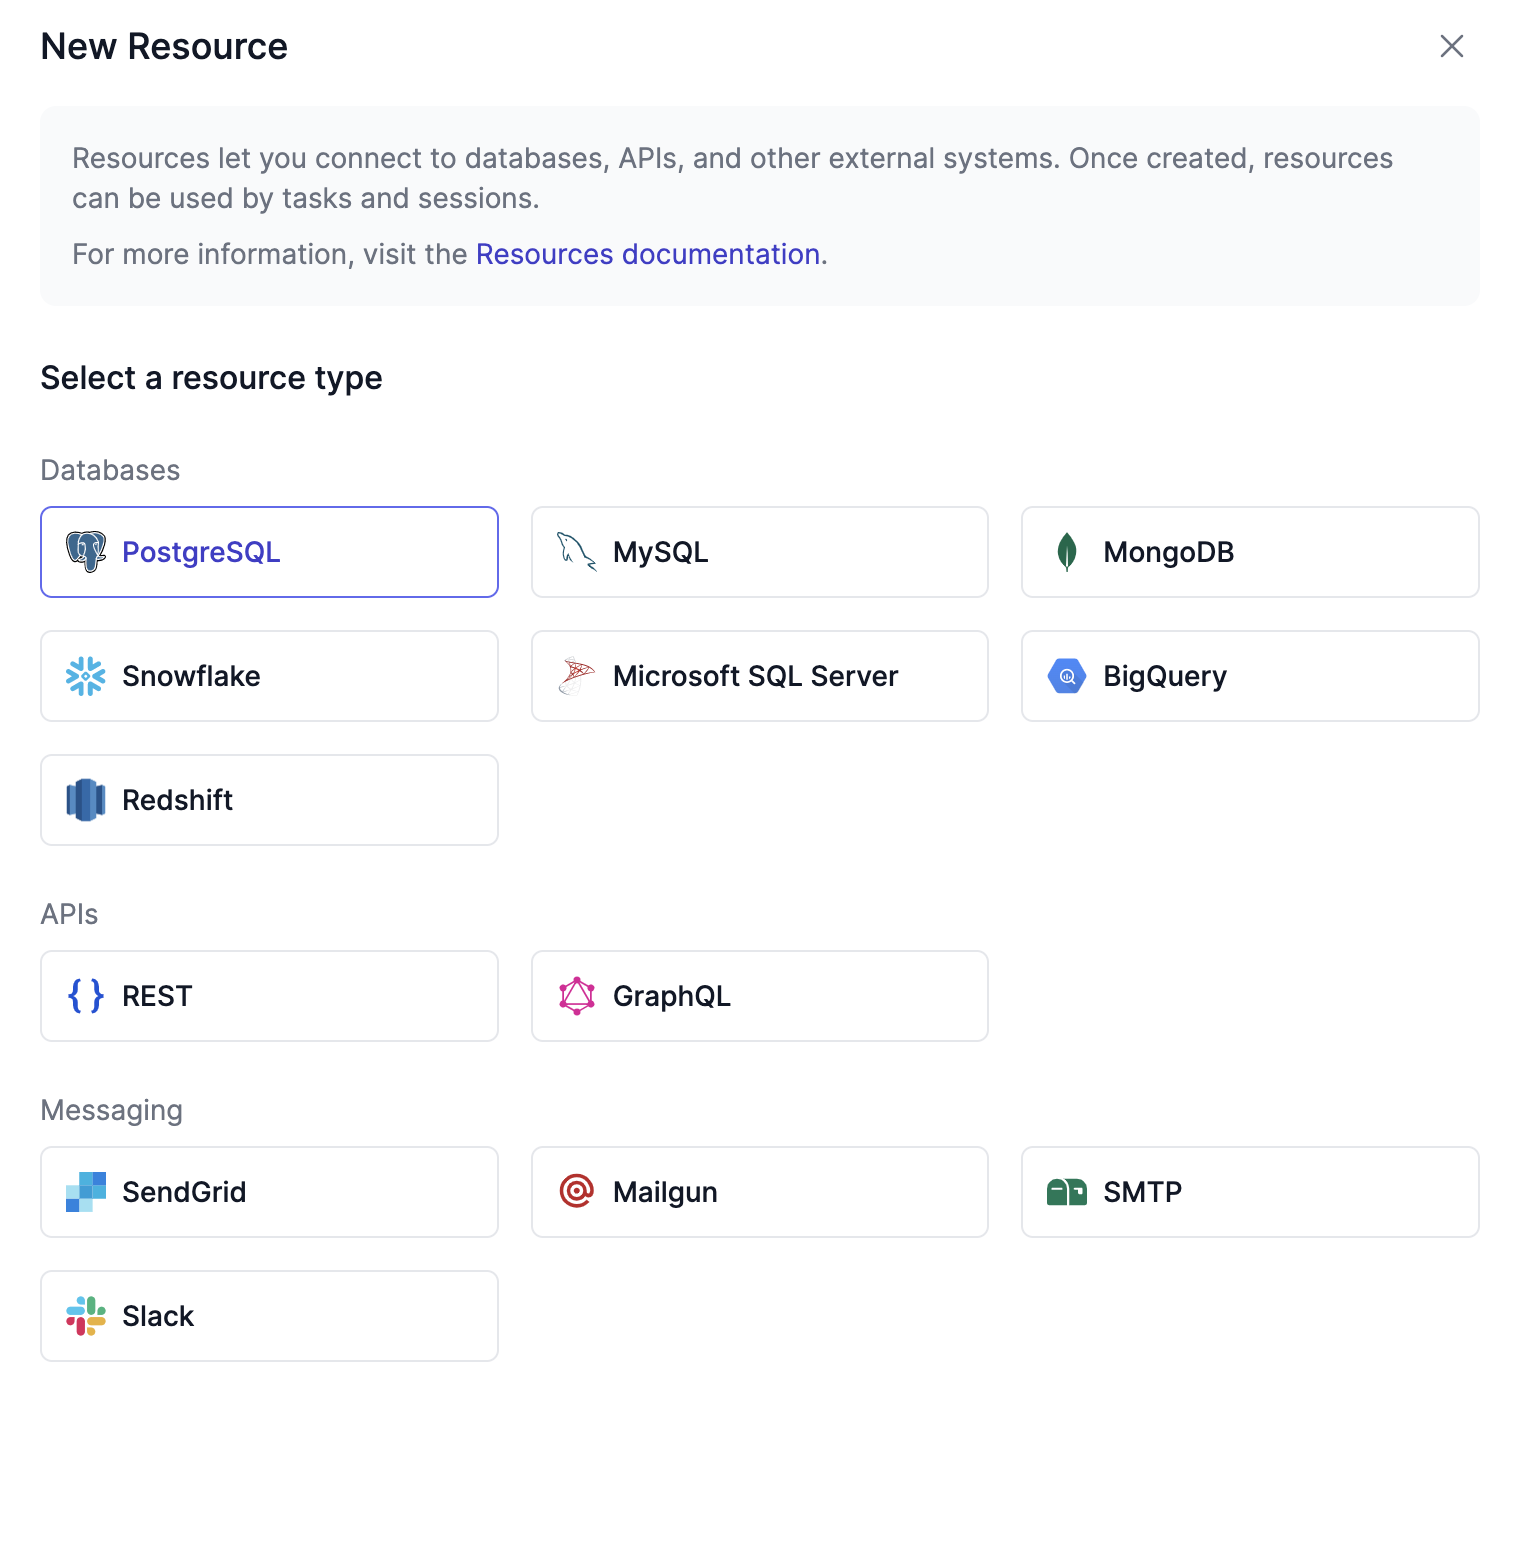
To use the database with Airplane, we need to add it as a Resource. Airplane works with all kinds of resources, such as SQL Server, MongoDB, GraphQL APIs, and REST APIs. Since this tutorial uses a Postgres database, we'll need to add a Postgres resource.
To add the resource, log into the Airplane account, then go to the team's Resources page and select PostgreSQL:
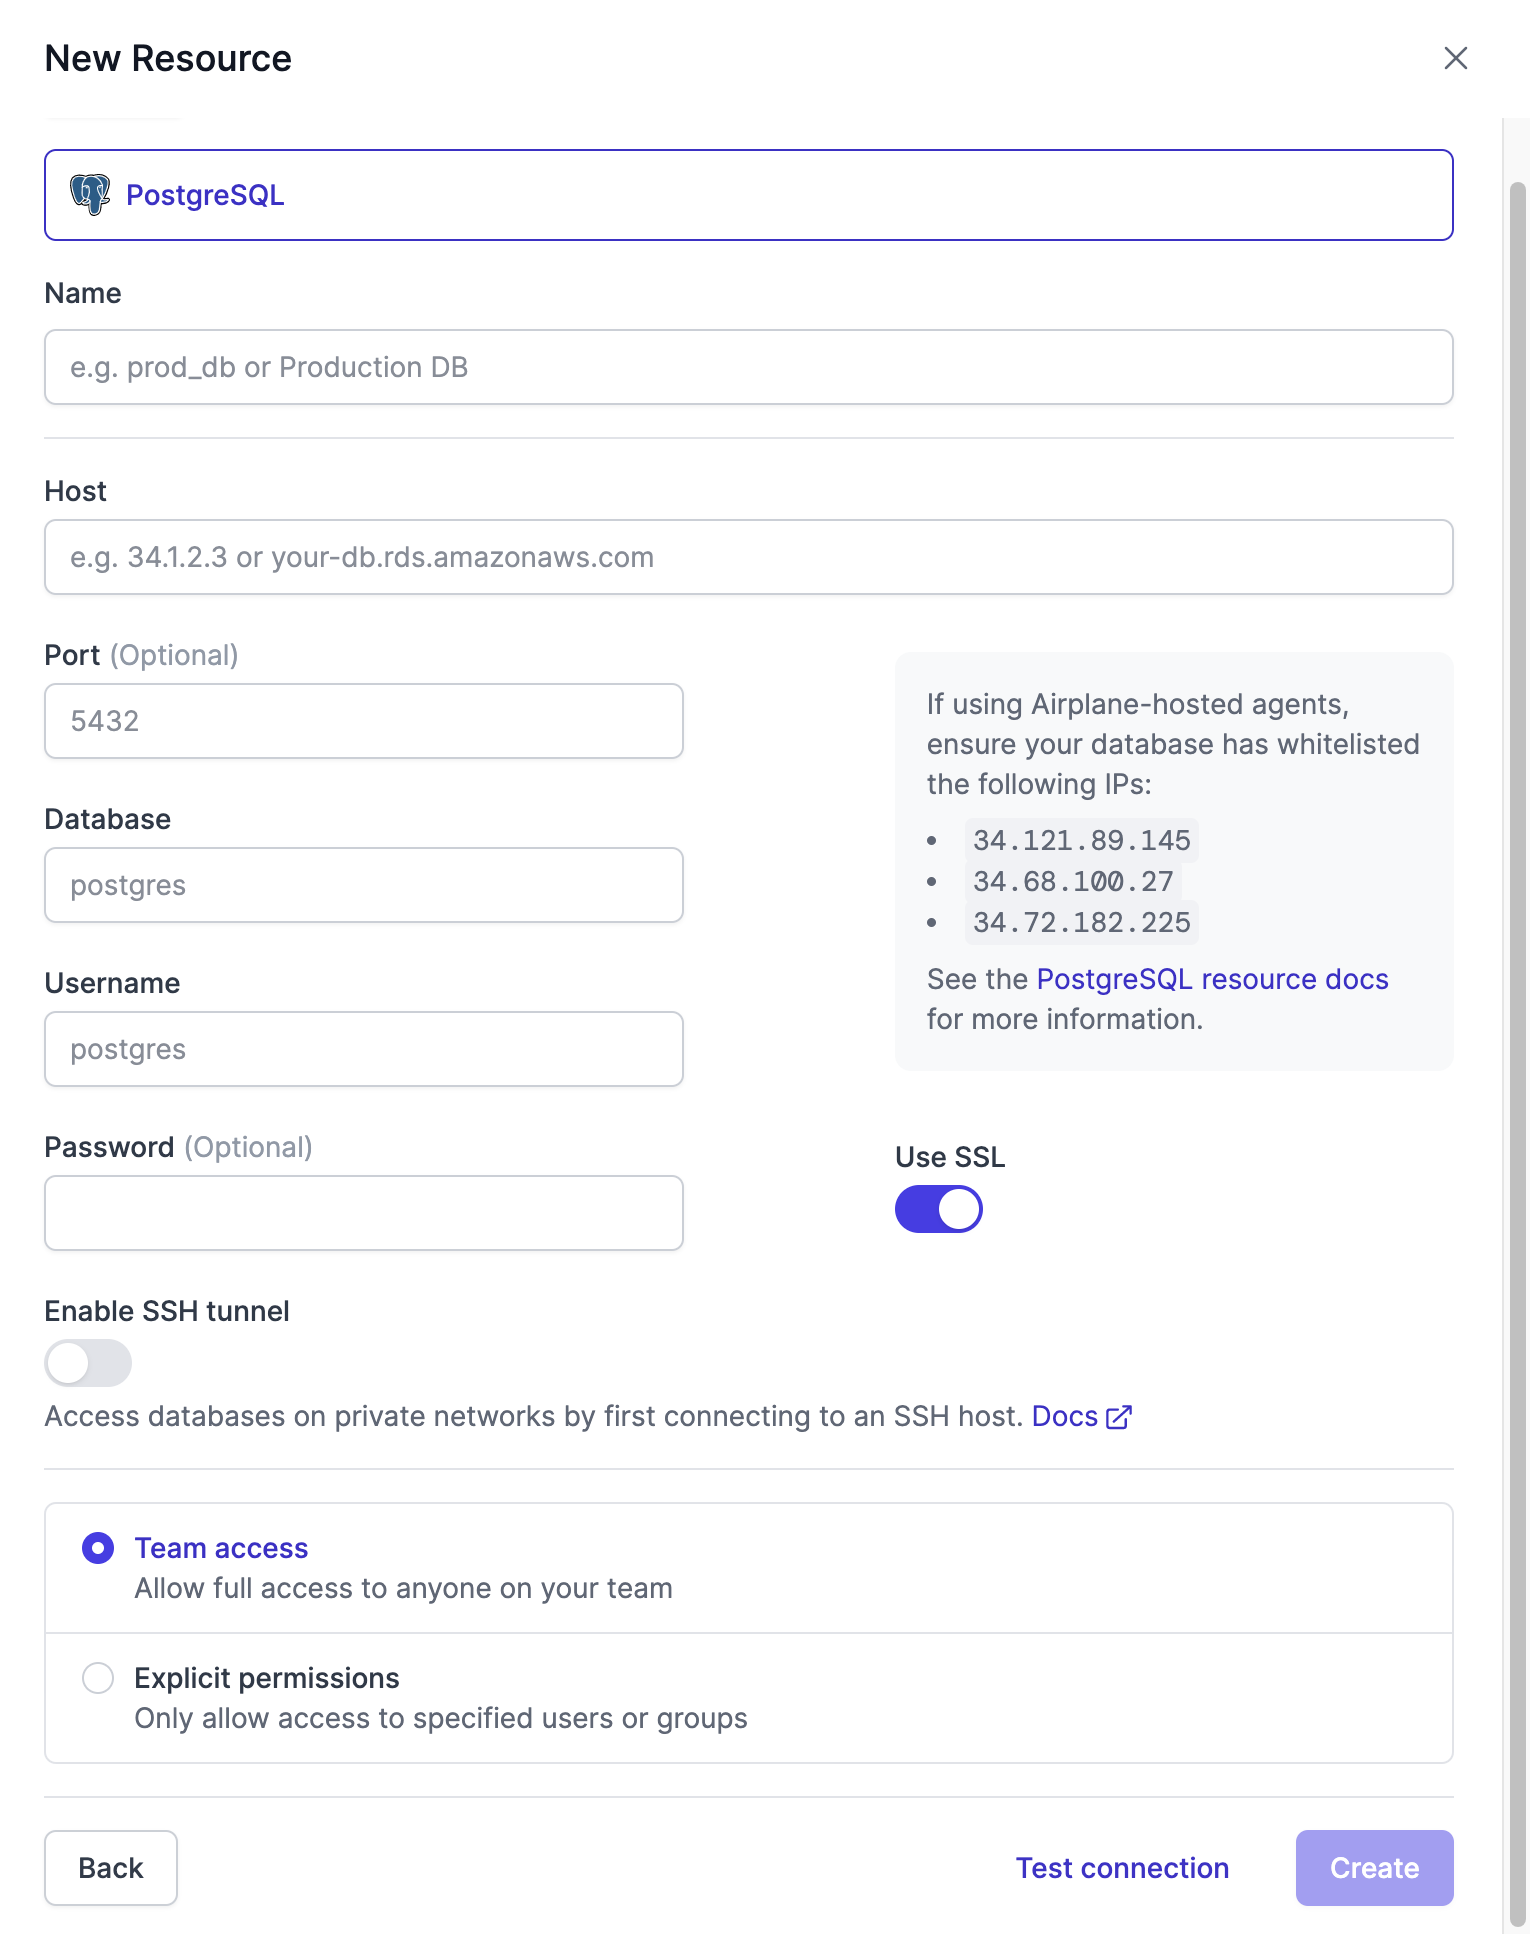
Next, give the resource a name, like sales_db. Fill in the host, port, database, and other information. We can test the connection by clicking Test connection at the bottom of the window. This button runs a test query. If successful, click Create:
Creating an Airplane View
After we've connected to the database, we need to create a View and start a dev server so we can develop it locally. In Airplane, a View is a UI that uses a library of React components that can connect easily to the backend using Tasks.
We will create a View using the Airplane CLI. Open a terminal window and make sure you are in the folder you created for this project. Ensure you are logged into the CLI. To log in, type airplane login. Follow the instructions displayed in the terminal to log in using a token or the browser.
Once logged in, initialize a new View by running airplane views init.
When prompted for a name for the View, type in KPI Dashboard.
Once the View is created, type airplane dev to start the dev server. A Studio session will be started in the browser. Press Enter to open Studio in the browser.
Making your database reachable locally
Before continuing, we must ensure that the database is reachable locally by adding it as a local resource. In Studio, click Resources, then click the + icon next to LOCAL and add the resource the same way you did for production:
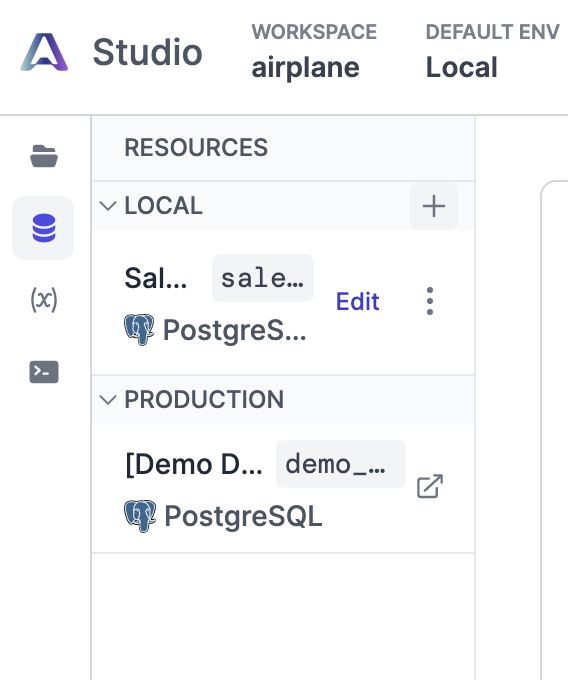
We're now ready to create tasks!
Creating Airplane Tasks
Now that we've connected to the database using Airplane, created a View, and started the dev server, it's time to create some Airplane Tasks. For this project, we'll create the following three SQL tasks:
- Get total revenue
- Get revenue by country
- Get revenue by month
To create a SQL task, open another terminal window and run airplane tasks init. We'll be prompted for details about the task. For the first task, name it get total revenue, then use the down arrow to select SQL from the list of types of tasks. Press Enter to accept the suggested names for the script and definition files. Repeat this process for get revenue by country and get revenue by month.
Next, we need to edit the scripts to include the SQL queries. Open get_total_revenue.sql and edit the SQL query to say the following:
This query simply sums the order_amount values of all of the rows and returns that number.
Then, open get_revenue_by_country.sql and edit the SQL query to say the following:
This query returns the sum of orders by country and orders them alphabetically by country.
Finally, open get_revenue_by_month.sql and edit the SQL query to say the following:
This query returns the sum of all orders during each month of 2022.
After we have made the above edits to the task SQL files, we need to add the name of the database resource to their definition files so that they can connect to the database. If we accepted the default names at setup, the definition files will have the same names as the SQL files but with a .task.yaml file extension.
Open each definition file and scroll down to the sql configuration section. For resource, type the name of the database resource inside the quotation marks.
Developing your View locally
Now that we have a database with connected tasks, we can add components to the View. First we'll create a layout, then create individual components to display data from each of the tasks.
Creating a layout
To work on the View, open the View entry point. This entry point is a TypeScript file and follows the pattern file_name.airplane.tsx. In this file, delete the contents of the return statement and replace them with the following:
Next, edit the top import statement to include just the Stack component:
This uses the Airplane Stack component to create a grid layout where you can put your dashboard components.
Creating the RevenueByMonth chart component
The first component we'll make shows sales by month using a task-backed bar chart component. In KpiDashboard.airplane.tsx, under the KpiDashboard component, create another functional component called RevenueByMonth. It should look something like this:
In this component, we use a built-in Airplane Card component that includes a grow prop to hold the chart. The grow prop simply enables the Card to expand and occupy any available space.
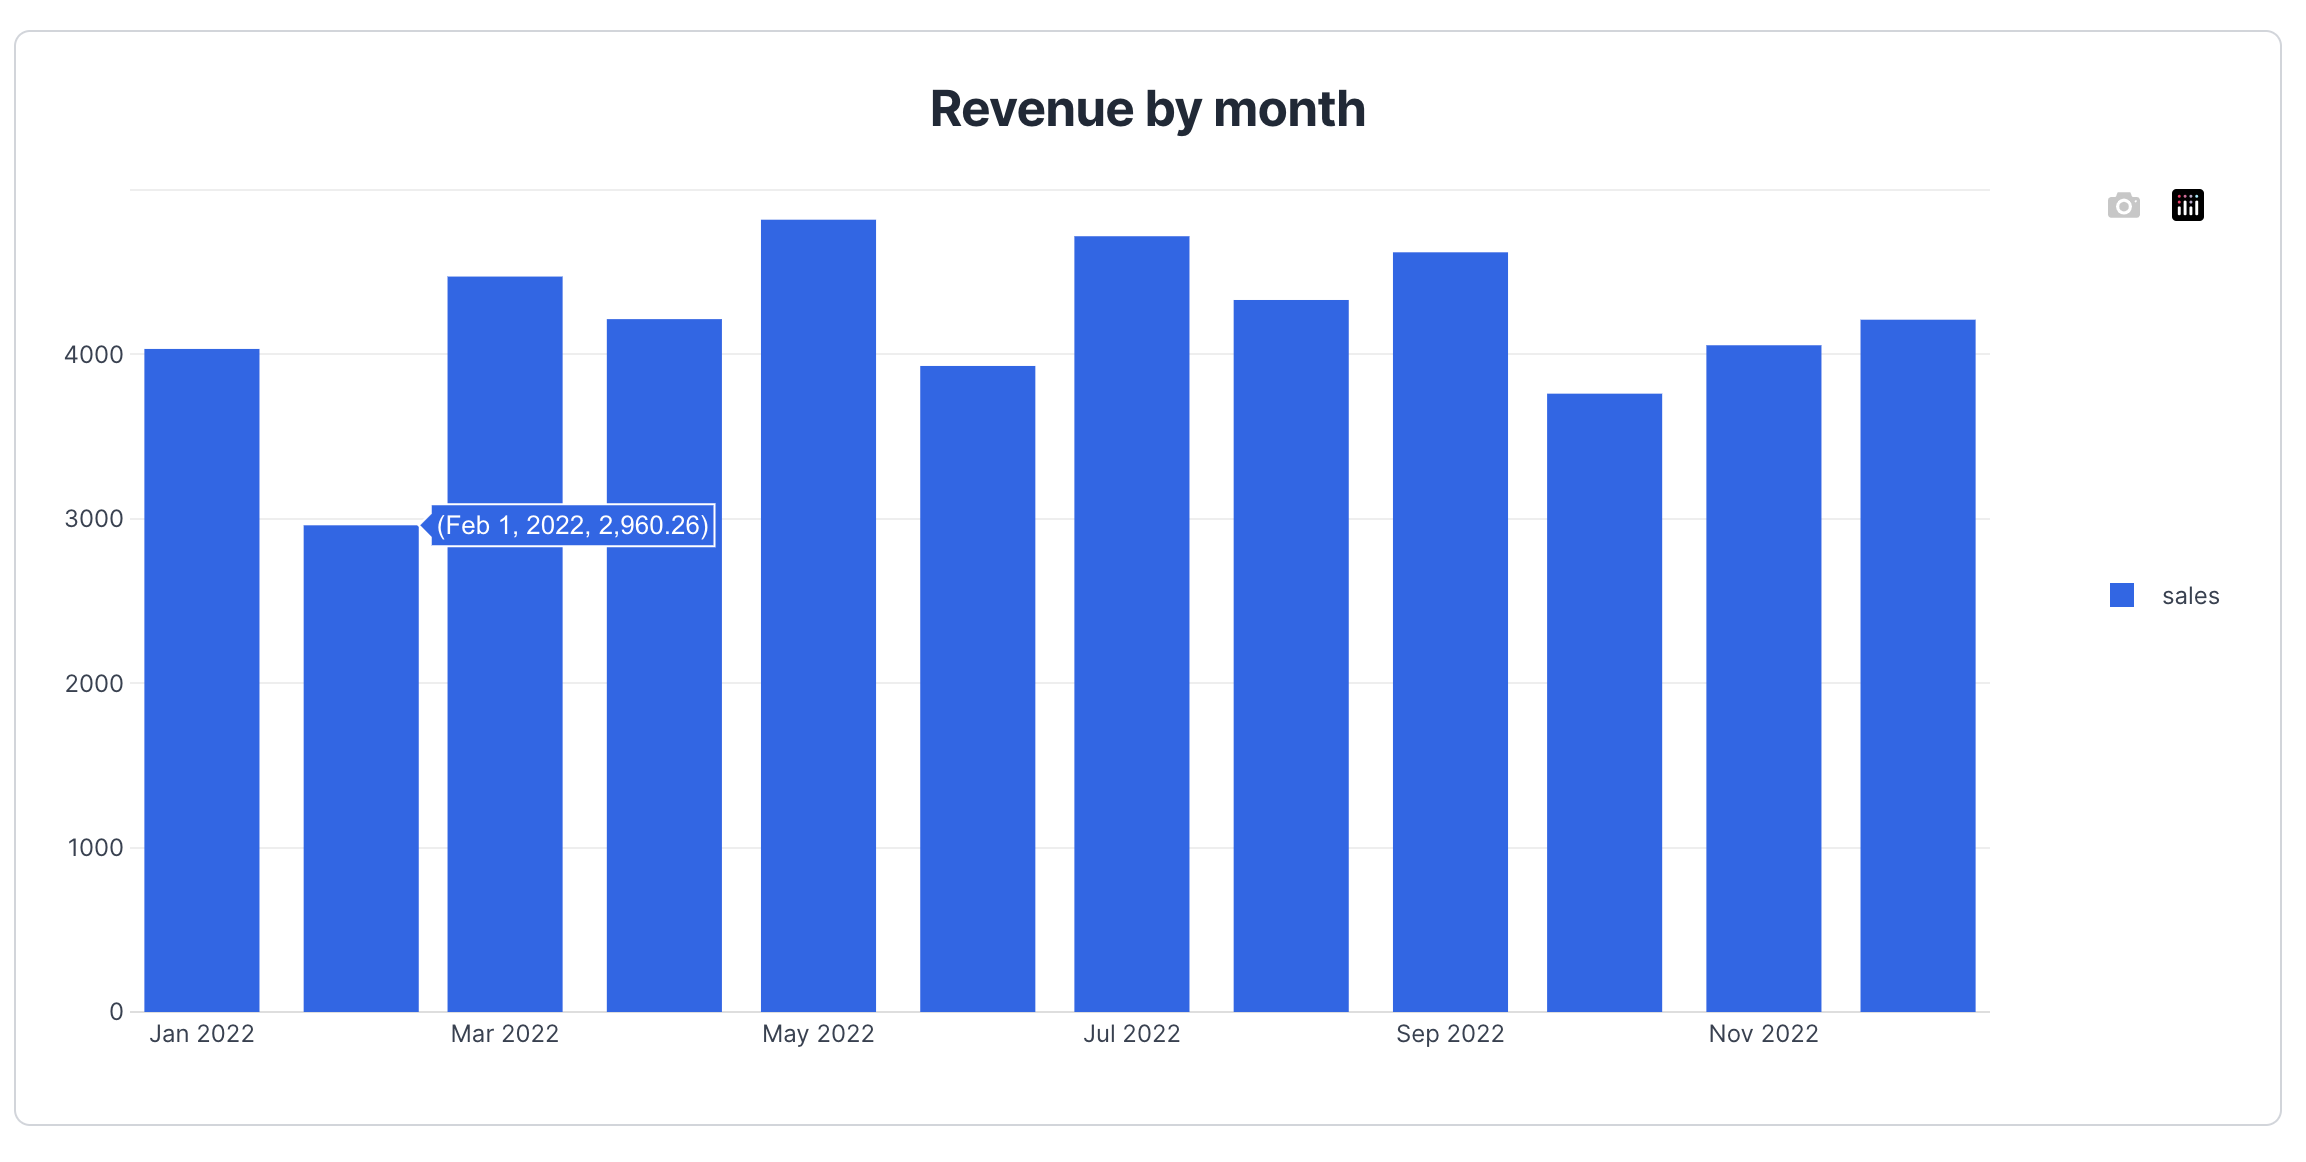
The Card component also contains the task-backed Chart component. Task-backed components are a simple way to connect certain types of Airplane components to a task. These components automatically execute the task, populate data, and handle loading and error states. All we have to do is pass the name of the task (in this case, get_revenue_by_month) as a prop, and it infers how the data should be displayed. Because get_revenue_by_month returns the months and the sum of orders during each month, the Chart component uses each of these data points for the two axes.
We must ensure we edit the import statement to include the Chart and Card components, then nest the RevenueByMonth component inside the first inner Stack component so it displays in the grid. KpiDashboard.airplane.tsx should now look like this:
Navigate to Studio to view the dashboard. It should look like this:
Creating the RevenueByCountry component
Next, we'll create a pie chart that shows the share of revenue by country. To do this, create another functional component called RevenueByCountry under the RevenueByMonth component. RevenueByCountry should look like this:
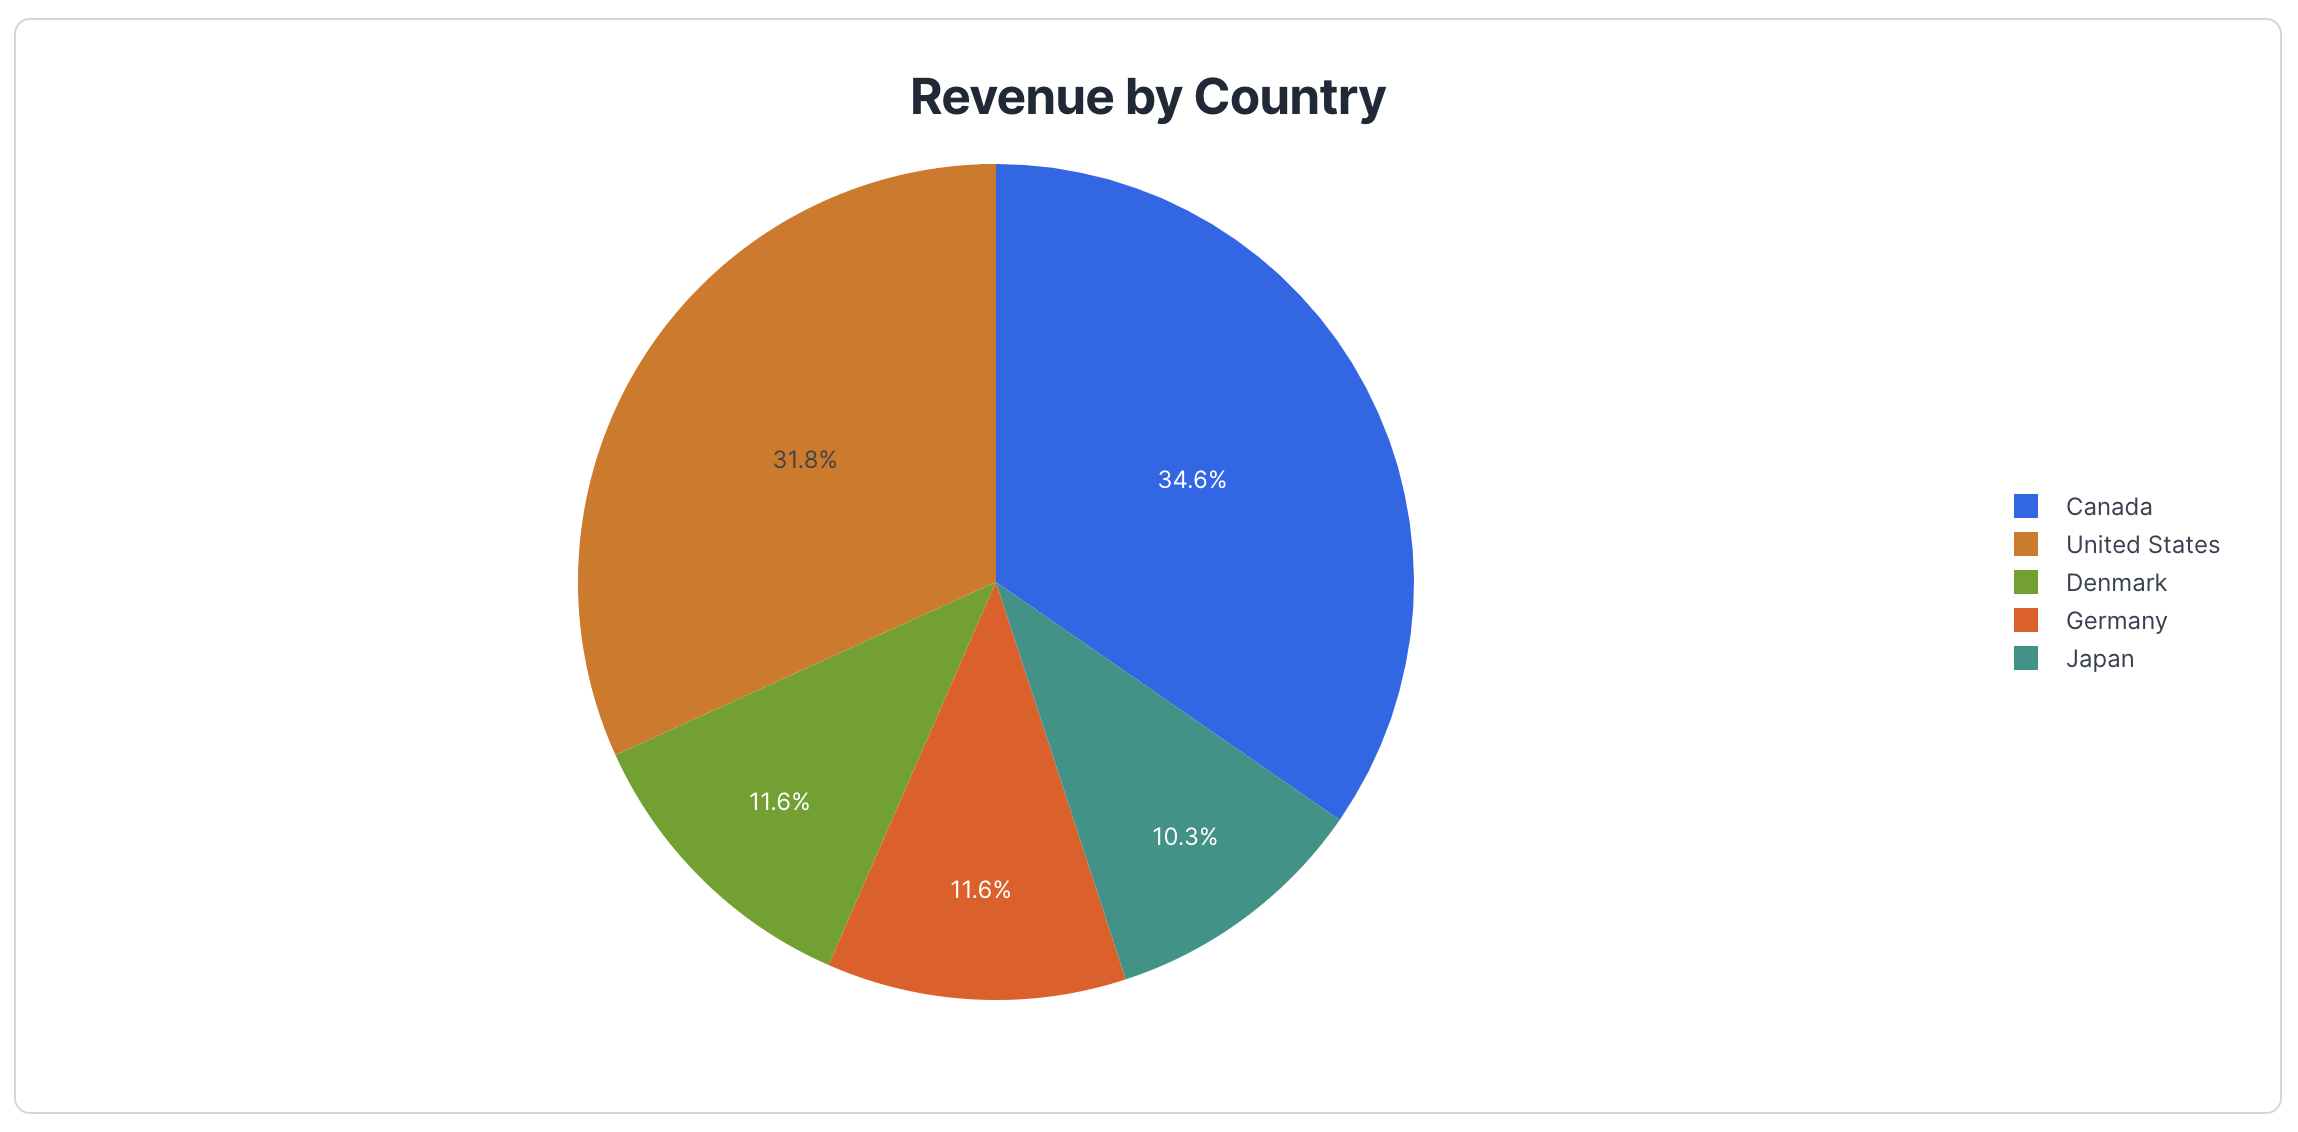
This component is similar to RevenueByMonth, except Chart is a pie chart. Pie charts only take a single axis, which is why the get_revenue_by_country task is set up to only return the revenue for each country, not the country name. Recall that the results of this task are ordered by country, meaning that they are in alphabetical order. So, for the labels prop, we can list the countries alphabetically in an array, and they will correspond to the correct data.
Now that we've created the RevenueByCountry component, nest one inside the second inner Stack component in KpiDashboard to place it in the second row of your grid. Then, save the file and navigate to Studio.
The RevenueByCountry component should now appear below the RevenueByMonth component and look like this:
Creating the TotalRevenue component
Finally, let's create one more functional component called TotalRevenue below RevenueByCountry. This component will display total revenue as a text element using an Airplane Heading component. Unlike charts, Heading components cannot be directly task-backed. So, if we want to use Heading components to display data from a task, we need to employ the useTaskQuery hook. While task-backed components handle errors and loading for us, we must do this ourselves when using hooks. The TotalRevenue component should look something like this:
Make sure the import statement is edited to include the Heading, Loader, and Text components, along with the useTaskQuery hook.
In the TotalRevenue component, we use the useTaskQuery hook to execute the get_total_revenue task. Two if statements cover loading and errors by returning the Airplane Loader and Text components, respectively. The return statement includes the component that is returned on success: a Card component containing a title in a Heading component and the output of the task in a smaller Heading component. The color prop is set to green to make it stand out, and the text is displayed using a template literal. The toFixed method is used to round the result to two decimal places.
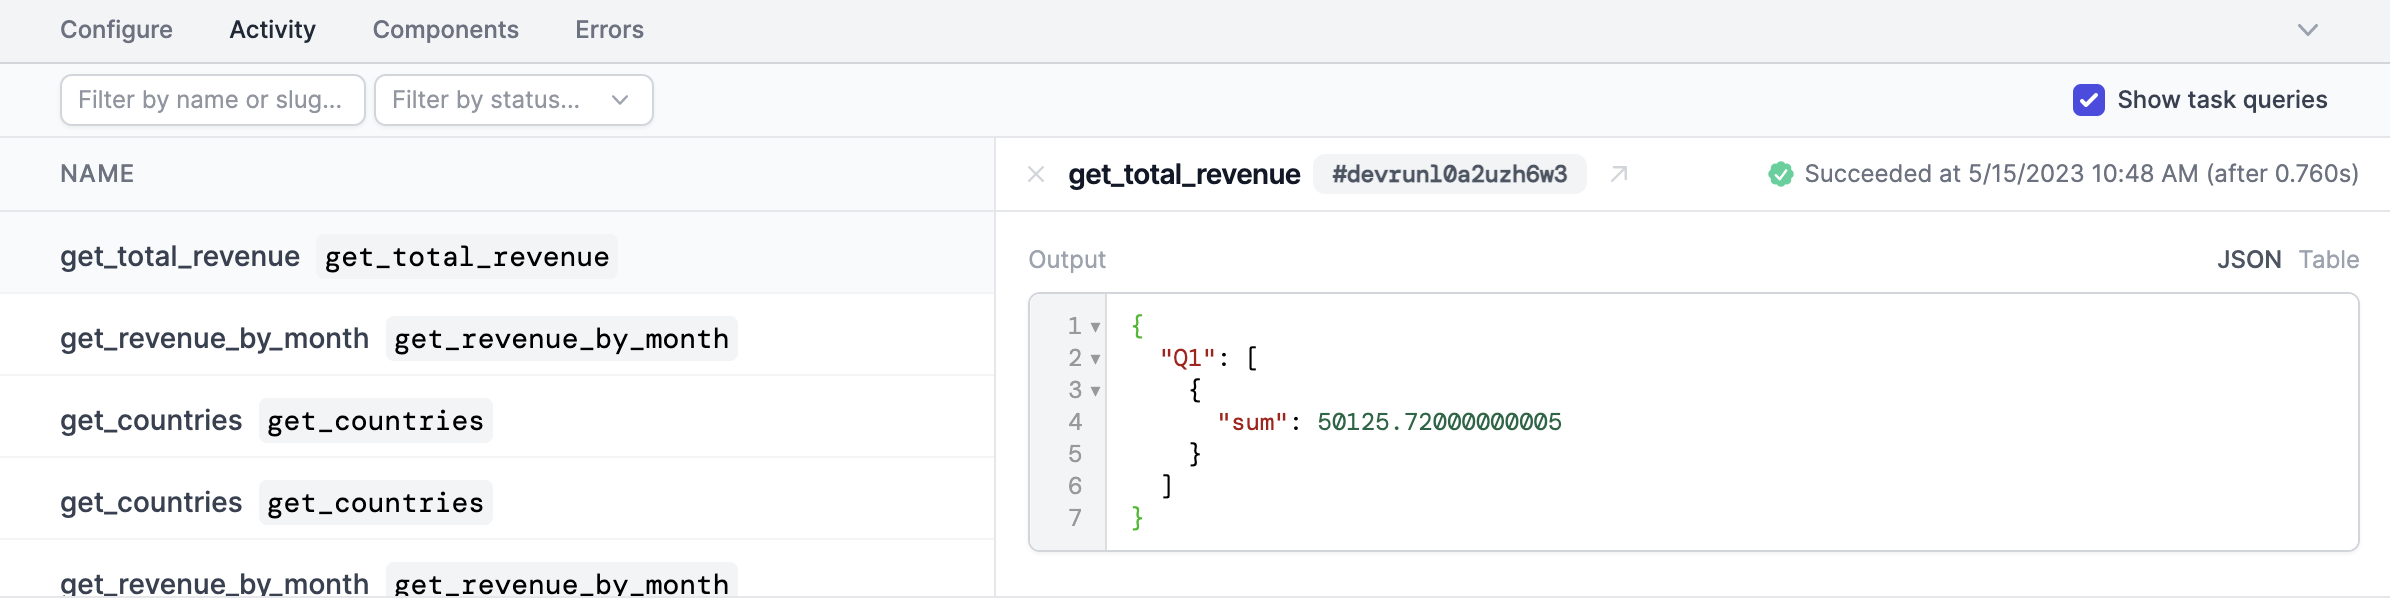
With task-backed components, we do not need to access output directly. However, when using hooks, we do need to tell the component where to find the data that we want to display. To find the location of the output data, we can use the Activity tab in Studio. This tab is located at the bottom of the window and displays each task query. Click get_total_revenue on the Activity tab. This brings up the output for the task to the right, where we can see the data structure of the returned data. We can see in the following screenshot that sum is contained within a single object in an array (the array is the value for the Q1 key in the output object):
Now that we've created the TotalRevenue component, nest one inside the second inner Stack component in KpiDashboard, just above RevenueByCountry. Then, save the file and navigate to Studio again.
The TotalRevenue component should now appear to the left of the RevenueByCountry component.
Deploying your Airplane View
Once we are happy with the dashboard, we can deploy the View using the Airplane CLI. Run airplane deploy in the terminal from the folder where you have the files for this project. The CLI will discover all Airplane Tasks and Views in the current directory and its child directories and deploy them.
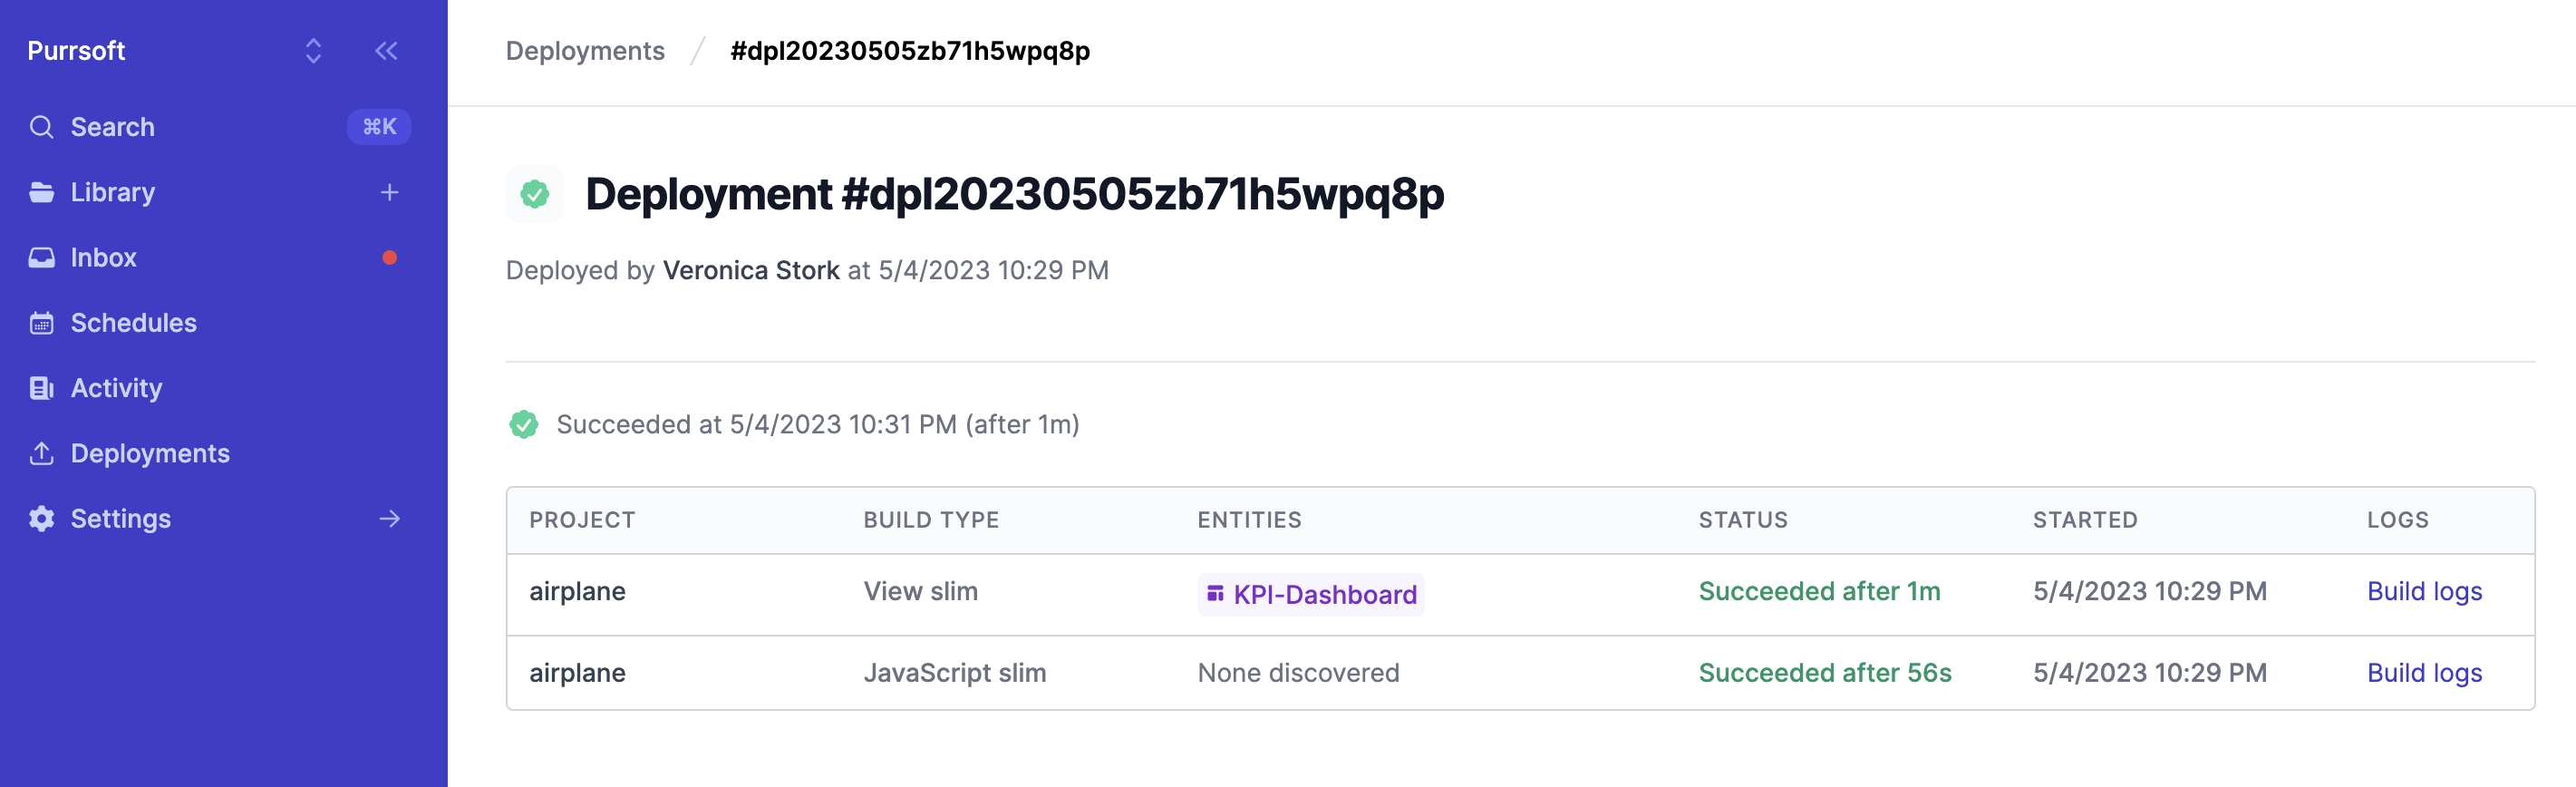
If the deployment is successful, a link will be displayed in the terminal. From that link, we can see projects included in the deployment and build logs:
Conclusion
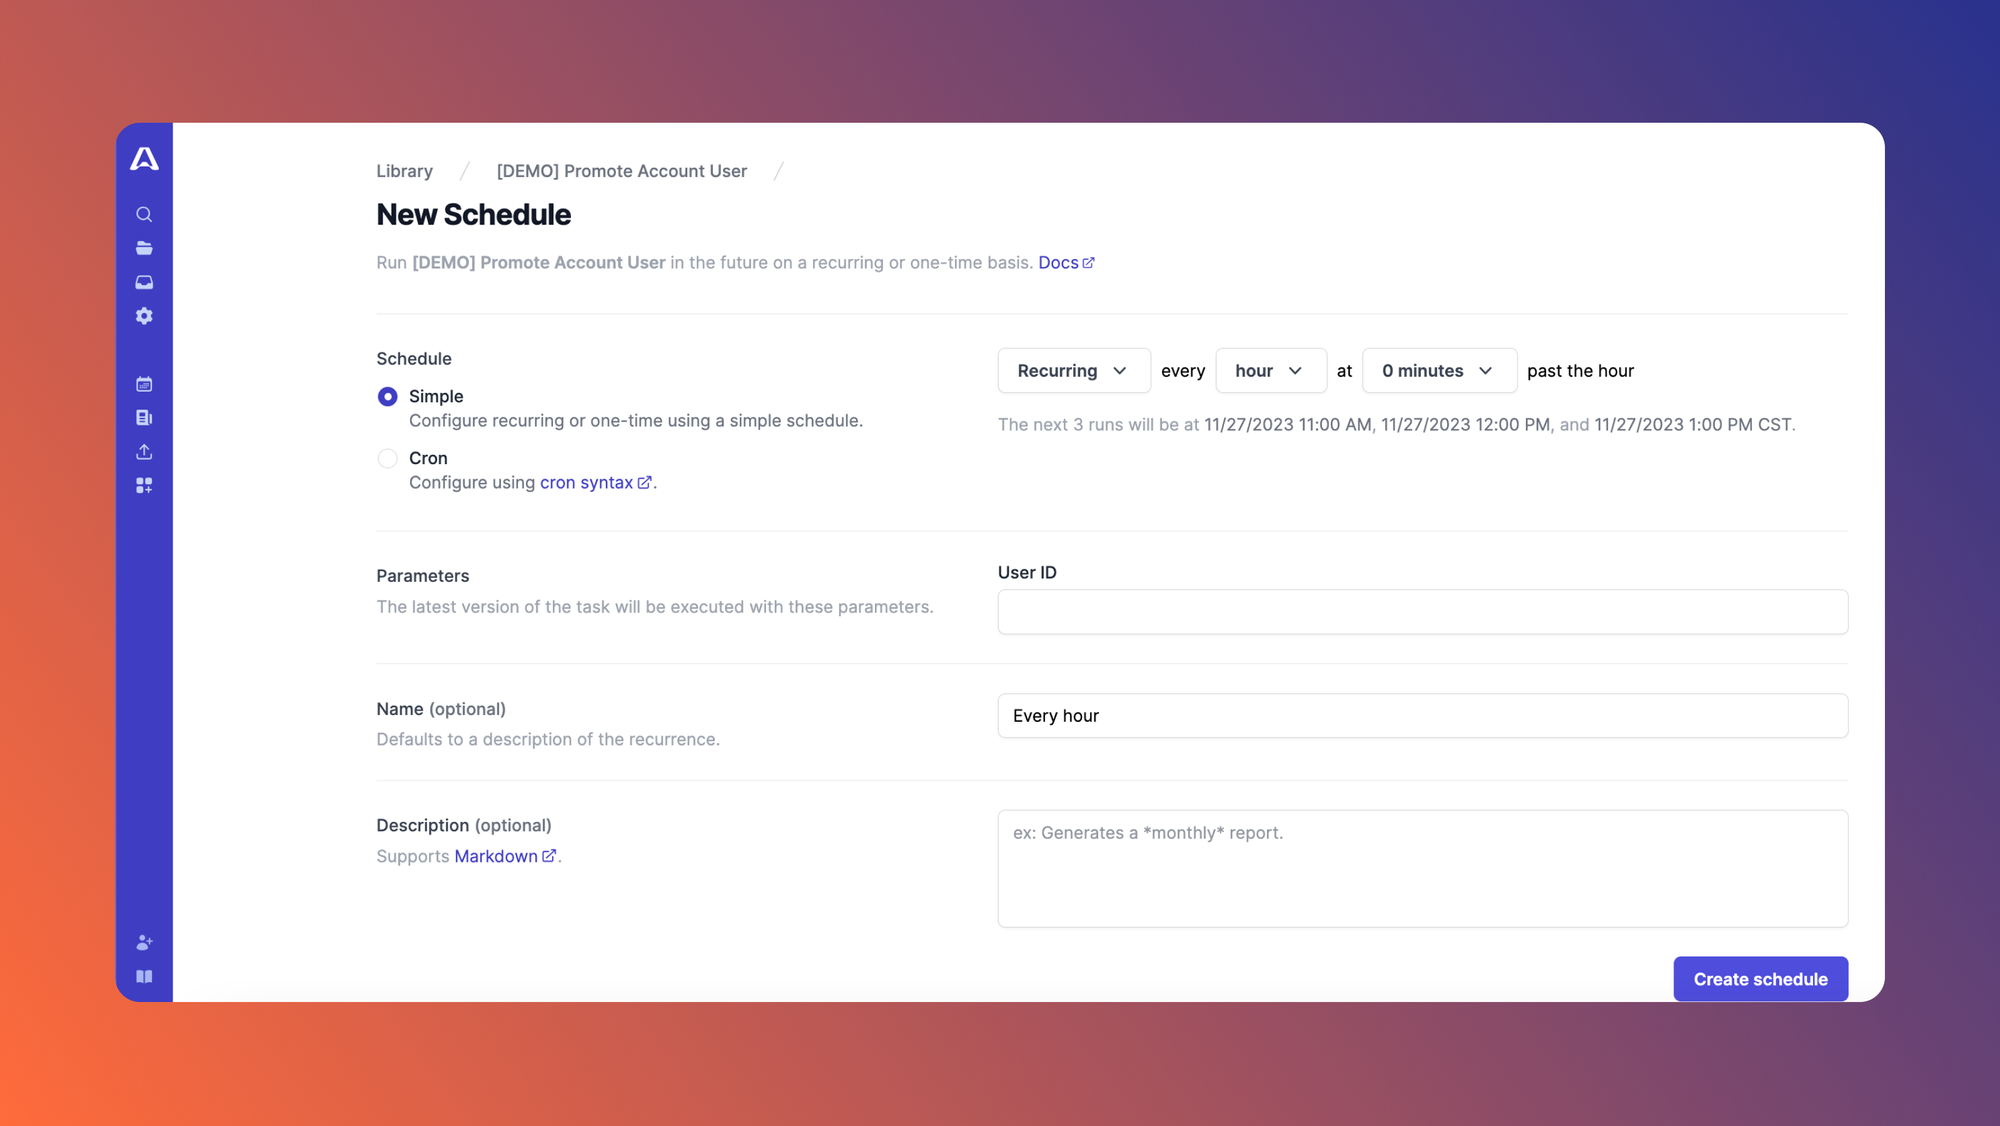
In this tutorial, we walked through how to create a simple KPI dashboard using Airplane. Airplane makes it simple to build and customize robust UIs using Views. In addition to offering Tasks and Views, Airplane provides strong built-in capabilities, such as job scheduling, audit logs, permissions setting, and more.
Airplane also simplifies frontend development by providing a pre-built component library and template library, making it easy to get started.
To try it out and build your first KPI dashboard quickly using Views, sign up for a free account or book a demo.
Author: Veronica Stork
Veronica is a software engineer working primarily in React and JavaScript. When she’s not coding, she enjoys reading sci-fi novels, hanging out with her family, and exploring abandoned buildings.