If your application deals with data at all, there’s likely a point where you’ll need to move beyond basic HTML tables and display more complicated visualizations. While there are many Javascript libraries that can help you bring visuals into your application, one of the most popular is D3. With D3, you can create almost any type of visualization that you can dream up. Combine the power of D3 with React and you have a declarative, straightforward way to create and manage visualizations within your application.
In this article, we’ll take a look at how to create visualizations with D3 inside a React application, how to use real-world data to make these visualizations more useful and look at some examples of extremely complex visualizations from around the web.
Understanding D3 and React
ReactJS is an open-source JavaScript library used for building user interfaces, allowing developers to create dynamic and interactive web applications with reusable components. It efficiently updates and renders components when data changes, resulting in faster and more efficient web applications. It has become one of the best ways to build complex, component-driven web applications and is estimated to be in use on just over 40% of the top 10,000 sites on the web today.
And if you want to build a React application with visualizations, D3.js is a powerful JavaScript library that allows developers to create visuals based on data. It enables the creation of dynamic and interactive data visualizations by binding data to DOM elements and applying data-driven transformations.
By combining these two technologies, you can build a performant web application that uses visualizations effectively.
Setting up your development environment
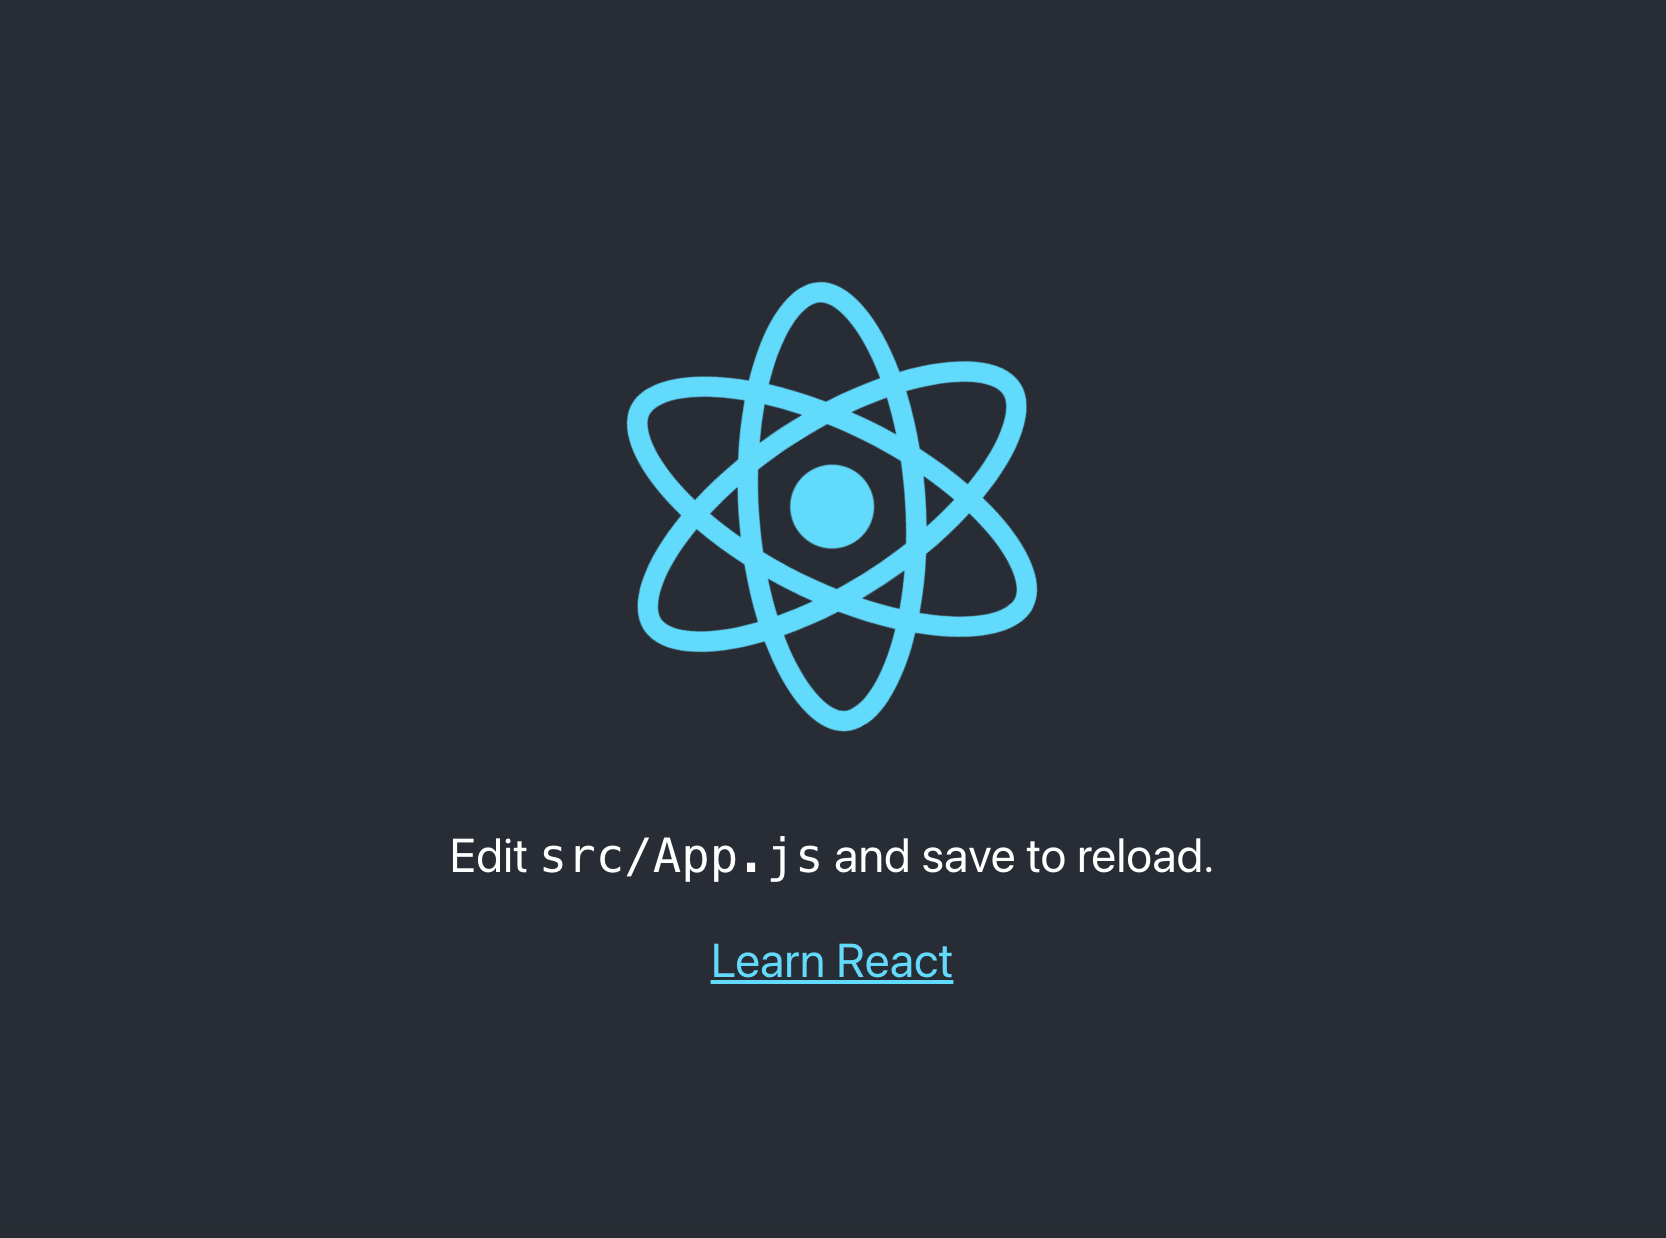
To get started, we’ll use create-react-appto configure our React application. Run create-react-app react-d3to set up React for this project. This will make sure that you have all the build tools and dependencies necessary to build your new project. Once all the installation steps have completed, run cd react-d3 to change into the directory where React has just been set up.
Once you are in your react-d3 directory, run npm install d3 to get D3 installed and set up. Now that you have all your dependencies installed, you can run npm start to start up a locally-running version of your React application.
Creating a simple visualization with D3
In this new codebase, we can simplify our main App.js file into the following:
The BarChart component is where we’ll render our D3 output. Inside the src folder in your codebase, create a file called BarChart.js and fill it with some basic React component code.
We can then fill in this component with the few different pieces required to render a chart.
This sets up the bounds of the chart, giving it dimensions of 600px by 400 px. This is where we’ll drop our data in. For this basic visualization, we’re just using data hardcoded in an array.
This section of code renders the data inside the graph, makes some adjustments for height and adds a bit of color. Adding some clean up code and wrapping the entire thing in a useEffect hook gives you a component that looks something like this.
And when you refresh the page in your browser, you have a rendered bar chart!
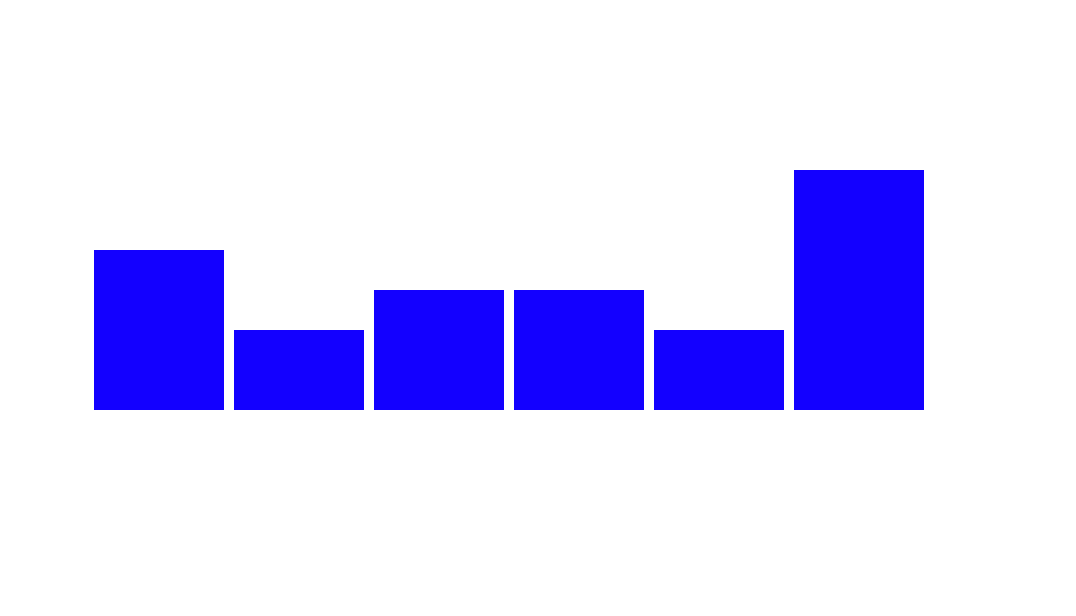
It’s still pretty basic and, especially without labels, not all that useful yet, so let’s take a look at how we can expand this basic visualization to be more useful.
Customizing visualizations with styles
Now that we have our basic chart working, there are a few things we can do to make it more useful and better looking.
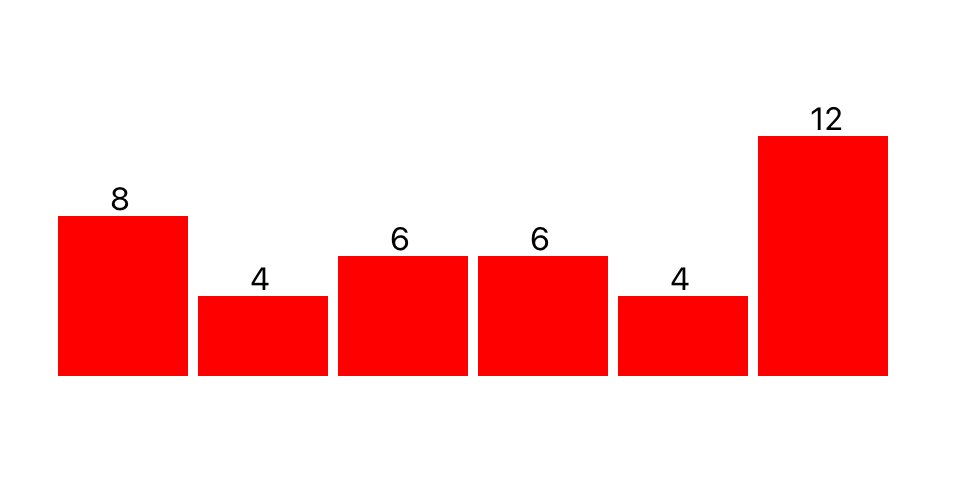
Adding labels
To add labels above the bars with the text value of each of the bars, we can add the following code:
Important to note here is the +26 inside of the attr("x") call. This adjusts the horizontal position so that the labels are centered above the bars. If you would like your labels positioned differently, you can modify this value.
Applying styles in CSS
Currently, we’re directly applying our styles to each of our D3 elements (using .attr("fill", "blue"); for example), however we can also use CSS to apply these same styles. This abstracts our styling code a bit and makes it slightly more maintainable. To do this, we first need to import the CSS file that was created when we created our React application into our BarChart component.
Then, inside that CSS file, we can write the styles for our chart.
And if you refresh your page in the browser, you should see your chart now using this styling.
Real world examples of D3 visualizations
Because D3 is based in Javascript and allows for low-level manipulation of all the SVG elements that make up its visualizations, you can create most anything you can imagine.
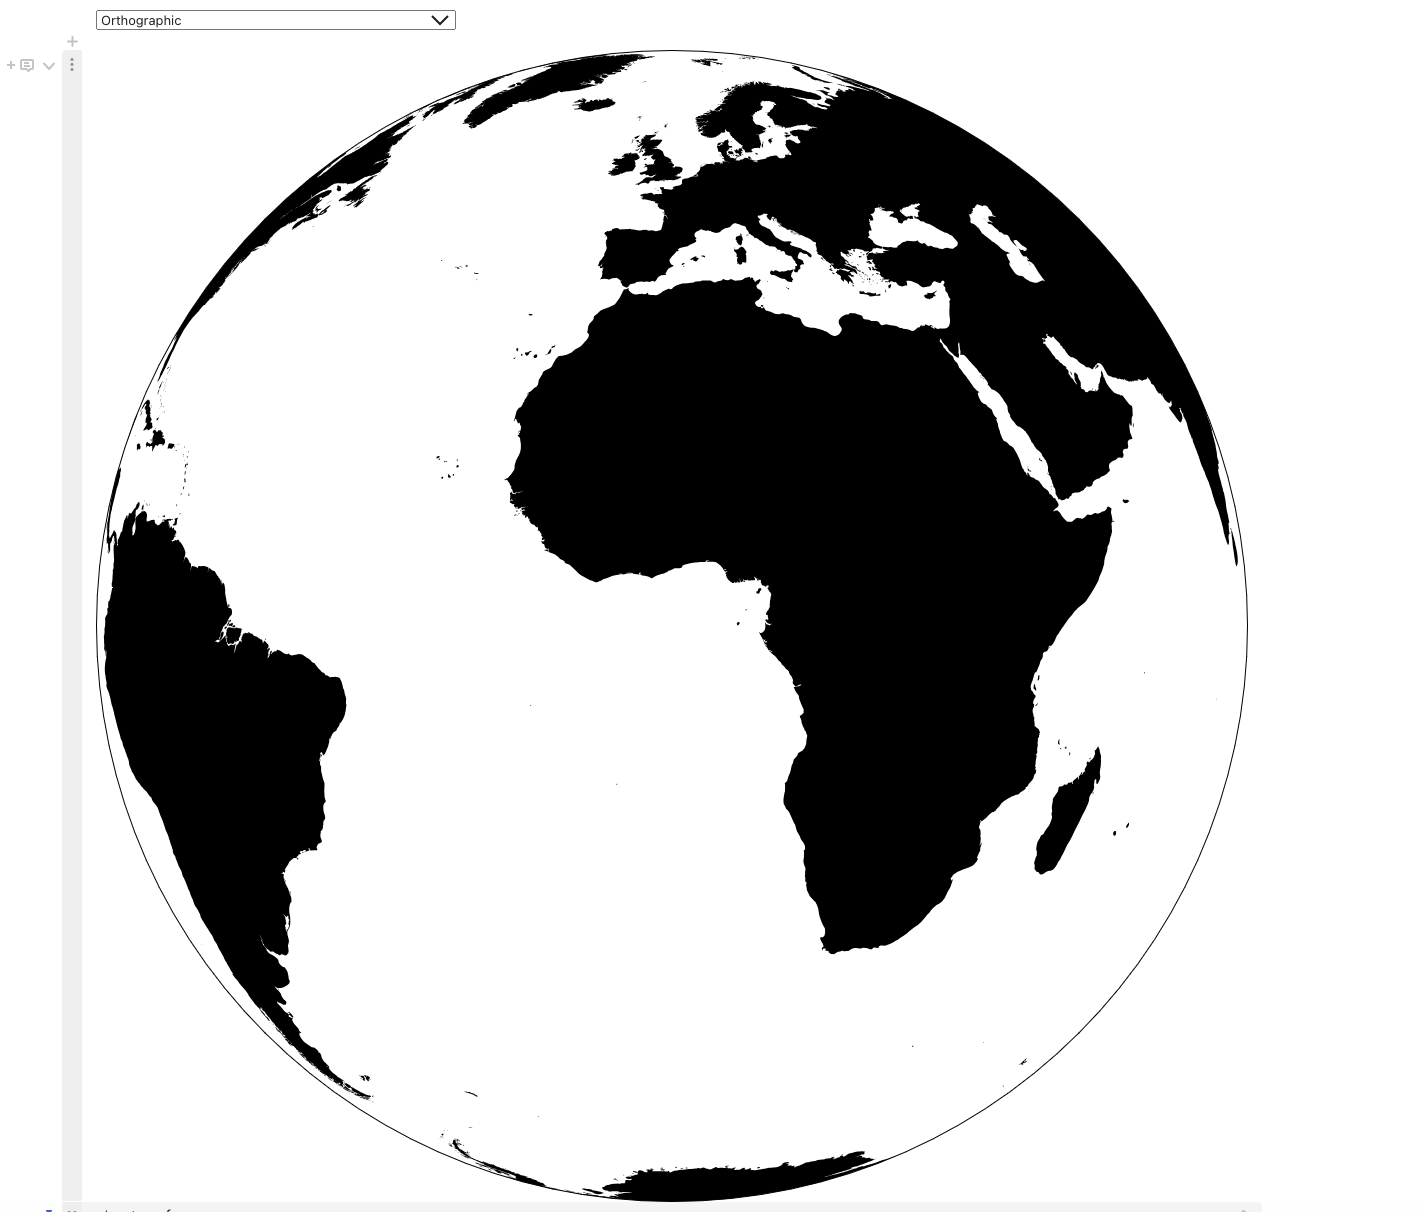
Draggable map of the world
D3 supports interactivity in your visualizations and one example of that is this version of the globe, rendered in D3, that you can actually click and drag to spin.
Using animations
Out of the box, D3 also offers great support for animations, which can be particularly helpful when toggling state inside of a visualization. For example, you can create a smooth transition between stacked and grouped bars that animates between those two states when a different radio button is selected.
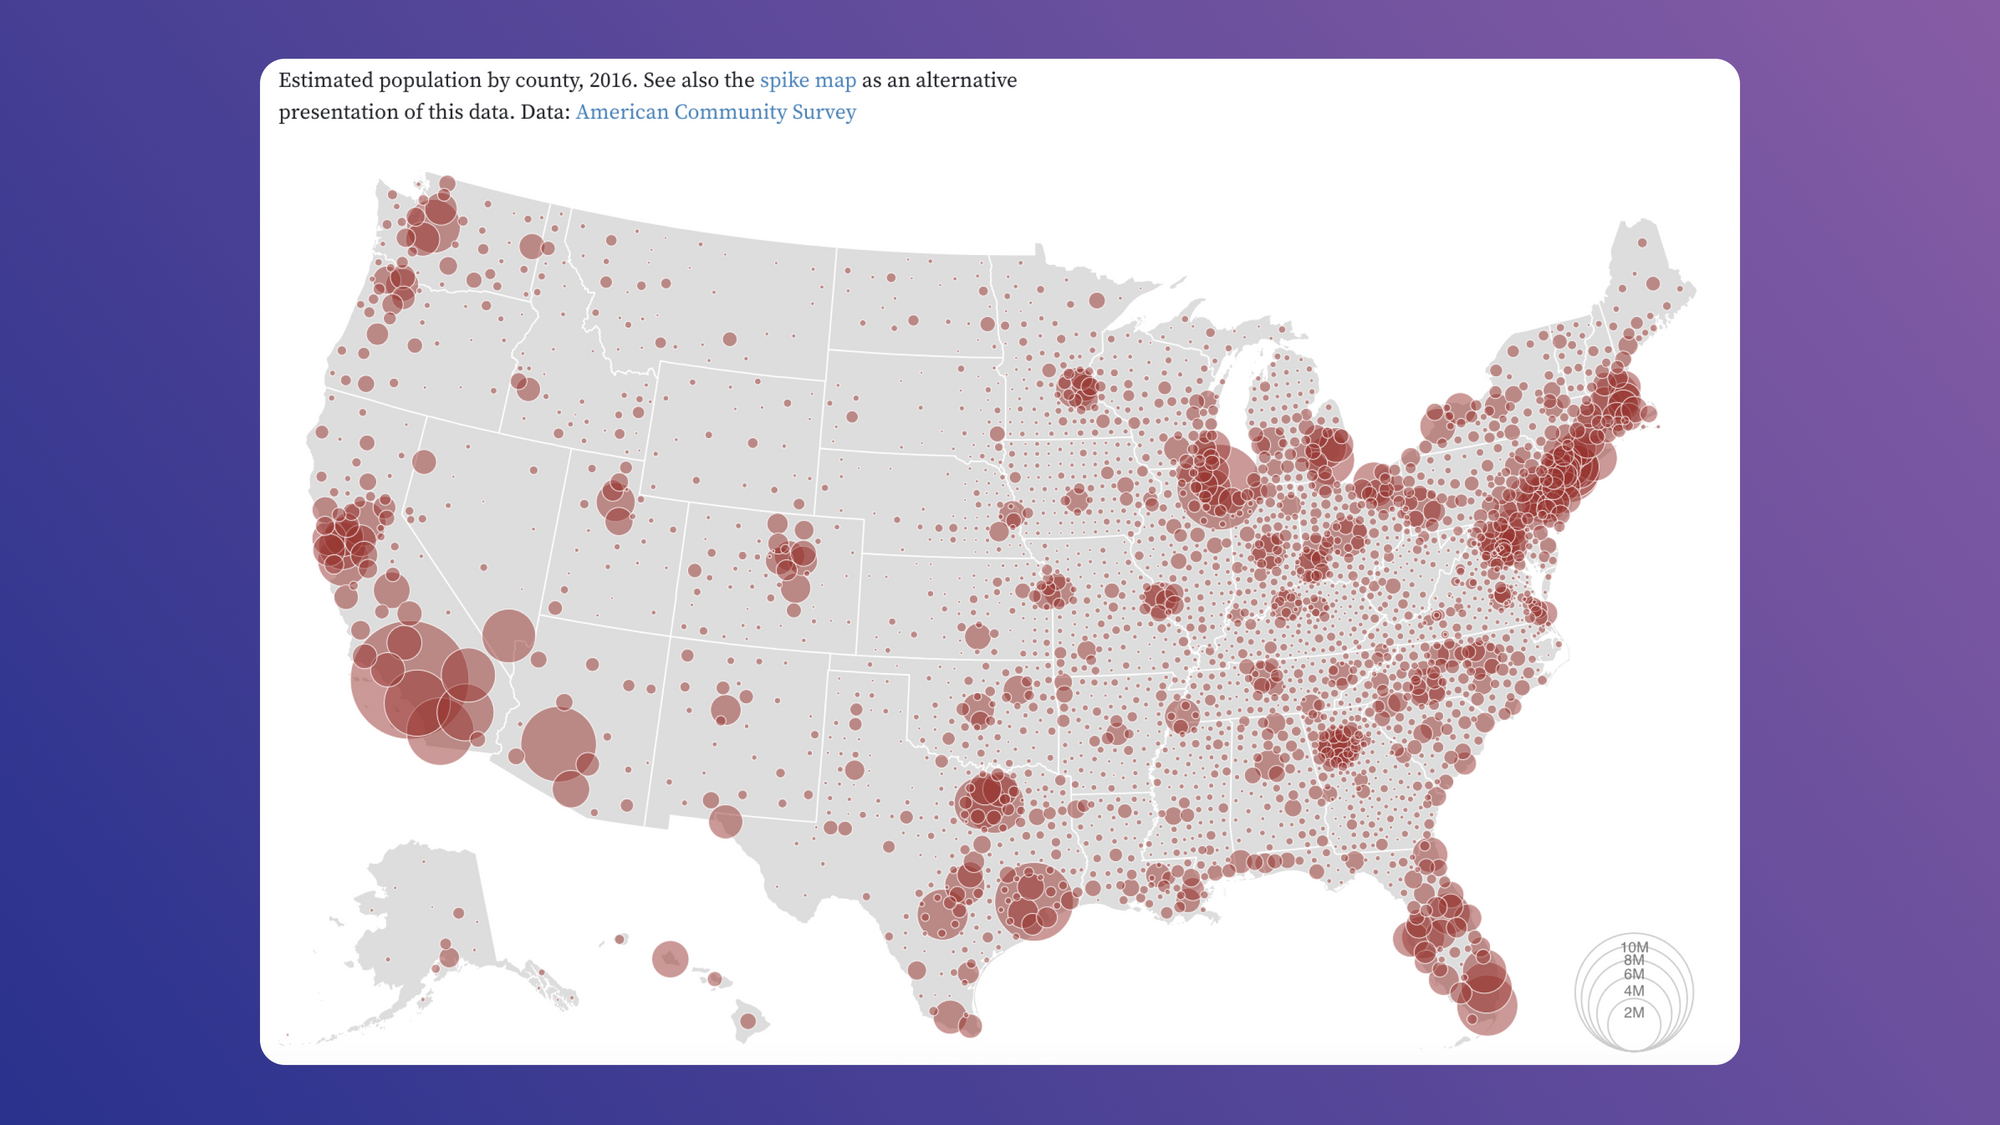
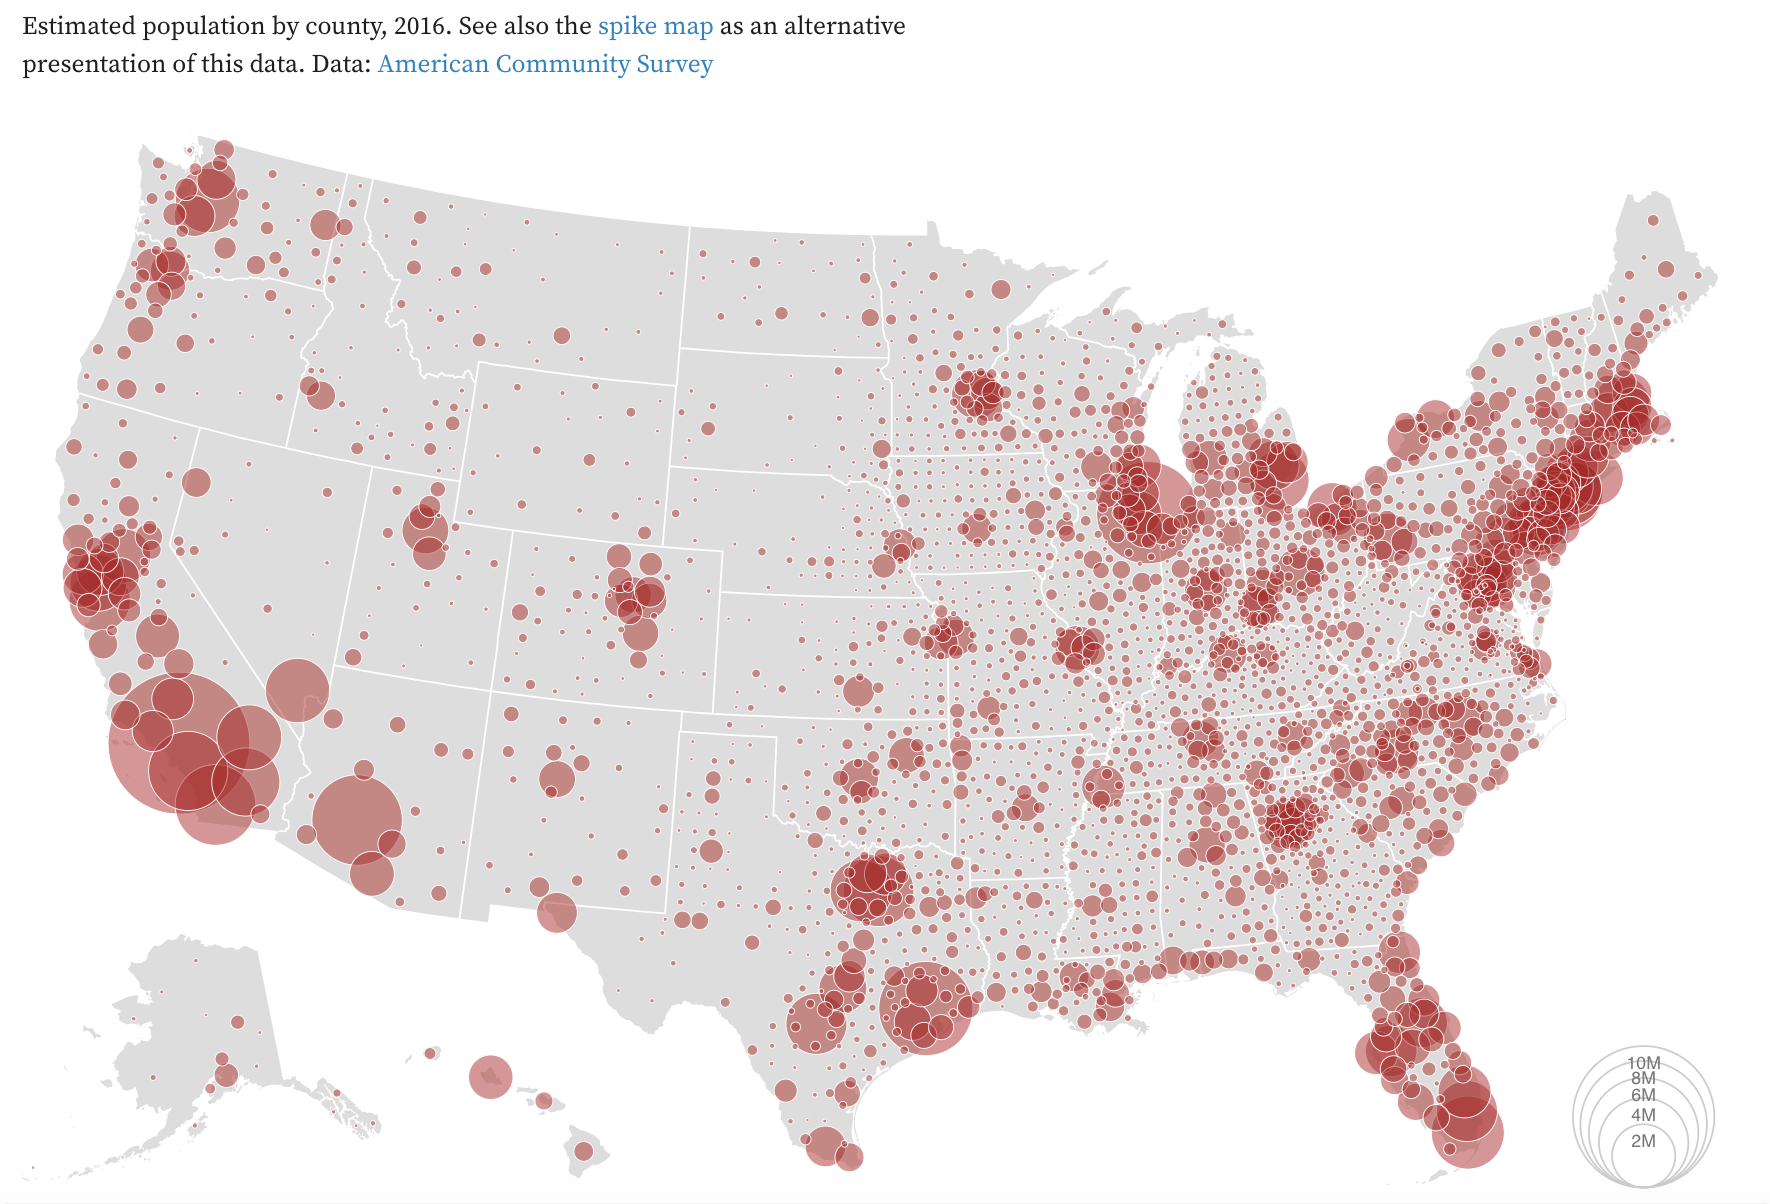
Completely custom visualizations
Since D3 allows you to completely customize every aspect of your visualization, you can create something brand new, like this visualization of population where different sized bubbles represent larger or smaller population clusters.
Using D3 to upgrade your internal tools with Airplane
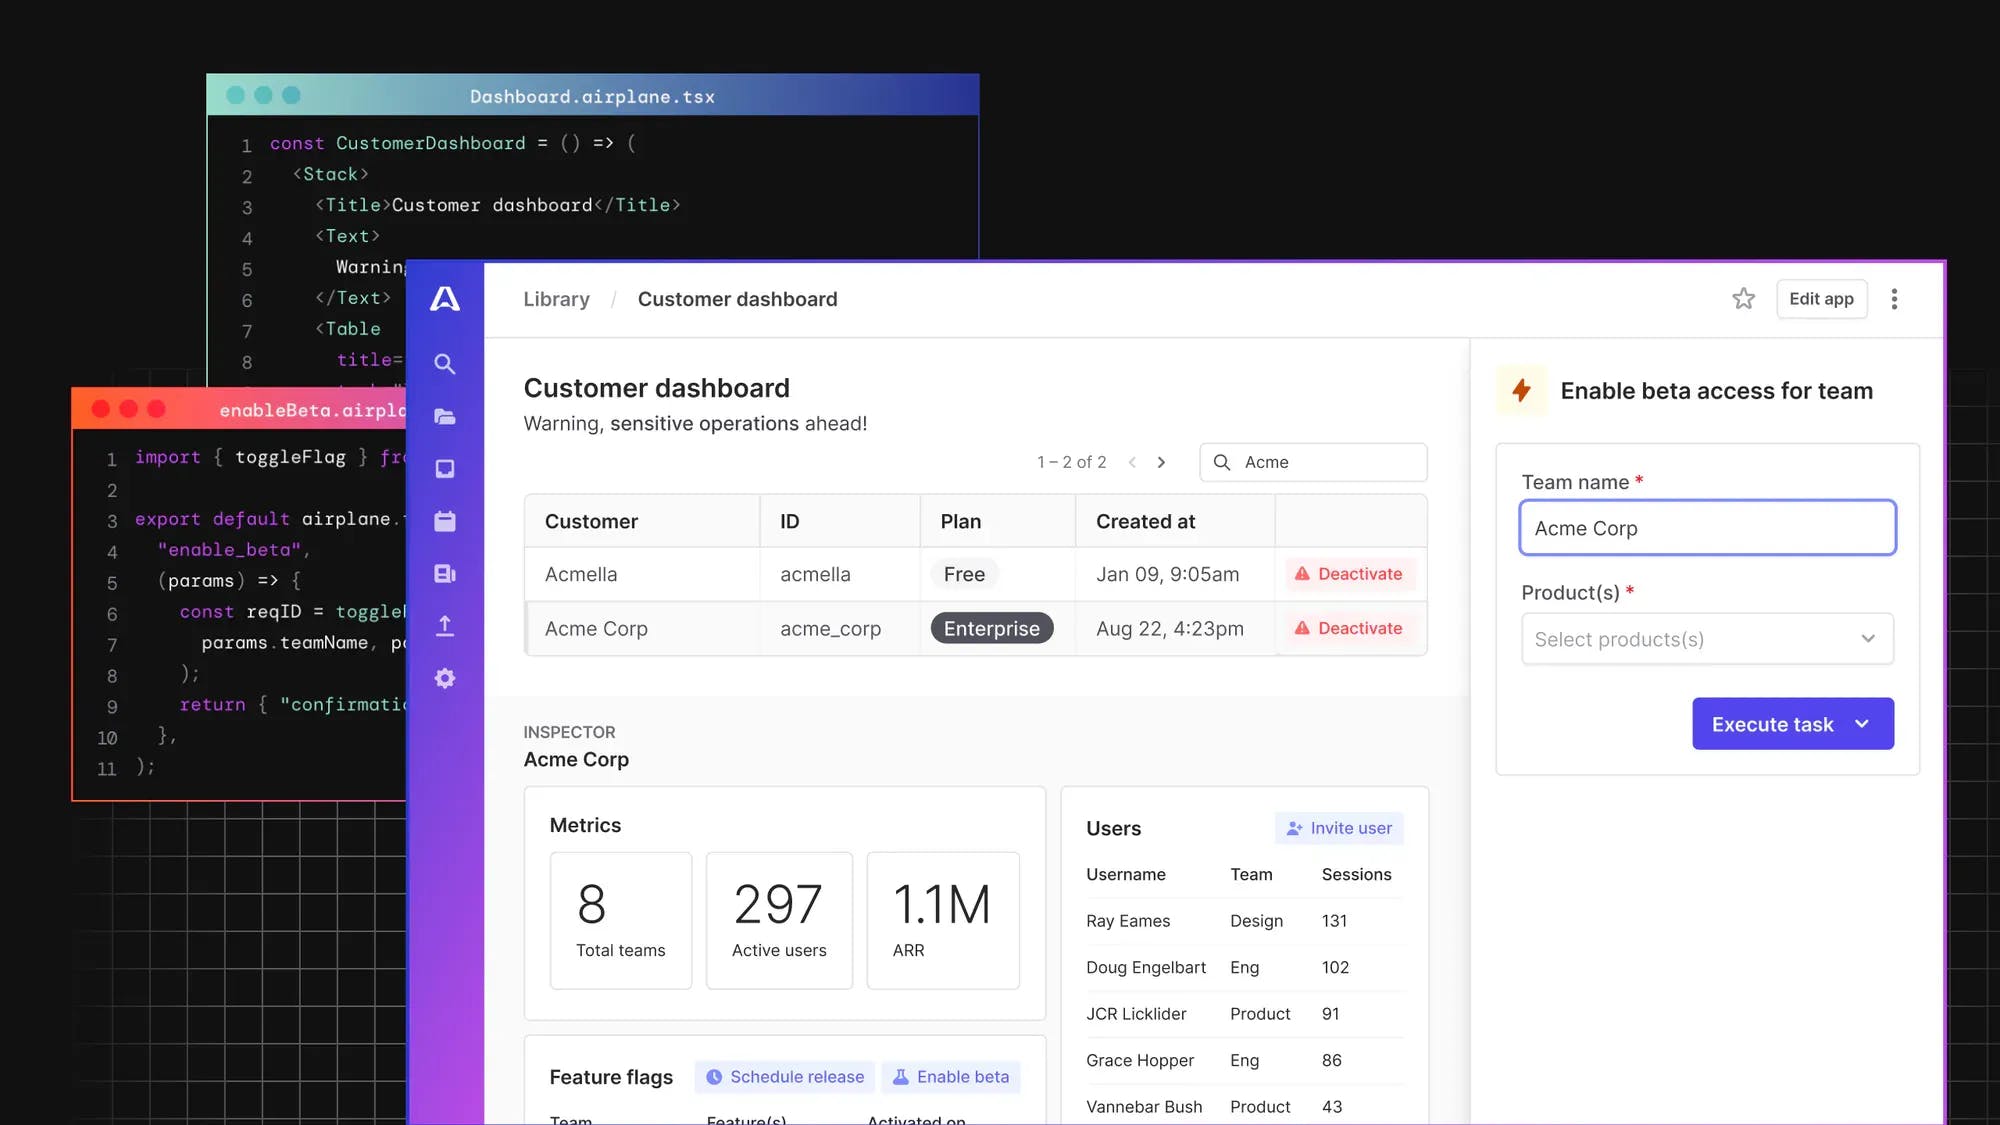
If you’re ready to upgrade your internal tooling with these sorts of visualizations, take a look at Airplane. With Airplane, you can transform scripts, queries, APIs, and more into powerful workflows and UIs.
Airplane Views is a React-based platform that makes it easy for users to build custom UIs quickly. And because Views supports custom components, you can bring the full power of D3 into your internal tooling environment and create any sorts of visualizations you might need.
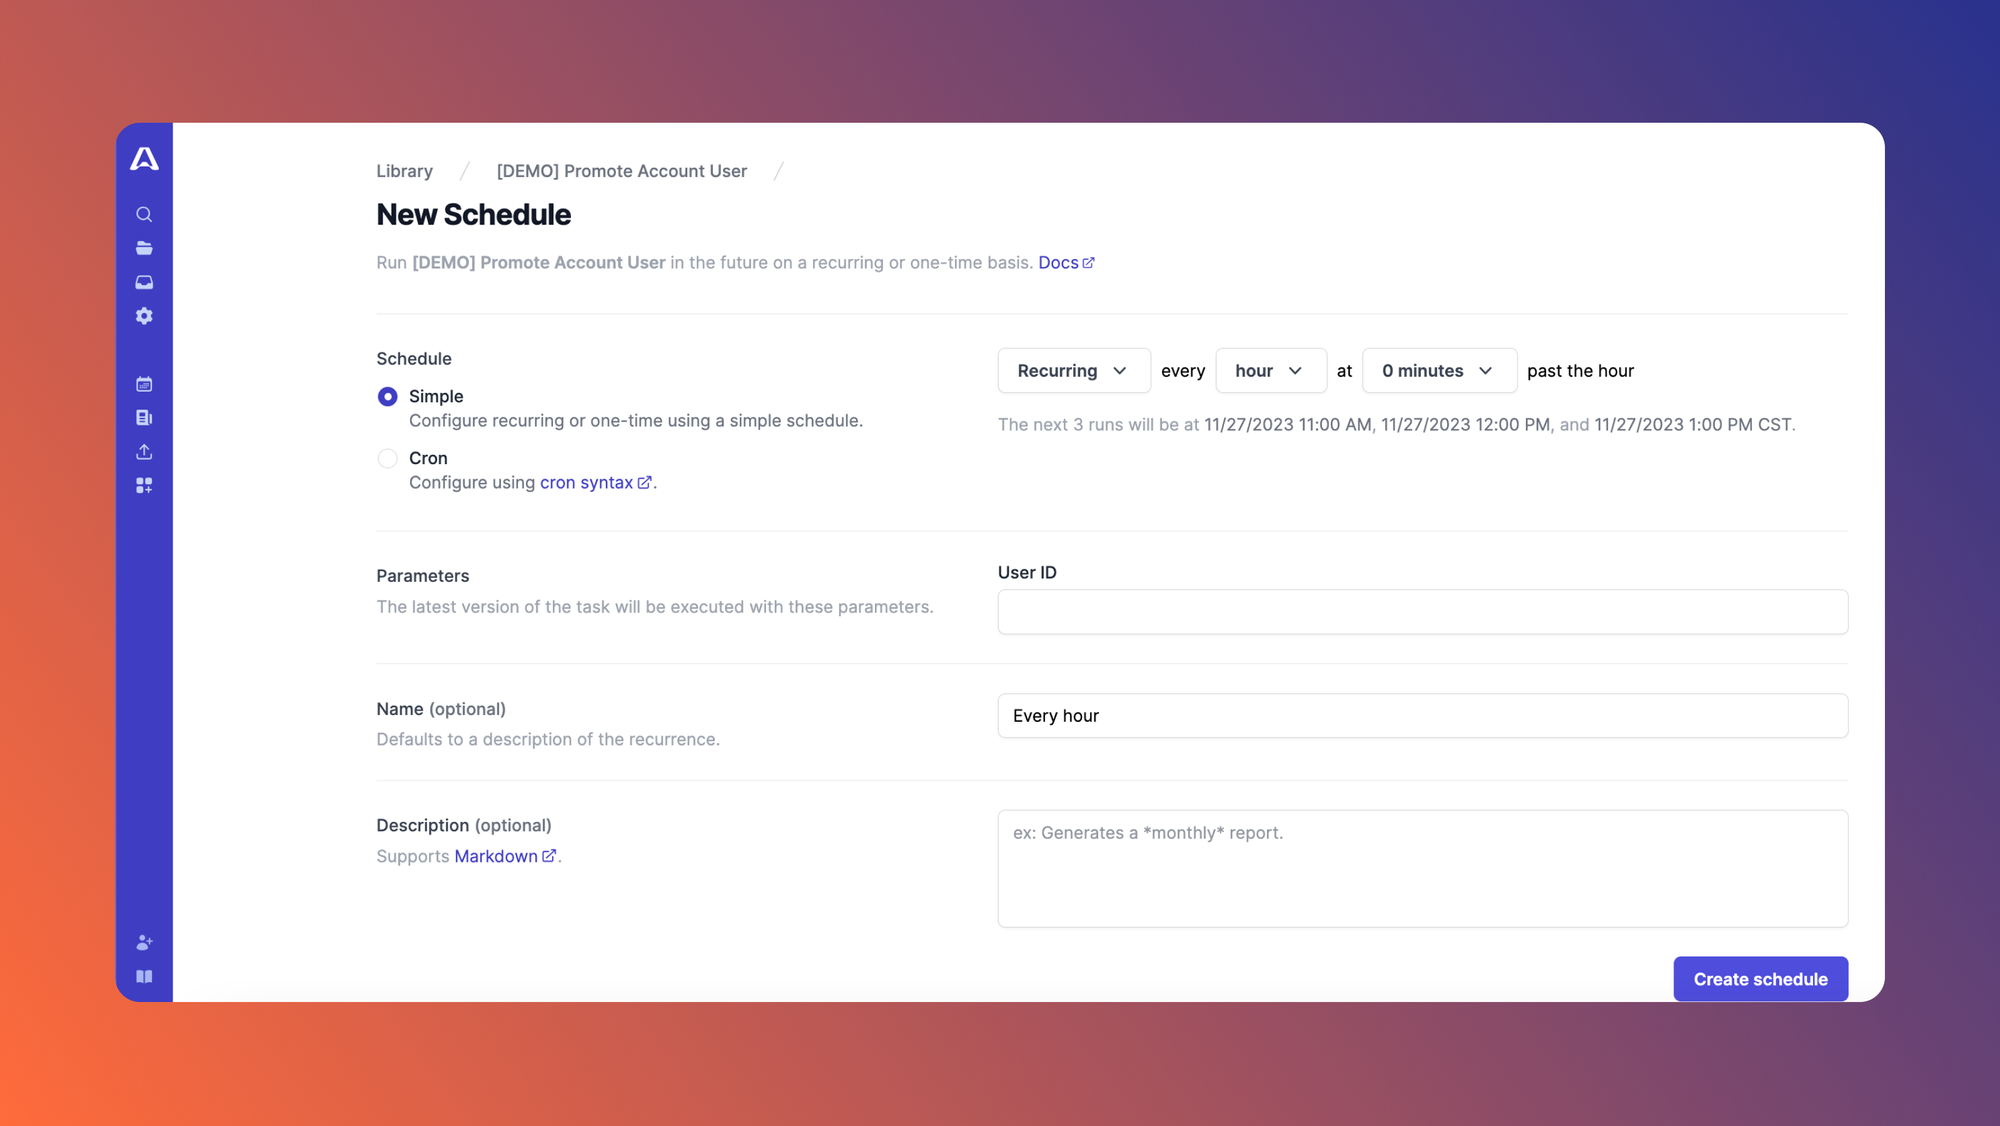
Airplane also provides enterprise-grade features, such as approval flows, audit logs, and notifications, to help you create secure workflows that can be easily shared among your team. To build your first D3-powered tool in minutes, sign up for a free account or book a demo.