If you have experience working with Kubernetes, you’ve likely come across errors like “Failed Scheduling", OOMKilled, pod evictions, and more. And by now you probably know that toggling between multiple tools for metrics, logs, and traces can be inefficient and a waste of time.
Given Kubernetes’ ever-increasing popularity, there are now many options when it comes to cluster monitoring tools. You have self-hosted options like Prometheus and Grafana, and also cloud-based monitoring as a service options like Sysdig and Datadog.
A well planned monitoring stack can help to avoid these issues and ensure cluster health. Monitoring tools like Sysdig and Datadog offer a real-time view of resource usage, logs, traces, and more allowing you to better manage how clusters are run and how applications perform.
This article will compare two popular monitoring options—Sysdig and Datadog. As a result, you’ll understand when to use each tool, and when it might be better to use both.

Goals of monitoring tools
It’s absolutely critical to understand the basic goals of different monitoring tools and how well they fit into your organization’s workflow. So let’s break down the primary goals of Sysdig and Datadog.
Sysdig is a cloud monitoring tool that provides visibility around your Kubernetes infrastructure, applications, and services. This is all aided by the use of various visualizations, cloud integrations, dashboards, and alerts. Sysdig has evolved from solely being a troubleshooting platform into a complete infrastructure monitoring solution.
Datadog is described as a way to “unify logs, metrics, and traces from across your distributed infrastructure.” It’s also a leading cloud-scale monitoring solution used by development teams for distributed systems that run on dynamic or hybrid cloud infrastructure.
Managed vs. unmanaged
Sysdig is an open-source monitoring solution. Even though Sysdig offers an unmanaged monitoring option, its end goal is to get users on its cloud solution platform. But what’s the difference between solutions?
A key advantage of Sysdig’s managed solution is support—there’s a support channel for everything, from setup to maintenance. That said, the amount of maintenance support you’ll require for the managed solution is minimal or zero.
Datadog is fully managed—there is no unmanaged option. You pay a set amount based on usage, and they take care of everything for you. You just need to configure the tool and you’re ready to go. Like Sysdig’s managed solution, support channels exist if needed.
Tool setup
Setting up Sysdig and Datadog is simple if you’re familiar with Helm. There’s a Helm chart available to install Sysdig, as well as for Datadog.
All you have to do is configure everything in a values.yaml file, and then run helm install on configuring a DaemonSet with their agent.
Datadog also provides documentation on setting up their cluster agent using DaemonSet.
If you get lost configuring these cluster agents, tool support can help you troubleshoot.
Feature comparison
In order to determine what Kubernetes monitoring tool is best for you, let’s take a look at how Sysdig and Datadog compare when it comes to important features.
Metric collection
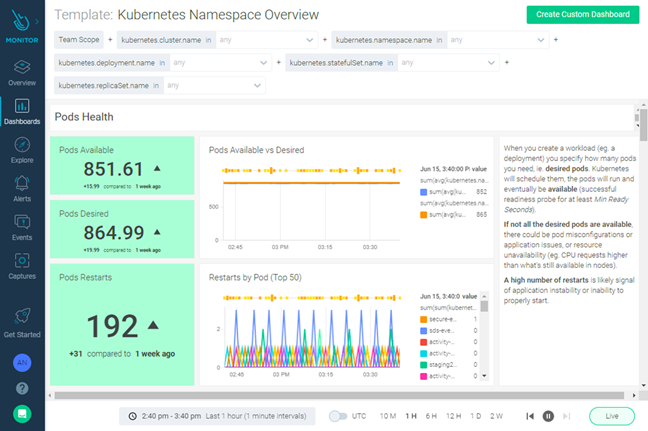
Once you’ve installed Sysdig’s agent on your cluster, you’ll have access to tons of different monitoring metrics. Apart from having access to default Kubernetes metrics like how many pods are running, nodes status, deployment status, CPU, and memory usage, you can directly view them from the web dashboard.

Upon cluster agent installation, metrics are shipped from your cluster to Datadog HQ (similar to Sysdig). Datadog also allows you to view metrics and cluster stats from web UI, create interactive dashboards, and set alerts.
While Datadog allows you to track a huge list of metrics by default, you can also define your own custom metrics to track for a small additional cost.

Event monitoring
Events are constantly created by any Kubernetes cluster. Unlike metrics monitoring, event monitoring unlocks granular insights into the cluster like “FailedScheduling” (where pods could not be scheduled) or “NodeNotReady” (where a node isn’t ready for deployment).
Sysdig requires no specific configuration to monitor events. They are automatically collected by the cluster agent—and made available for monitoring in the web UI directly. Custom alerts can also be configured based on these event triggers.
Like Sysdig, events are available in the Datadog web dashboard almost immediately after cluster agent installation. Interactive and personal dashboards can be created using events data. Similar to Sysdig, you can create alerts using the event trigger inside the dashboard.
Visualization
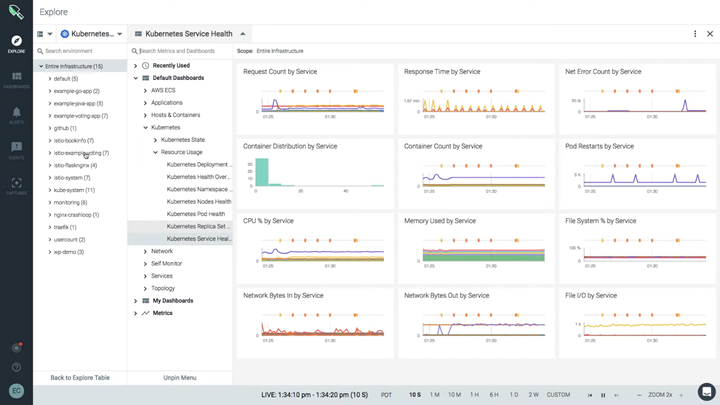
With Sysdig, dashboards don’t have to be set up from scratch—they’re instantly available out of the box. After cluster agent installation, you’ll have access to a massive number of pre-built dashboards on web UI.
These dashboards are very adjustable, allowing you to add or remove multiple metrics and events, set alerts, etc. Pre Built dashboards make it easy to start data analysis, rather than wasting time setting up the entire dashboard from scratch, finding the events you want to track, and so on.

As mentioned, Datadog provides prebuilt dashboards with an overview of deployments, nodes, and pod resources that can be customized if desired. Datadog also integrates with the cluster and gives you access to live container view and container map out of the box; this makes monitoring real-time performance quicker and easier.
When it comes to performance monitoring, Datadog is superior to Sysdig.

Alerting
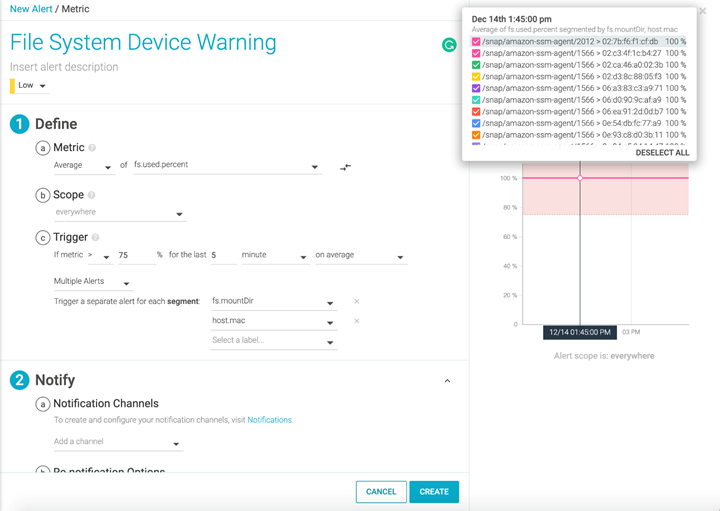
In Sysdig’s web UI, you have an option to create actionable, symptom-based alerts. Alerts might involve your host being down, deployments going offline, your API server going down, or that cluster resources are at maximum capacity and need scaling up. To learn more about alerts and how to use them, check out this article.

Datadog also comes with alerts by default in the web UI, also known as DatadogHQ. Here you can create multiple alerts using the metrics or events available as triggers. Advance alerts like anomaly alerts and dynamic alerts are also available. To read more about using alerts with Datadog, follow (this article).

Conclusion
After reading this article, you should now have a clear idea understanding of the similarities between Sysdig and Datadog. Sysdig has an open-source version available, and you can simply pay for support and additional features. Sysdig’s base plan is around $20 monthly per host.
As for Datadog, there’s a free tier option with limited support and features available, after which you can upgrade your plan depending on your needs. Datadog’s base plan is around $18 monthly per host.
Datadog is more popular than Sysdig since it has more integration options and support for multiple stacks. Datadog is more inclined toward the performance monitoring category of tech stacks. While Datadog offers cloud-scale monitoring, Sysdig tends to be a container monitoring solution for all Linux container technologies, including LCX, Docker, and Kubernetes.
Beyond monitoring, Datadog provides more features like web traffic and uptime reports, which are not available in Sysdig by default.
If you're looking for a platform that is even easier to use and build a monitoring dashboard for your Kubernetes clusters, then consider using Airplane. Airplane is the developer platform for building custom internal tools. With Airplane, you can transform scripts, queries, APIs, and more into powerful workflows and UIs. Using Airplane Views, you can build a monitoring dashboard using an extensive pre-built component library and template library, making it easy to get started.
To build your first dashboard within minutes, sign up for a free account or book a demo.


