There are many things to consider when creating and running a Kubernetes cluster. You have to set up the cluster itself, ensure permissions are set correctly, and much more. Once everything is working, there’s an important decision to make: What monitoring system will aid you best in making sure that your cluster continues working optimally?
Two popular choices for this purpose are Sysdig and Prometheus. Prometheus has become the de-facto standard for Kubernetes monitoring. While not as popular as Prometheus, Sysdig is a strong contender and loved by many in the monitoring space. Here we’ll be comparing Prometheus to Sysdig Monitor, which is their tool more aimed at Kubernetes.

Sysdig vs. Prometheus - what are their goals?
Whenever you are picking a tool meant to integrate into your workflow, it’s important to look at the goals of a given tool. Do they align with what you want to do? When you understand the underlying philosophy of a tool, it’s easier to get a feeling of how it would fit into your systems.
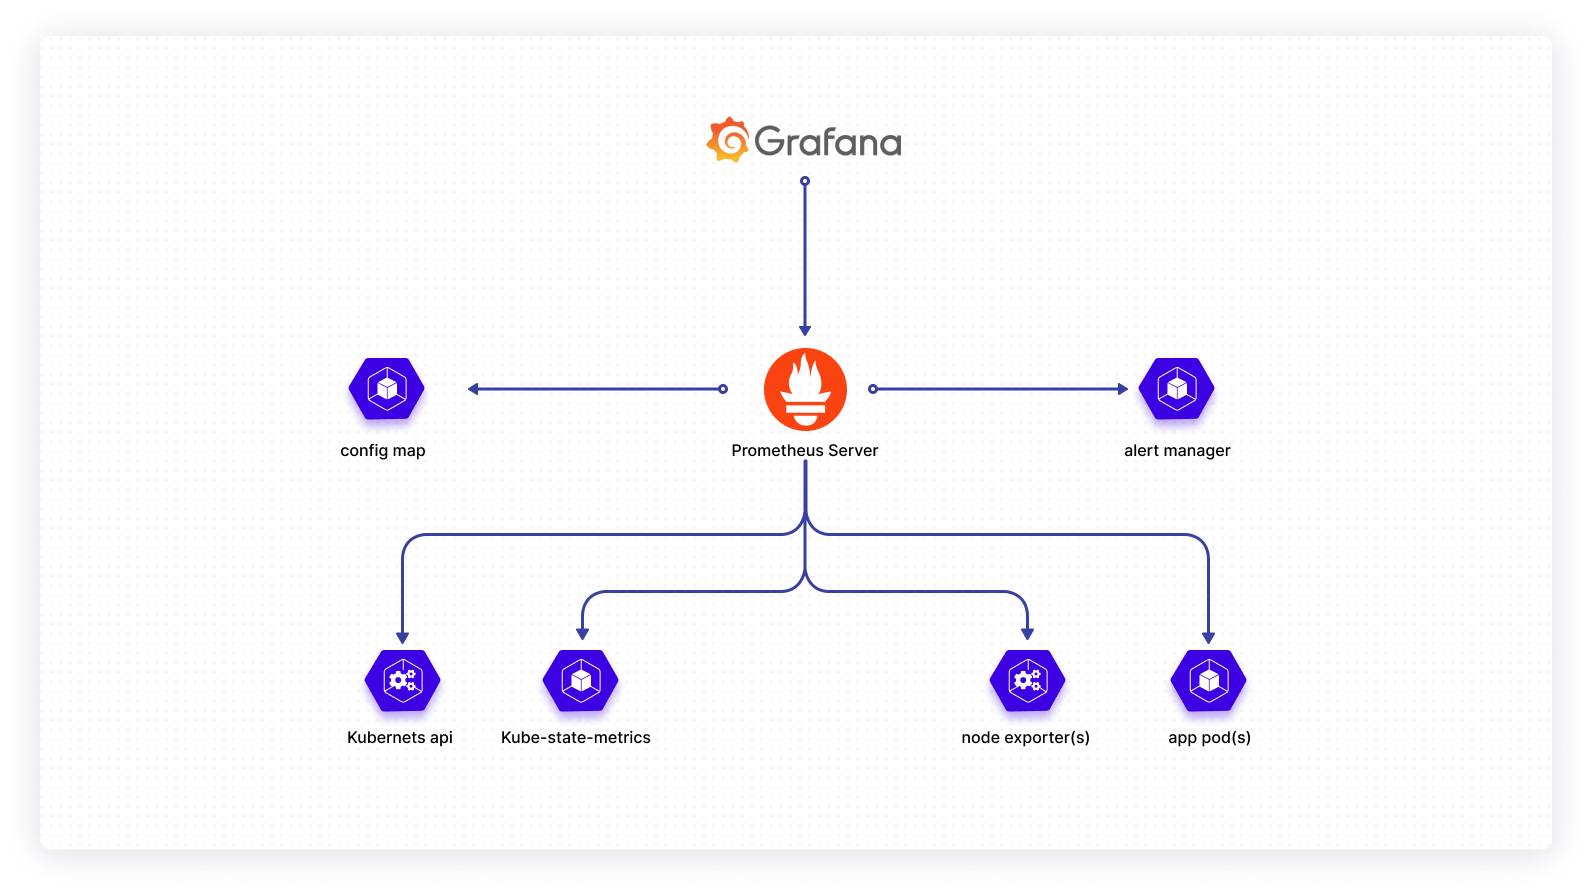
Prometheus has a simple goal. They want to be the greatest time-series database, which is what the tool does at its core. Then you have tools like Grafana, Alertmanager, etc., which helps turn Prometheus into more of a full-fledged solution. Also, they are also deeply integrated into the open-source community. Not only is the tool itself open-source, but most of the tools built around it are, too.
Sysdig is a more diverse and complex system. It offers you a ton of different possibilities. Initially, it was meant to be a troubleshooting platform—something that users could use to figure out what went wrong in their applications. Over time it has evolved and is now a complete monitoring suite.
Like Prometheus, Sysdig started as purely an open-source platform, and still is to this day. The big difference is that, unlike Prometheus, Sysdig has built upon their tool and created their own managed offering, whereas Prometheus can only be self-hosted or managed by third parties. It’s fair to say that where Sysdig aims to be a jack of all trades, Prometheus wants to be a master of one. This has advantages and disadvantages, which will be covered more in this article.
Setting up the tools
If you are already using Helm in your toolchain, or you’re looking to get it integrated, both of these tools are fairly easy to set up. Sysdig has a Helm Chart available, as does Prometheus. If you’re not familiar with Helm, this means you can configure everything in a values.yaml file, and then install the tools in your cluster with a single command.
If you’re not a fan of Helm, or for other reasons don’t want to use it, it’s still possible to get the tool running in your cluster. Prometheus doesn’t offer any official documentation on how to do this, but there are plenty of community-written articles detailing the setup. Sysdig, on the other hand, provides official documentation, detailing how you configure a DaemonSet with their agent.
What are the differences?
Setup is of course not the only area where these tools differ. Let’s take a deeper dive into what sets these tools apart.
Managed vs. unmanaged
In many cases, this difference will be the deciding factor. Prometheus is an unmanaged service. This means that while there’s (typically) a company developing the tool, in the end you’re the one responsible for setting it up, configuring it, and maintaining it. In many cases, as with Prometheus, there’s a big community around the tool that’s ready to help you, but you do still have to be aware that there is no official support channel. The big advantage to Prometheus is that it is free.
While Sysdig does offer an unmanaged solution, they clearly want you to get on the cloud solution. This makes sense since they then get paid directly for a service. But what are the advantages for the user? The main advantage is the amount of support you’re getting. Whether it be when you’re setting up the tool, configuring it, or maintaining it, there’s a support channel you can go to and get help. Of course, a managed solution is limited on how much maintenance you’ll have to do.
Feature set
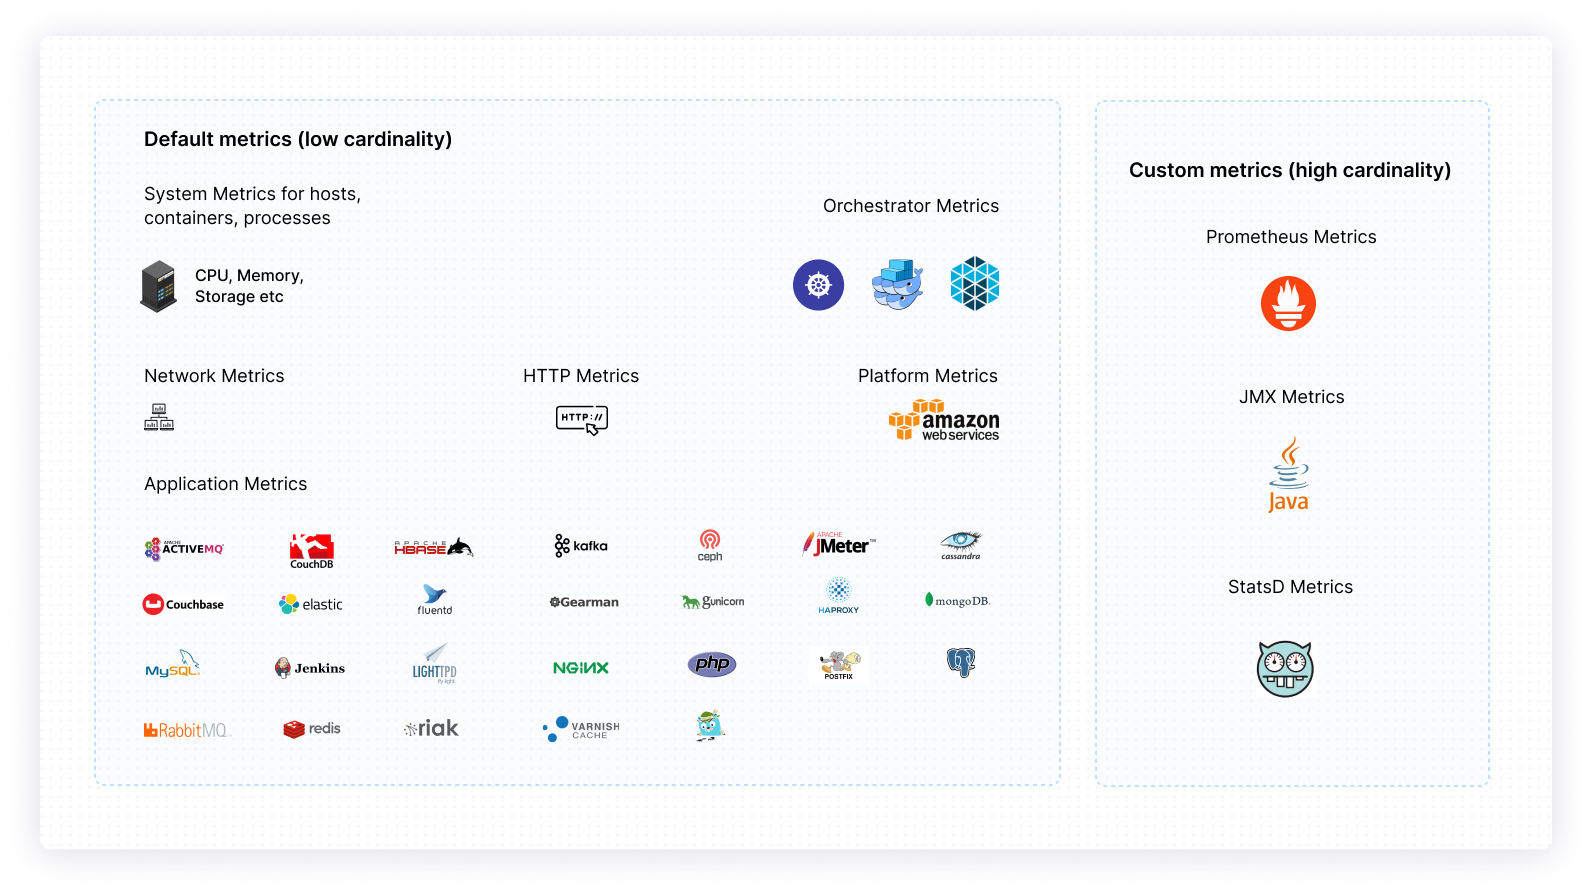
If you haven’t made your decision based on whether you want a managed or unmanaged solution, then your decision will most likely be based on the feature set. As hinted to earlier, the number of features you get out of the box are quite different. With pure Prometheus you are getting a system that can collect metrics and do some rudimentary alerting and visualization.
With Sysdig you are getting more or less a full package. They provide you with everything from metric collection to event monitoring to alerting. The chances of needing a third-party tool on top of Sysdig are slim.
Feature comparison
Now you know what the major differences are. With one of them being the feature set, let’s have a closer look at some of the major features and how they compare.
Metric collection

By default Prometheus doesn’t collect any metrics. You have to configure it and tell it what metrics you want to be collected. In Kubernetes, this is done through a ConfigMap. Once you’ve got it configured, Prometheus will start scraping the metrics you’ve defined. These metrics can then be viewed using the integrated /graph endpoint. The more popular solution is using a tool like Grafana to display your metrics.

With Sysdig Monitor you are getting a ton of metrics collected as soon as you set it up. Sysdig collects all default metrics from Kubernetes, like how many pods are running, what’s the state of your deployments, and how many nodes are there. These metrics can then be viewed in the dashboards they provide you with.
Event monitoring
One thing that Prometheus lacks any kind of support of is the possibility of collecting events from Kubernetes. Events in Kubernetes can be used for a ton of things, like knowing when a Kubernetes job has finished or whether a pod is stuck in CrashLoopBackOff. With the way that Prometheus is set up, it’s incredibly expandable. This means that you can be sure to find a third-party tool that can be integrated into your systems, making it possible to monitor events with Prometheus. Be aware though, that it is something you’ll have to configure yourself.
As with metrics, Sysdig automatically starts collecting Kubernetes events. They are then shown in the WebUI and can be monitored from there. The tool even has built-in functionality for creating alerts based on these events.
Visualization

If you want visualization when using Prometheus, you will want to use a third-party tool. The most popular one is undoubtedly Grafana. By default, Prometheus does come with a /graph endpoint, but that view is rudimentary compared to what you’re getting with Grafana.

When using Sysdig Monitor you’re getting dashboards out of the box. A lot of dashboards come prebuilt into the WebUI, but you also have the capability of creating your own custom dashboards. This way you spend less time configuring and fine-tuning your dashboards, and more time dissecting the data that you are given.
Alerting

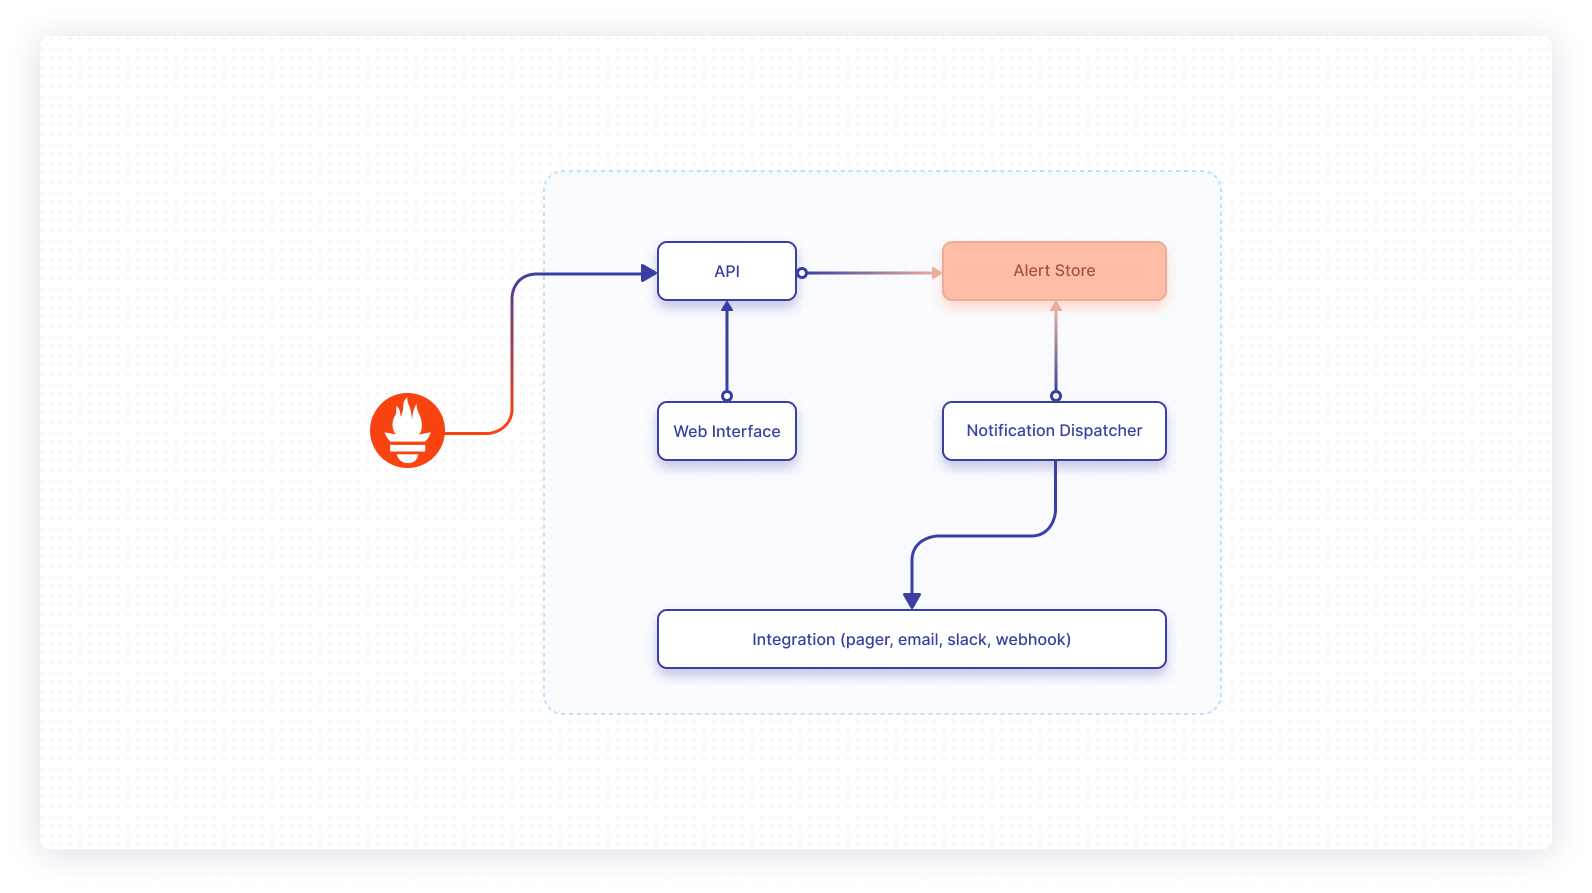
For many there is only one reason for setting up a monitoring system in the first place. You want to be notified when something goes wrong. By now you’ve probably caught on to the trend that this feature is enabled by a third-party tool in Prometheus—Alertmanager in this case.
Alertmanager is developed and maintained by the same team behind Prometheus, but their decision to make it a separate component needing to be activated again cements the goal that Prometheus wants to be a great time-series database.

With Sysdig Monitor you are getting alerting functionality out of the box. You can configure many different types of alerts, ranging from the standard threshold alert to anomaly detection and event alerting. All this is done from inside the WebUI.
Conclusion
Picking the right monitoring tool can be a challenge, but hopefully this article has provided you with more insight into what Sysdig Monitor and Prometheus can provide. Prometheus is great if you have the time and resources to manage everything yourself. It’s a completely open-source system that allows great expandability and is the de-facto standard for Kubernetes monitoring.
Sysdig is great if you want to flip the management burden over to someone else. If you are a growing company or for other reasons don’t have the resources to manage a monitoring system yourself, Sysdig provides you with a great suite of tools that should get you up and running quickly. As a bonus, you may also want to compare Datadog to Prometheus, which like Sysdig, provides a broader suite of tooling. Now it’s up to you to figure out what tool best aligns with your vision and your needs.
If you're looking for a maintenance-free platform that makes it even easier to build monitoring workflows and dashboards, then consider using Airplane. With Airplane, you can build custom internal tools using scripts, queries, APIs, and more. Everything you build in Airplane can be version-controlled, extended using third-party libraries, and integrated into the rest of your codebase.
Getting started is easy: sign up for a free account or book a demo and start building powerful internal tools within minutes.


