


OpenTelemetry is more than just a new way to visualize data across your applications. The open-source project, currently available in beta, aims to change the way engineers use instrumentation without requiring a change in monitoring tools.
You can use OpenTelemetry to collect telemetry data from all your applications and services, then standardize that data before sending it to your backend.
This article will show you how to get started using OpenTelemetry in Java. You’ll also learn how to use OpenTelemetry to monitor a sample Spring Boot application.
What are telemetry and telemetry data?
Telemetry is derived from two Greek words: tele meaning “remote” and metron meaning “measure”.
According to Techopedia, “Telemetry, in general, is a term for technologies that accommodate collecting information in the form of measurements or statistical data, and forward it to IT systems in a remote location.”
Today’s software environments are highly complex and often distributed—in containers, in a cloud environment, or across multiple servers. The more widely spread architecture can make monitoring performance and fixing bugs or other issues increasingly tedious and challenging. Here is where observability comes in.
Observability measures how well you can monitor a system based on its outputs. You can implement observability using metrics, events, logs, and tracing, or MELT. The data generated from these sources is telemetry data.
What is OpenTelemetry?
OpenTelemetry is a collection of tools and features designed to measure software performance, offering a unified standard for service observability and instrumentation. It’s an amalgamation of two open-source traceability software called OpenTracing and OpenCensus.
The Cloud Native Computing Foundation (CNCF) developed OpenTracing to provide a vendor-agnostic, standardized API for tracing. OpenCensus was the internal traceability platform for Google that later evolved into an open-source standard.
OpenTelemetry, a CNCF incubating project, combines the strengths of both these standards to form a unified traceability standard that’s both vendor- and platform-agnostic. It’s now available for use across various platforms and environments, with even wider availability expected soon, according to its website.
OpenTelemetry provides APIs and SDKs, among other tools, to measure and collect telemetry data for distributed and cloud-native applications. It also supports transmitting the collected telemetry data to measurement and visualization tools, such as Datadog, which is used for Kubernetes monitoring.
Why you need OpenTelemetry
To maintain and improve your software, you need to know how and why a particular functionality may have failed so you can enhance it. As application systems become distributed and grow more complex, it can become more difficult to consistently track these answers.
This is where OpenTelemetry can help you. Here are some of the key features it offers:
- It is a free, open-source tool, and the OpenTelemetry community has a lot of collaborators (and is looking for even more). This level of collaboration ensures that OpenTelemetry has comprehensive coverage and is flexible enough to use in a variety of situations.
- It provides a unified standard for creating and collecting telemetry data, and it has the end-to-end ability to generate, process, and export that data.
- It provides a consistent collection mechanism and data format, but it can also work with a variety of platforms and programming languages, including Kubernetes, .NET, Go, Java, JavaScript, Python, and Ruby. It also integrates with libraries and frameworks, including Spring, Express, and Quarkus.
- Its auto-instrumentation capability allows developers to collect data without making code changes, then send the data to any backend application. You can also simultaneously send data to multiple destinations.
OpenTelemetry architecture
OpenTelemetry offers a set of APIs, SDKs, data model specifications for telemetry data, and semantic data conventions. It has a centralized collector and exporter. The exporter sends the collected telemetry data to your chosen monitoring and visualization application.
To get a detailed overview of the OpenTelemetry architecture and the current requirements for use, check the documentation.
Using OpenTelemetry Java agent
Now that you have a better sense of what OpenTelemetry is and why you need it, it’s time you see it in action. You’re going to build a simple Spring Boot application and connect it to OpenTelemetry.
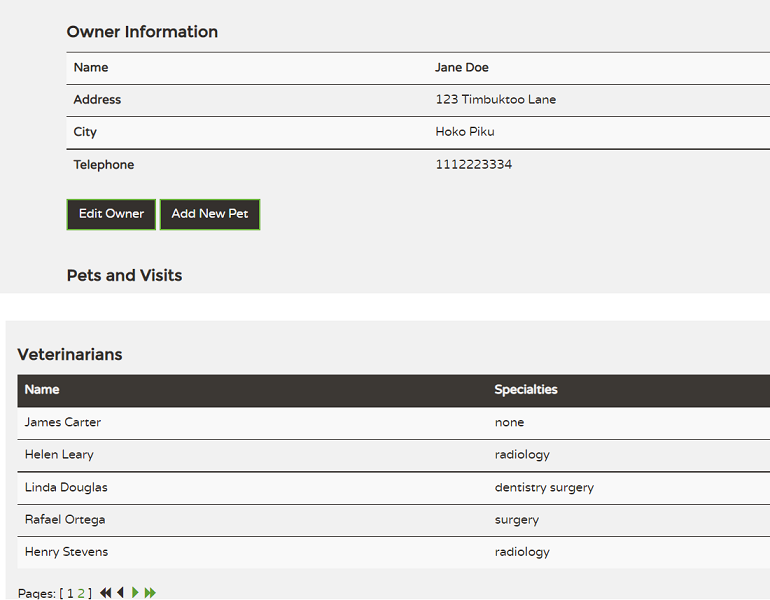
The project used here is a sample application by the Spring community called Petclinic, built using Maven. The README gives the steps for running the application. Then generate the JAR and check if you can run the application.
The OpenTelemetry project supports both automatic and manual instrumentation. OpenTelemetry provides a Java Agent JAR for automatic instrumentation. Download the latest JAR for OpenTelemetry Java Agent, which you can find here.
The Java Agent dynamically injects bytecode and captures the telemetry code without making any changes. Automated instrumentation is a great place to start to understand what instrumentation data is all about.
Using the Java Agent JAR, you can then export the instrumentation data to a monitoring and visualization application of your choice. An even simpler option is to use the OpenTelemetry logging exporter to print the instrumentation data in your application’s console.
To run the application after building and generating the JAR file, you can run a command, like the one below, in a command line:
So for this sample application and setup, here is the command:
Once the application is up, you can check http://localhost:8080 to see the application running. If you check the console, you will see the OpenTelemetry logs.
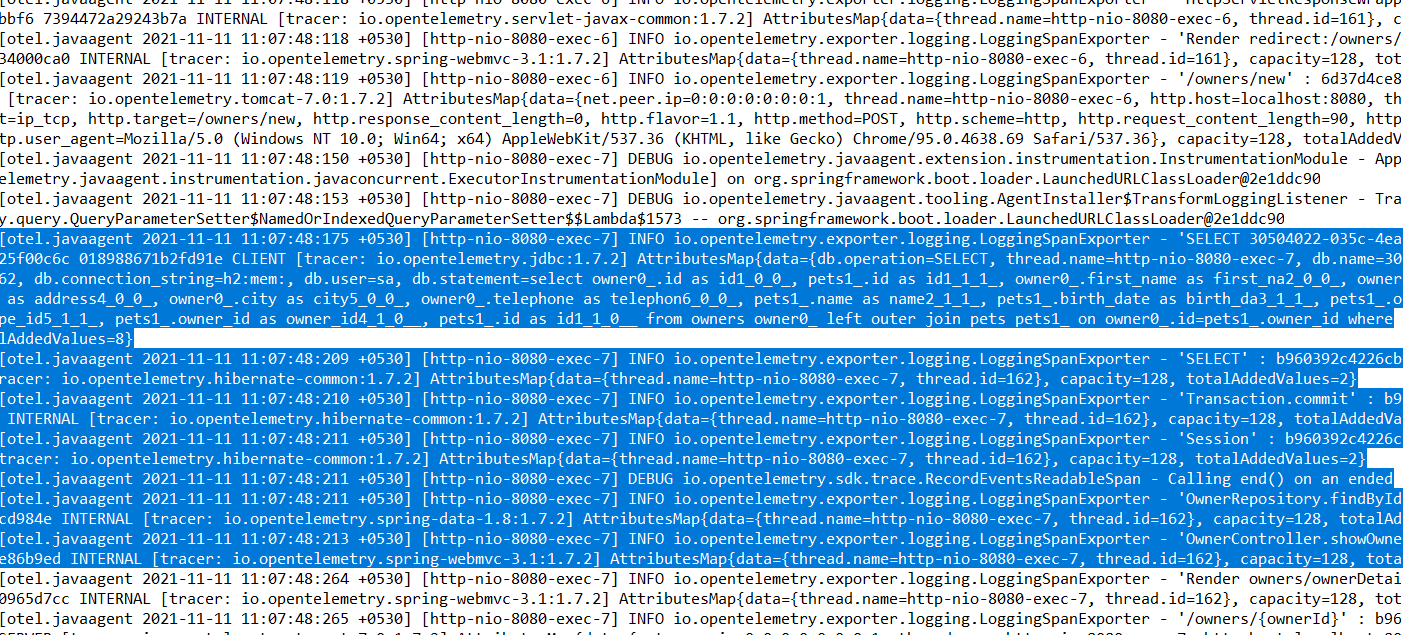
OpenTelemetry captures data, including the spans for database connections; the actual queries implemented and calls made to render the pages, along with the time spans for these events; the garbage collection strategy used by the JVM; and the number and type of metric data generated. This information shows you which processes are taking extra time or which ones are getting stuck and causing performance issues and potential memory leaks. You can then create fixes for these issues in the application code.
You can gain all these insights by passing configuration parameters without a single extra line of code.
Next steps
You saw an example of automatic instrumentation using the OpenTelemetry Java Agent. You can also do manual instrumentation using the OpenTelemetry API and SDKs. With manual instrumentation, you can add custom fields to the spans created by automatic instrumentation.
You first need to get the dependencies. To start using custom spans, import OpenTelemetry’s Span class to your code:
To get started using the span, add the current auto-instrumentation context as follows:
Using the span object, you can set the attributes you require in the span. Here’s an example:
OpenTelemetry also offers features like the OpenTelemetry Collector and Exporters for applications like Jaeger and Prometheus. You can even configure monitoring tools, like Jaeger, Zipkin, or Prometheus, by changing the -Dotel properties. The properties that you need to configure are given here.
Furthermore, OpenTelemetry offers a complete instrumentation example so you can learn how to configure your application for instrumentation.
Conclusion
Now you should have a better idea of the benefits of OpenTelemetry and how you can use the project to monitor and improve your software.
If you're looking for an even easier, maintenance-free solution for building monitoring and metrics dashboards, then check out Airplane. With Airplane, you can build powerful internal tools using SQL queries, Python scripts, REST API calls, and more. Airplane offers Views, a React-based platform for building internal UIs quickly. With Views, you can quickly build and customize a monitoring and metrics dashboard that helps you manage your data in real time and debug errors quickly.
To build your first internal dashboard within minutes, sign up for a free account or book a demo.


