


Constructed from the amalgamation of OpenCensus and OpenTracing, OpenTelemetry is a suite of integrations, APIs, SDKs, and tools that generate telemetry data for consumption on a variety of backends. Think of OpenTelemetry as a collecting instrument that leaves open ends for engineers to plug third-party data analysis tools to make the most of logs, traces, and metrics through visualization.
The above is possible, thanks to OpenTelemetry’s collectors and exporters. These are core elements of the implementation that help developers source telemetry data to feed observability tools from applications’ backends.
This article is an introduction to OpenTelemetry collectors and exporters which aims to leave you convinced of the efficacy of its methods and ready to integrate it with your projects.
Why you need OpenTelemetry collectors and exporters
Building applications in the cloud and through connecting microservices is a prevailing trend nowadays, and with that comes polyglot applications. This allows developers to reap the best features from different languages and frameworks. Some services could be programmed using Golang, while still (at the backend), several others have Rust, Python, and even Ruby in their source code to create the smoothest performing multiservice architecture.
Extracting performance data from scenarios like the multi-language/framework example above can be a tough task, limiting the observability of cloud-hosted (distributed) microservice application models. Having several open-source, commercial tools connected into such an application to drain telemetry data used to be the only way to gain insights from every backend component.
The issue with current observability and monitoring systems is that you are locked once you choose the platform to use and analyze your data. There is no easy way to migrate or swap-in-place one provider for another. The open-source community felt that they had to choose from the existing solutions and could not actively contribute to improving telemetry solutions.
Then came OpenTelemetry collectors and exporters. These methods, which are basically functions and packages, provide a direct solution to the complications that such a model presents by providing vendor-agnostic ways to create, collect, and transport data into any receptor applications (APIs and agents) for analysis.
An OpenTelemetry collector and exporter use case
Consider an application hosted in the cloud that is using several open-source, telemetry data extraction tools along with Datadog and New Relic agents planted into its codebase for logs and metrics analysis. Both such tools (and any others that you might add based on backend language compatibility) can be replaced with a layer of the OpenTelemetry implementation.
Such a replacement leaves you with a layer of collectors that access a wide area of your application, observability-wise, and exporters from which any vendor can fetch telemetry data. For Golang, this layer exists in the form of standard exporters for various tools. These include Prometheus and Jaeger.
OpenTelemetry library and data sources
Ideally, every application and any attached libraries should be observable once they call on an Otel API—at least this is what the foundation and its contributors are working toward. At the moment, OpenTelemetry works as an instrumentation library for already existing applications and libraries.
Implementing collectors and exporters into applications of a variety of supported languages is a well-documented endeavor, with the baseline code readily available to get telemetry data flowing to any backend or application.
To understand the implementation of the collector and exporter components of Otel, it’s important to form a working knowledge of the library’s source variables. The following data sources (categories) are involved in the functions carried out by both collectors and exporters in OpenTelemetry:
- Logs
- Metrics
- Traces
- Baggage
Let’s take a closer look at each of these.
Logs
Logs are text-format recordings of application events. The intended use of logs, when recorded by OpenTelemetry instrumentation, is to audit events. As such, any traceable event that happens to an observed application has a time stamp and an account labeled as the actor.
There are several classifications of logs, including info, error, and warning logs. Typically they’re classified and labelled based on the severity of events, with critical being the highest level.
Metrics
Metrics represent a measurable event. A good example would be request load time, which measures how long a client query takes to return a result. When recorded, metrics have a label, which serves to identify an event, along with metadata such as when the observation occurred as well as its duration.
The Otel library specifies three unique instruments associated with all metric data:
- Measure - This value adds up each time an event occurs. It’s handy for instances where you want to know the total effect of a particular metric. An example of this would be the number of hours an application experiences downtime. Each incident adds to an aggregate that can be reviewed later.
- Counter - This is an accumulated recording of any particular metric pertaining to an application. Once recorded, every other occurrence increments the initial value. A good example of this is the uptime duration of an application from the day it was launched.
- Observer - This is a static representation of a metric value. Considering how much RAM an application is consuming at the moment of observation is an example.
Traces
A trace is that single request tracking/monitoring process from creation to a returned result (or error). Every trace can be broken down into spans. A span represents a unit of the amount of work (actual processes executed) along the lifecycle of a trace.
Just as every data element has metadata, a trace’s spans contain naming labels, time stamps to measure its duration, status, and details of any associated events.
Baggage
Finally, baggage is a way of passing along event data that is associated with other metrics in value pairs. Baggage data therefore gets consumed as name/value indexes that make it easy to establish any relationships in observed telemetry data in real time.
How OpenTelemetry’s collectors work
Otel collectors are a single piece of software that handles the collection, transformation, and distribution of all telemetric data to the monitoring/telemetry platform of your choice. This cancels out the need for injecting numerous agents and APIs from commercial telemetry analysis vendors. If you’re brand-specific, such that the telemetry data has to follow a standard format, the collector can handle conversion before integrating with your preferred tools.
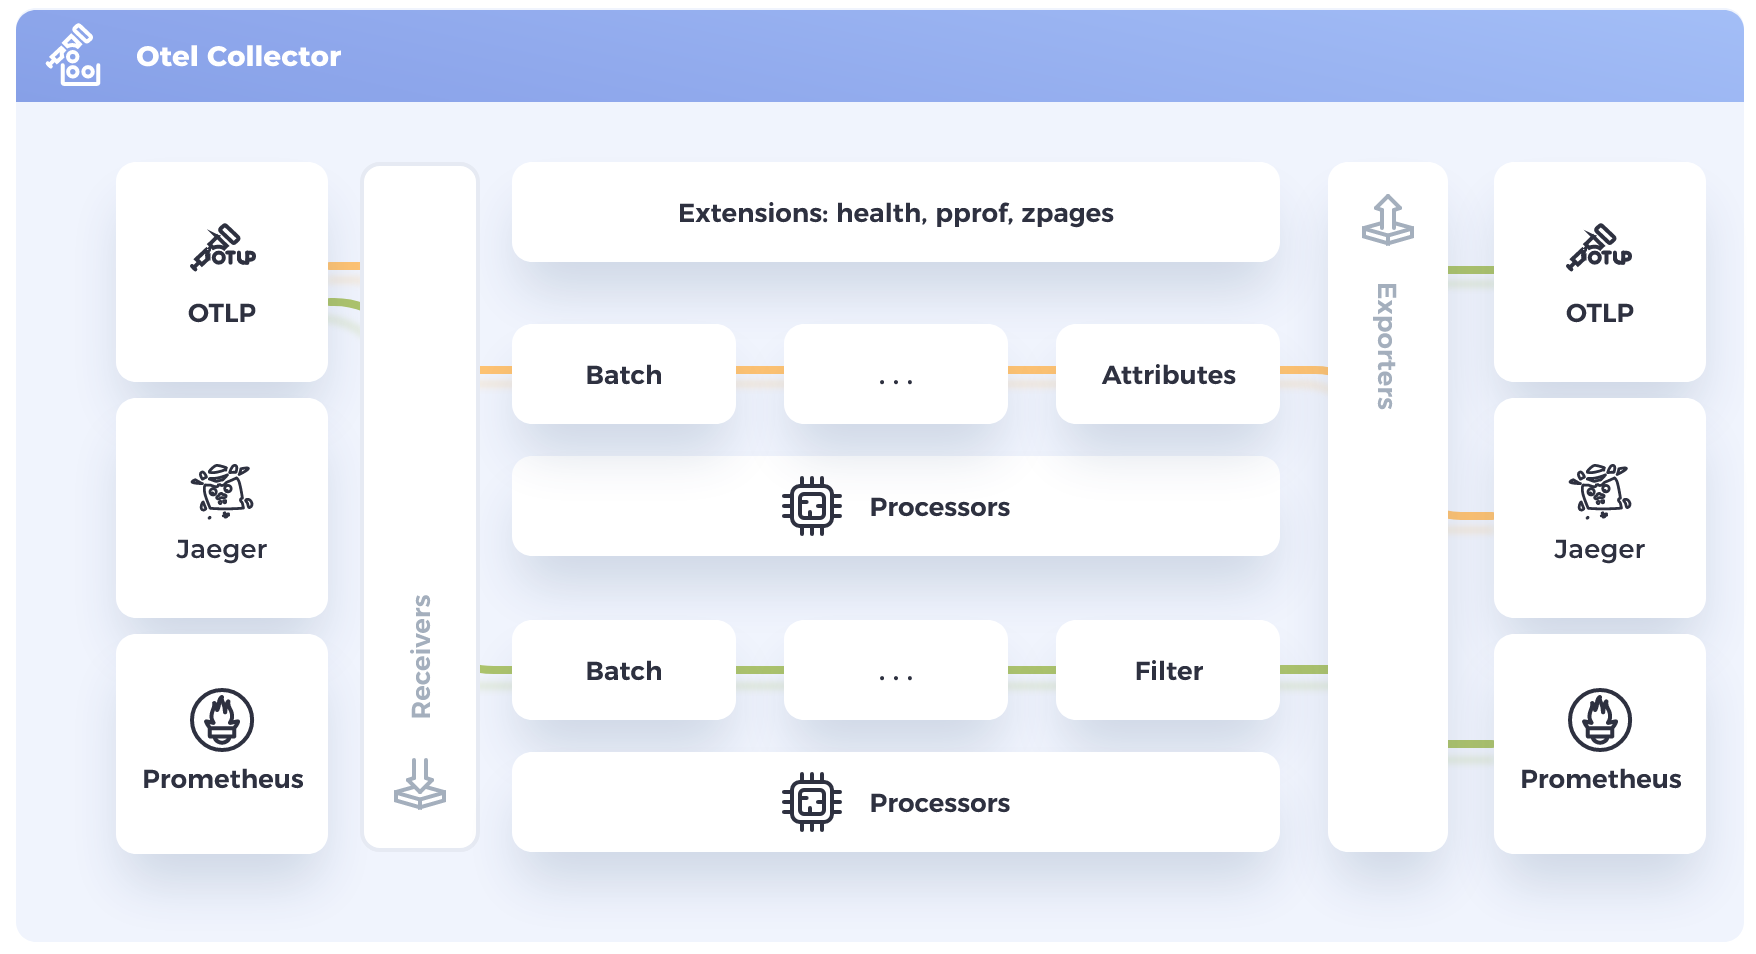
Under the hood, the OpenTelemetry collector consists of three core components:
- Receivers - This is the point of first contact between telemetry data and the Otel collector. Depending on your objectives, receivers can be push or pull configured to determine the flow of data.
Here’s a typical receiver setting to scrape metrics every five seconds from port 8888:
- Processors - Although optional, processors provide engineers a gap through which data passes and can be analyzed or modified (filtering, cleaning, etc.) before being presented to any attached visualization tools.
Here’s an example processor configuration that obfuscates emails as (if) they exist in received telemetry data:
- Exporters - As their name suggests, exporters are the collector’s endpoint before feeding data to an attached application or backend for analysis and presentation. For every configured destination, an endpoint must be specified, along with the optional inclusion of any extensions.
The variable setting below pushes all telemetry data to a specified file:
All three components of the Otel collector come with default configurations and support the data sources that we’ve grouped as telemetry data.
When setting/configuring a collector’s receiver section, it’s important to set some authentication measures to protect all ports exposed by the process of collecting and passing data around. You can achieve this by using specifying extensions in the collector’s implementation. As with any well-supported library, an OpenTelemetry authenticator registry exists to quicken the implementation.
Once you define a collector’s receiver, processor, and exporter components, you can refer to them as one would use functions in an application’s code. However, the Otel collector features are not all activated by default. You need to explicitly define service pipelines to pass telemetry data between receivers, processors, and exporters.
Here’s what a typical pipeline configuration looks like:
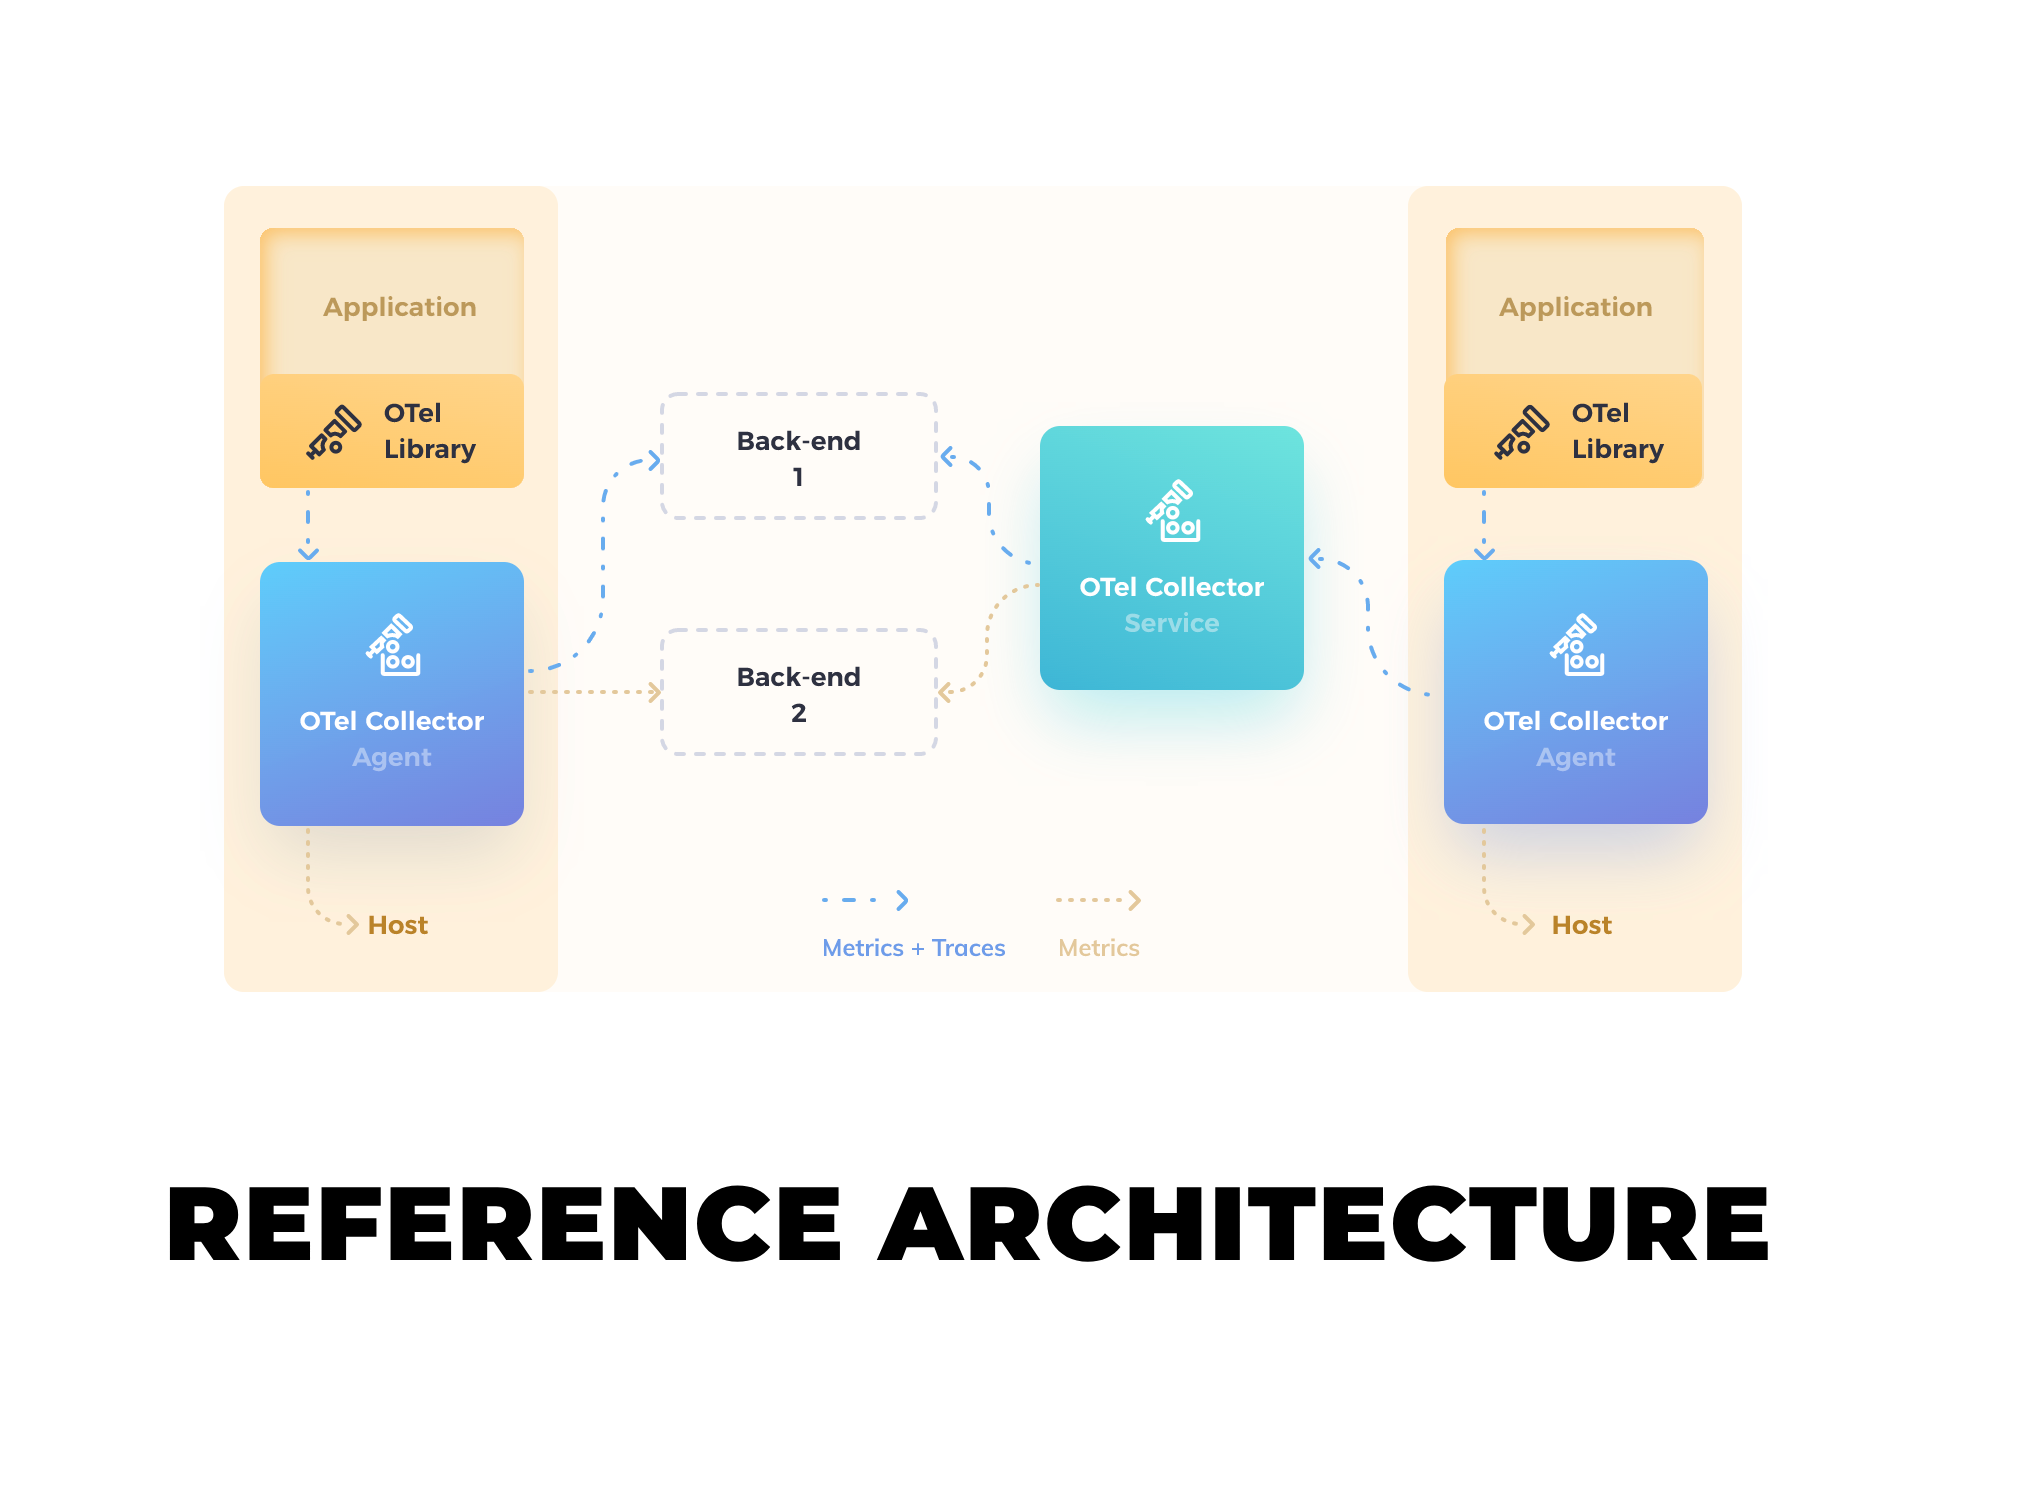
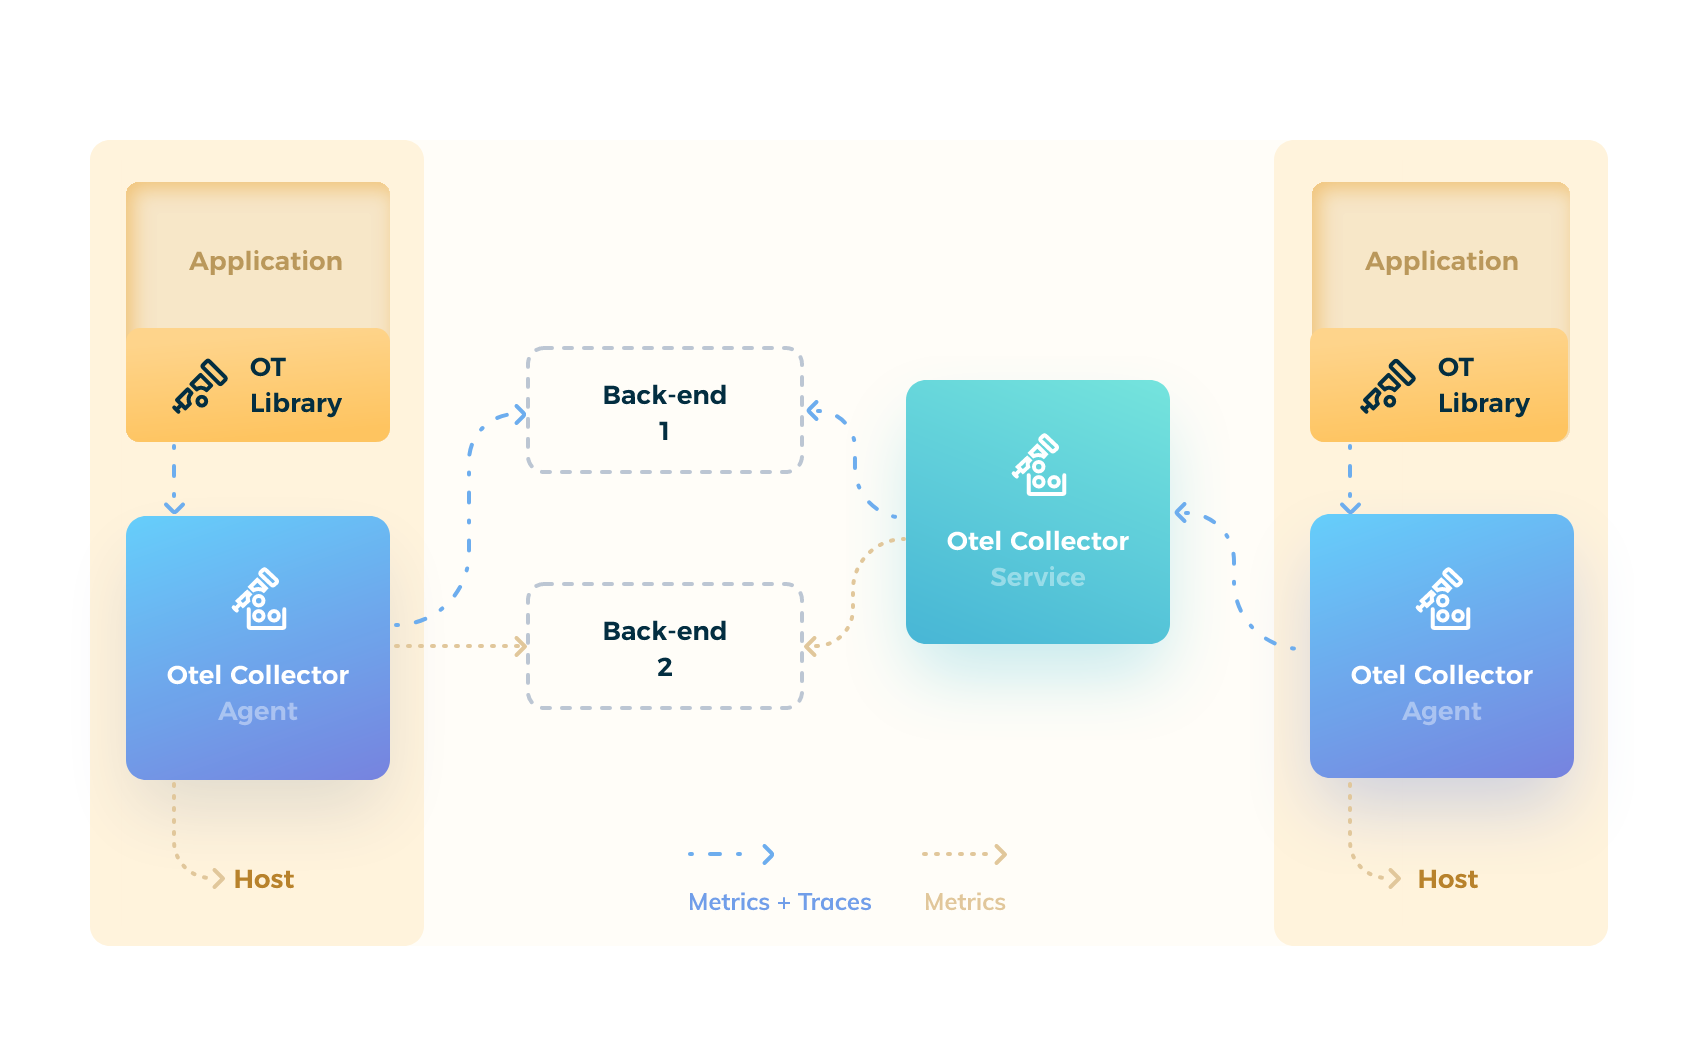
Collectors are very flexible by design, as they can play two different roles. First is the role of an agent that can run with the application or on the host system. When the collector is installed on the host system, the application communicates using an Otel library. Second, collectors can play the role of a gateway that aggregates and exports your data to the monitoring backend. This architecture makes OpenTelemetry suited for all kinds of monolithic or distributed systems.
A smooth transition to OpenTelemetry exporters
As you have read, the exporter is a core component of OpenTelemetry collectors. It is the glue between the new OpenTelemetry protocol (OTLP) and the existing monitoring and observability solutions. This design will guarantee a smoother transition to OpenTelemetry, as solution providers don’t need to add to their product support for OTLP; so long as an exporter exists, you are covered.
Before jumping into setting up a collector, you should research whether exporters exist for your observability platform. As you can see on Github (for instance, here), many OpenTelemetry repositories have new commits and pull-requests every day. Most monitoring platform providers have already started working on implementations and provide a beta version of an exporter. That being said, you may have to wait until mid-2022 to get a stable version. The good thing is that the open-source community seems to put a lot of effort into this project, resulting in solid telemetry standards and tools for the future.
Final thoughts: what to know about OT collectors and exporters
The OpenTelemetry project is an attempt to standardize and simplify the process of extracting telemetry data from applications. So far, only a handful of backend languages are supported, although more will join the list with time.
Crucial to its operation, every Otel implementation consists of a collector model. The collector itself is based on variables set to determine how data is received, processed, and exported to destination endpoints.
Once the Otel library becomes part of your codebase, you should be able to connect supported agents to provide wider observability into distributed, polyglot applications.
If you're looking for a powerful internal tooling platform to help track metrics and ensure your applications are performing as desired, Airplane is a good fit for you. Airplane is the developer platform for building internal tools. The basic building blocks of Airplane are Tasks, which are single or multi-step functions that anyone on your team can use. Airplane also offers Views, a React-based platform for quickly building internal UIs. You can build powerful tools that support your various engineering workflows.
To build your first workflow in minutes, sign up for a free account or book a demo.


