


Node.js is a popular scripting programming language used by many software developers to build highly performant backend web applications. It provides many benefits, such as ease in spinning up an application, asynchronous request handling, high performance, and much more.
Integrating a robust monitoring solution into your Node.js application is important because it provides insight into what’s happening in your application at a given time or within a particular period. These metrics can help you discover security flaws in your application, high latency in your application APIs, and bottlenecks in your application, as well as providing insights in improving the overall performance of your application.
In this article, you’re going to learn important concepts related to Node.js application monitoring, including monitoring concepts that every developer should understand, tools and methods for monitoring Node.js applications, and best practices to follow when implementing monitoring systems.
Getting started
Monitoring Node.js applications involves closely observing the application performance and availability over a certain period. This helps you to notice any unexpected behavior that can affect the performance of your application. Some of these unexpected behaviors include things like high API response times, slow database queries, blocking operations, and memory leaks.
Additionally, your monitoring tool should be coupled with a good alerting system. This allows you to configure alerts for important metrics that can have a dangerously negative impact on the application’s performance and availability, enabling you to correct problems before they get out of control.
It’s also important to make sure that your monitoring tools are well-configured. If they’re not configured properly, you could end up wasting time on false positives, which can affect deadlines and development time. If your monitoring tools are configured properly, though, you can catch bugs quickly, improve application performance, and ultimately make your users—and developers—happy.
Importance of monitoring your Node.js application
When you deploy your Node.js application to the production server, you’ll want to know the different pain points and bottlenecks that are impacting the performance of your application, so you can have a better idea of where it needs improvement. However, without a proper monitoring system, it can be difficult to get these details. Therefore, it’s important to integrate a robust monitoring system that can provide metrics to help improve the application’s performance.
Removing bottlenecks
Bottlenecks negatively impact your application’s performance. They can make your application slow, frustrating your users. Examples of bottlenecks include executing an unoptimized query, such as needless joins, or running an unoptimized function, such as a function executing database queries in a nested loop.
Problems like these can slow down the performance of your application, especially if they occur in a frequently used part of the application. Integrating a good monitoring tool allows you to identify these bottlenecks early on, and fix them before they become disruptive.
Improving user experience
A great way to lose users is to give them a bad experience while using your application. Such experiences include a slow API response time, application crashes, and server downtime. Without a good monitoring system in place, you may not notice these issues until they’ve already cost you customers.
For instance, it can be difficult to know which APIs have a slow response time manually, but with good monitoring, you can track the average response time for each API. If one gets bogged down, you can fix it immediately—before it drives users away from your application.
Reduce computing costs
Your Node.js application could contain functions that aren’t properly optimized, and, as a result, have lengthy execution times. If you’re using serverless computing to run your application, this could lead to an unpleasant surprise when your bill comes due. With a good monitoring and alerting solution, you’ll catch unoptimized functions like this before you rack up a huge bill for your computing resources.
Three important monitoring concepts
There are some important monitoring concepts you have to know and understand in order to monitor your Node.js application appropriately. If you don’t understand these concepts, it’s easy to overlook some metrics that would alert you to something affecting your application negatively.
Error handling
Error handling refers to the detection of errors in your application, and how the errors are handled for proper understanding and debugging. If an error isn’t handled properly, with good error messages and stack traces, it can lead to hours of debugging as you attempt to hunt down the cause of the error.
Downtime
Downtime refers to a period when your application is unavailable. This can lead to users encountering errors such as “Internal Server Error” or “Server Not Available”. In a worst-case scenario, they may not be able to access the website at all. There are several reasons why an application may experience downtime, including bugs in the application, application upgrades and migrations, and server failure.
Resource utilization
Resource utilization refers to the usage of resources used by your Node.js application. The resources include CPU, memory, and disk usage.
What to monitor in your Node.js application
There are many things you can monitor in a Node.js application, and exactly what you choose to monitor is dependent upon your use case. This section highlights some of the things you can monitor in a Node.js application.
Error rates
Error codes, messages, and stack traces provide insights into what caused an error. In some scenarios, your Node.js application may throw the same error repeatedly. This could be caused by several factors, such as broken functionality, a malicious attacker trying to brute force their way into your application, or an unauthorized user trying to gain access to a protected API.
Putting a good monitoring system in place can help you detect when errors are happening repeatedly, which allows you to fix the error before it affects your application negatively. A sudden spike of errors, or an error that recurs frequently, is a sign of something important that requires urgent attention.
Application downtime
Downtime can be incredibly frustrating to users, and can lead to losing customers or prospective customers. Therefore, it’s important you have a monitoring system that detects downtime quickly, and notifies your engineering team instantly so they can take action to resolve the issue.
Monitor resource usage
A good monitoring system allows you to monitor your Node.js application resource consumption. When part of your application isn’t fully optimized, it uses more resources, which can impact the overall performance of your application and drive costs up. Technical debts like this can make you think you need to add more hardware to handle the high resource consumption, which can be costly. A good monitoring system will help you find places that need to be optimized, improving performance and saving money.
Best practices
To get the most out of your monitoring tool, there are some best practices you should follow. In this section, you’ll learn some of them.
Configure alerts based on urgency
It’s important to configure alerts based on the importance of the alert. There are high priority and low priority alerts, though what alerts fall into each category will vary by organization. Low priority alerts can wait for a longer period before a member of your team attends to it. High priority alerts need urgent and immediate attention. When alerts are not configured based on priority, urgent alerts may go unnoticed while lower-priority alerts are getting immediate attention. This uncertainty in responding to alerts can affect your application negatively.
Know what events need monitoring
To keep your monitoring useful, you need to know what events are important to you, and ensure that you’re monitoring them—and that you’re not monitoring a bunch of things you don’t care about. If you don’t know what you’re monitoring for, your log data, for example, can contain a lot of noise, preventing you from using the system effectively.
Ensure alerts are sent to the appropriate department
While it may seem easier to have your alerts sent to everyone, it’s a better practice to send them only to the individual responsible for the event. When you send alerts to everyone, it increases the chance that no one will take responsibility for it, or that everyone will expect someone else to handle the issue. Sending alerts to the specific individuals responsible for resolving that issue increases the chance that those people will feel empowered to take ownership of the sent problems.
Popular tools for monitoring Node.js applications
There are many popular tools available for application monitoring in the Node.js community. Here’s a brief overview of some of the most popular ones.
Pm2
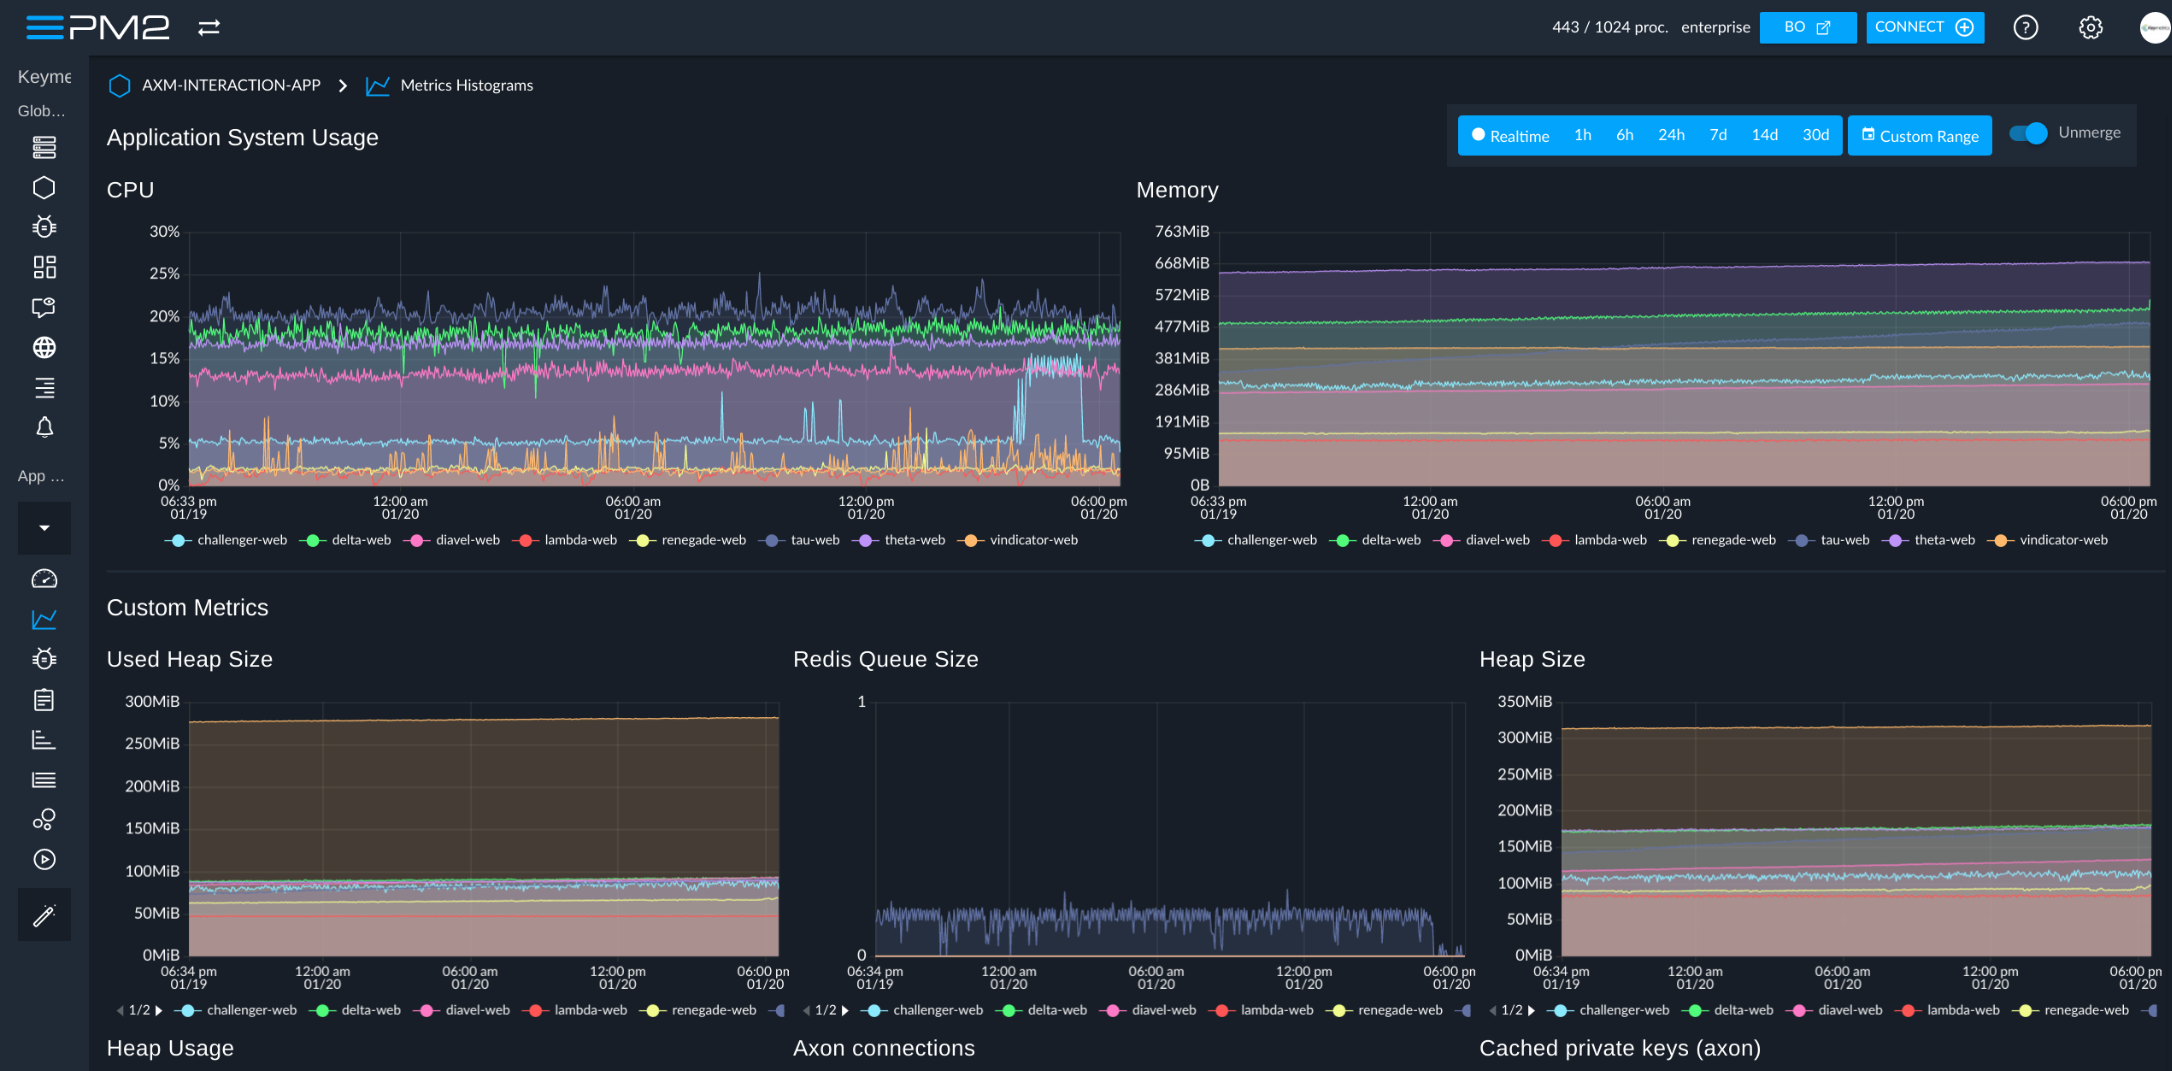
Pm2 is a popular process manager used by many Node.js developers to keep their applications running in the production environment. It allows you to monitor things such as your application’s CPU and memory consumption, HTTP latency, number of issues detected, and much more. It has a web interface that allows you to monitor your application in real-time, enabling you to notice changes that can negatively impact the performance of your application. You can also configure Pm2 to send notifications via email and Slack notifications when metrics have crossed user-set limits.
Retrace
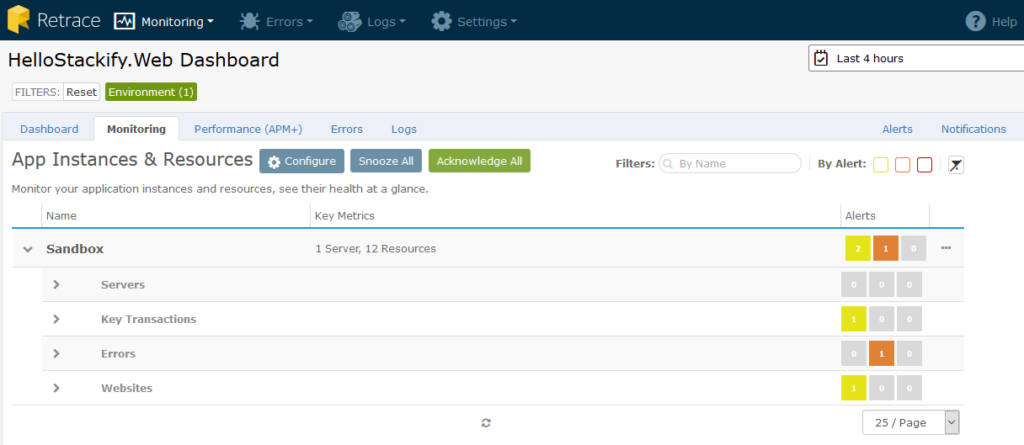
Retrace is another popular Node.js monitoring tool that will help you proactively identify issues. With Retrace, you can monitor different layers of Node.js applications, such as your SQL query performance, slow API requests, the most requested API, and memory and CPU consumption.
Additionally, Retrace is an intelligent log management system that provides insight into the cause of the log messages. It also offers an easier way to sort and search through your logs with its advanced search and filtering functionality. It provides a structured logging format, making logs more easily read by a human.
Prometheus
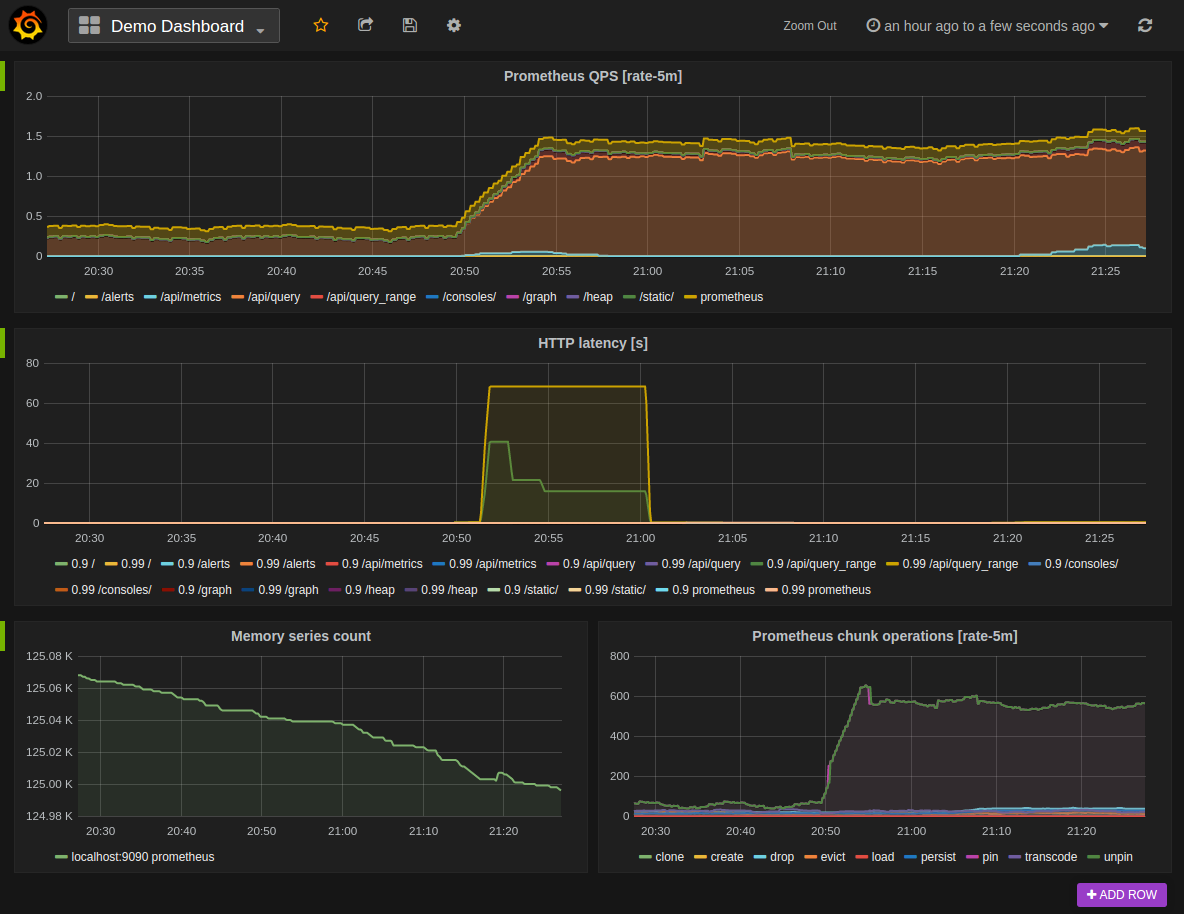
Prometheus is an open source monitoring tool that you can use to monitor your Node.js application. It stores all metrics data as time series, which means that metrics data is collected at different points in time, and stored with prior values for the same metric. This provides greater insight into the changes of certain metrics, such as CPU usage over time.
Prometheus also has a visualization tool for monitoring and gaining insight into your application. If you’re not satisfied with the default Prometheus tools, you can integrate Grafana, another open source tool, for visualization with Prometheus. Grafana allows you to create different custom dashboards for monitoring your application.
Security concerns when monitoring a Node.js application
Security is an important aspect of any application, and if your application is compromised, it can lose you money and customers, or even drive you out of business. This makes it painfully clear how essential it is to make your application as secure as possible.
When integrating monitoring tools into your application, you can also set alerts for status codes related to security breaches. For example, you can set an alert that will trigger if the number of 401 or 403 HTTP errors exceeds a threshold. For instance, you could set an alert for more than twenty “401 Unauthorized” errors within five minutes, as this could indicate that someone is trying to breach your system. Knowing that this is happening, you can respond proactively, before such an attack is successful.
Monitoring isn’t restricted to the final application, either—you must also monitor your application dependencies. There are many packages in the NPM registry that contain different vulnerabilities, and ignorance of these vulnerabilities can be a huge security threat to your application. The npm audit command is a good place to start with finding vulnerabilities in the packages used by your application.
It’s also important to integrate detailed logging mechanisms in your codebase while developing your application. When you have a good logging mechanism in your application, it’s much easier to monitor and detect security threats. It can allow you to view history and detect unauthorized actions by users, quickly get to the root cause of any security attacks, and much more.
Final thoughts
Monitoring is vital for any Node.js application. Building a Node.js application without integrating any monitoring system into it will affect the growth of the application because you will lack insights into what is affecting the performance of the application, both positively and negatively. This article has introduced you to the basics of monitoring your Node.js application: why it’s important, what to log, best practices, logging tools, and security concerns. A properly integrated monitoring system can bring you tremendous benefits, providing insights that you can use to improve your application and make your users happy.
If you're looking for a maintenance-free platform that makes it easy to monitor your Node.js applications, then consider using Airplane. Airplane is the developer platform for building internal tools. With Airplane, you can transform scripts, queries, APIs, and more into powerful workflows and UIs. Using Airplane Views, you can build a monitoring dashboard that makes it easy to track and manage your applications in real time. Airplane offers pre-built components and templates, making it easy to get started.
To build your first dashboard within minutes, sign up for a free account or book a demo.


