


Kubernetes has arguably revolutionized the DevOps world. Beforehand, engineers, developers, administrators, and operations teams had to perform many tasks manually to deploy and manage the containerized application. Containers have changed the way we run services on servers, and Kubernetes has transformed the way we interact with these containers.
But while Kubernetes has solved plenty of old issues, it’s also created some of its own. You still need visibility into your application and its performance, like infrastructure metrics and container insights. With Kubernetes monitoring, all of these are made possible—but monitoring isn’t straightforward.
Choosing a monitoring solution for the cluster is key. There are literally hundreds of monitoring solutions available for Kubernetes, consisting of managed and unmanaged, open-source, and enterprise.
In this article, we’ll discuss two enterprise monitoring solutions available for Kubernetes—New Relic and Splunk—and how to select the right one for your organization.

Tool goals
Understanding the goals of each monitoring solution is essential before choosing the right option for your workflow.
If you want to cut costs and are willing to manage the software, you can self-host it on your infrastructure. But if you want to get set up quickly and get running no matter the cost, it’s better to go with managed tools; even if anything goes wrong, they’ll usually have a support team ready to take care of your issues.
So before we get much further, let’s take a look at the goals of these managed tools.
New Relic
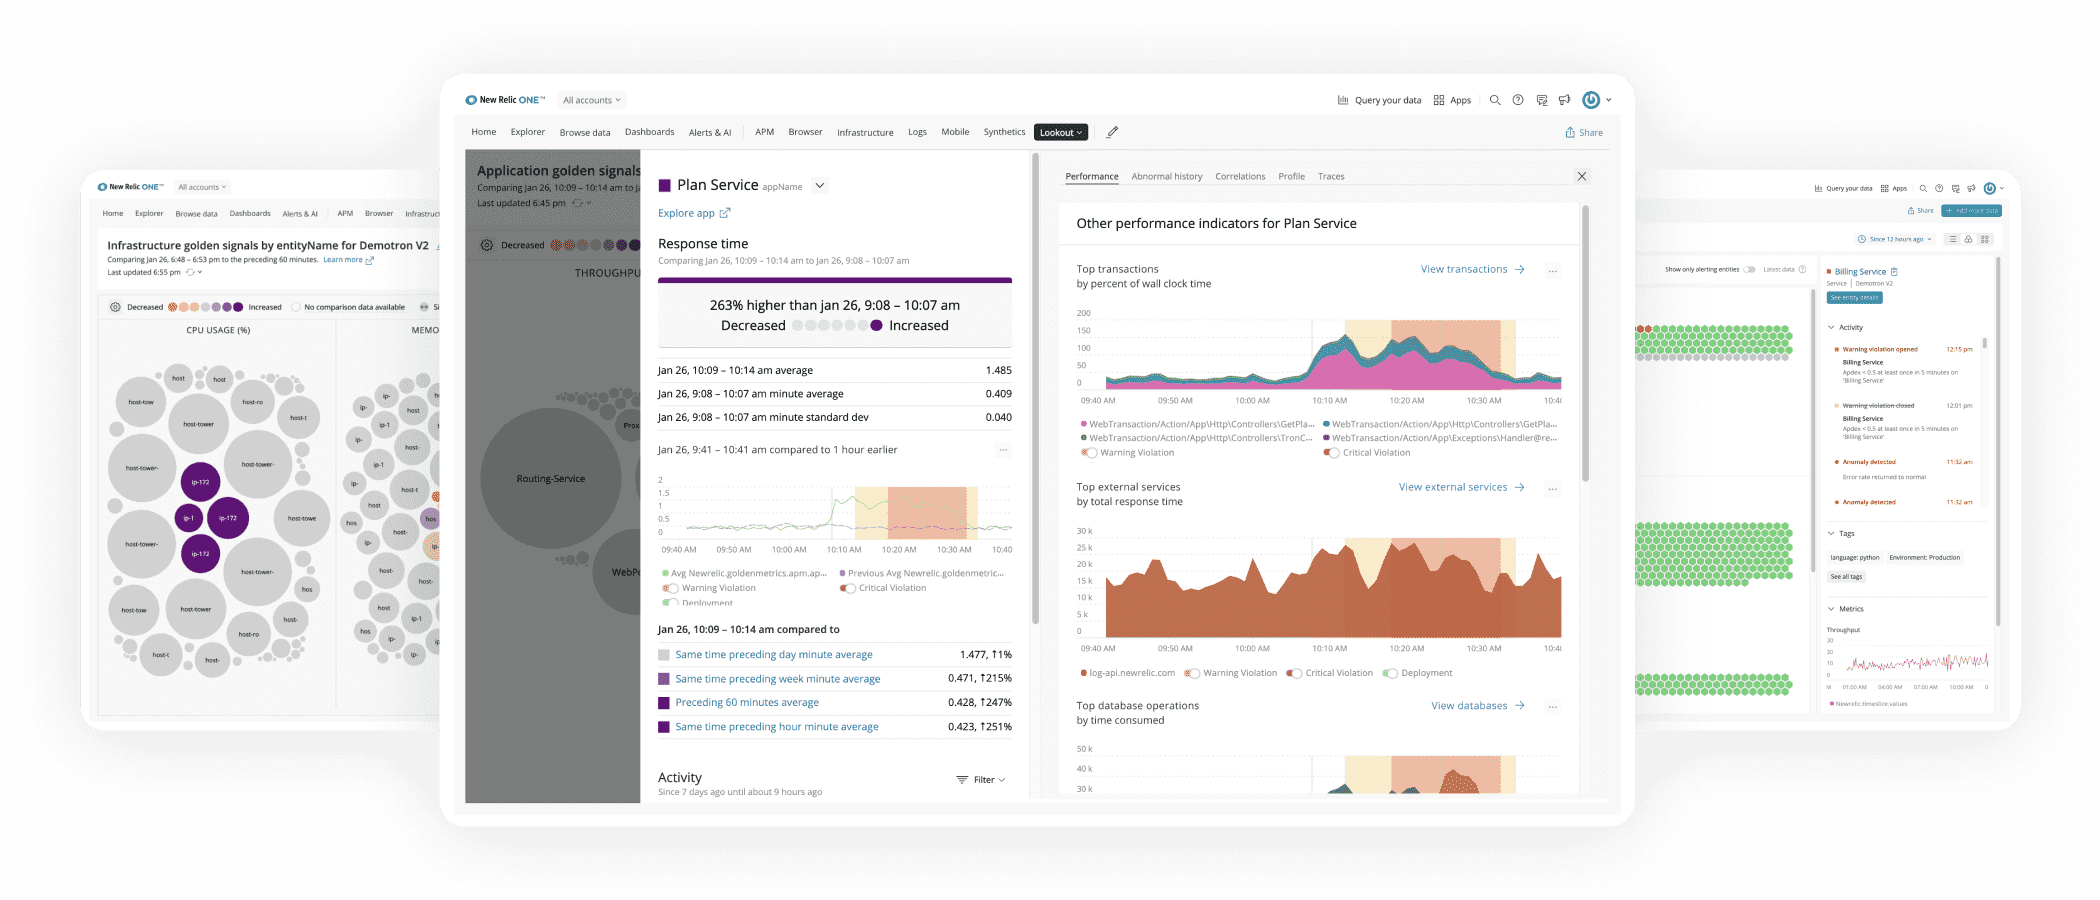
New Relic is a fully managed SaaS offering that primarily focuses on performance and availability monitoring. Its goal is to provide a real-time analytics platform that collects logs, events, metrics, and traces directly from your live production software, infrastructure, and services. It transforms this data into actionable insights about your entire stack, your business, and your customers’ experiences.
This in turn allows DevOps teams, developers, and operation teams to set up monitoring for their Kubernetes cluster without manual input and maintenance.
New Relic provides a comprehensive overview of your cluster, including:
- visualizing your services
- monitoring health and resource capacity
- alert suggestions
- troubleshooting deployment issues to the pod level
You can even monitor internal Kubernetes components gradually, including API server, ETCD, Control Plane, scheduler, etc.
Splunk
Splunk is more of an enterprise platform with managed and unmanaged deployment options that aim to empower IT, DevOps, and security teams to transform their organizations with data, from any source and on any timescale.
Given its goal, Splunk has more complex and diverse features. It also supports platforms other than Kubernetes. Essentially, Splunk gives you visibility of your entire stack. It also gives you enough data from the stack about every possible component.
Setting up the tools
So now you understand what the tools are trying to do. But setup is important, too. How easy is it, and how much time are you going to sink into getting ready to use either solution?
New Relic
New Relic provides an automated installer that will take inputs and generate a manifest file [.YAML] for your cluster. The manifest bundles all the configurations required for a Kubernetes event, Prometheus OpenMetrics, New Relic log monitoring, and so on.
Alternatively, you can define your own custom manifest if the installer doesn’t provide the setting you need. New Relic provides integrations with popular cloud service providers like AWS’s EKS, GCP’s GKE, Red Hat’s OpenShift Container, and Azure’s AKS. To read detailed documentation on installing New Relic on your Kubernetes cluster, take a look at the official documentation.
And if you get stuck at any point, you can always open a support ticket to get your issue resolved.
Splunk
Installing Splunk on Kubernetes is relatively complex and diverse as compared to New Relic. Before using Splunk on Kubernetes, you need to first install Splunk and then the add-on for Kubernetes.
First, install the Splunk Enterprise on your cluster. You can use the Splunk operator to make the installation process for splunk enterprise a little simpler.
Alternatively you can follow the official documentation for the installation process. The Splunk operator has some prerequisites for Kubernetes.
After you have installed and set up splunk enterprise, you need to install the splunk kubernetes add-on from the Splunk web UI. This add-on collects the metrics, log, and so on from the cluster and ships them to Splunk.
Overall, the installation process is simple, you just have to fill in some details about your Kubernetes cluster. It will automatically generate a Helm script for you to deploy all components required for your stack.
Feature comparison
You’ve got a good idea of what it takes to get set up with New Relic and Splunk. Now, let’s take a look at how their features compare.
New Relic’s metric collection
Once you’ve installed the Cluster Agent, no additional configuration is needed to collect metrics (as is the case with Prometheus, which is an open-source metric monitoring tool for containers or microservices).
New Relic has a tool called Pixie that allows you to quickly get access to your cluster metrics for your Kubernetes cluster—they’re sent to New Relic’s cloud dashboard for visualization. Metrics can then be used for setting up alerts, making interactive dashboards, checking the health of your cluster, and more. Pixie, utilizes eBPF in order to deliver an instantaneous experience.
Splunk’s metric collection
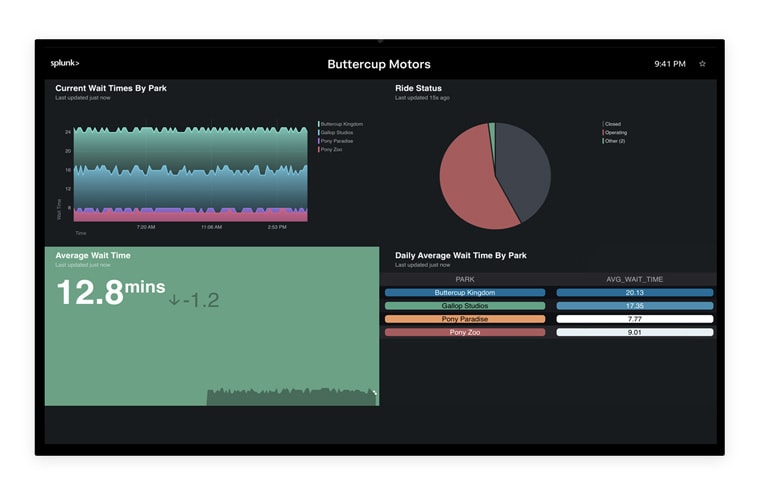
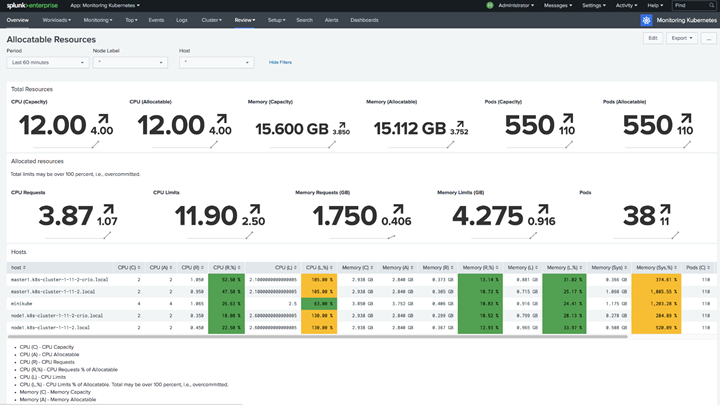
When you install Splunk on your cluster and set up the splunk-connect-for-kubernetes, all the metrics are scraped and shipped to Splunk. You can view your metrics just as with Prometheus. Multiple options in the Splunk enterprise allow you to use metrics data to create different dashboards and health alerts.
For Splunk Cloud, you need to install an add-on that will ship the metrics from your cluster to Splunk Cloud. From there, you have a few different options available as to how to use these metrics.
New Relic’s event monitoring
Monitoring events is made possible with an events integration plugin. This plugin needs to be installed after the New Relic Kubernetes integration, and activated.
To install, you just need to update some values in the manifest and apply them using kubectl. You can then query your event according to your requirements and see them in your New Relic web UI.
To read more about the event collection in New Relic, take a look at their detailed documentation.
Splunk’s event monitoring
There’s no need for a plugin to be configured in order to collect events in Splunk. Once you’ve installed the splunk-connect-for-kubernetes, you get a list of data to be collected, including events on the cluster.
For Splunk Cloud, you need to input specific settings for the monitoring machine, HCE port, and receiver port. Once configuration is done, the event data is made available to you, and you can use it as needed.
For a more detailed overview, take a look at this documentation from Splunk.
Visualization
Unlike Prometheus, there’s no need to use third-party monitoring solutions. A visualization dashboard comes out of the box for both New Relic and Splunk. This way, you don’t need to spend hours configuring visualizations and creating a dashboard from scratch.
Instead, premade and easy-to-understand dashboards give you an overview of the cluster, allowing you to customize what’s available.
Depending on the Splunk product you use (Splunk Enterprise, Splunk Cloud), there can be some differences in UI.

New Relic’s alerting
Alerting is the backbone of any Kubernetes monitoring solution. It ensures the reliability of the infrastructure and makes it easy to detect issues when they occur.
For New Relic, you can use their predefined alert policy which features messaging like:
Container CPU usageContainer memory usagePod is not ready
You select the alert you want to use, set up a notification channel, and you’re ready to go.
You can also set up custom alerts directly from the New Relic web dashboard. To read more about the predefined alerts in New Relic, read the documentation here.
Splunk’s alerting
There are many predefined alerts available out-of-the-box for Splunk, primarily for monitoring the health of the cluster. Creating alerts in Splunk is a similar process to New Relic; you go to your web dashboard and select the alerts you want to create. You’ll also find the options of predefined alerts and custom alerts, and you can even create advanced alerts based on your logs.
For Splunk Cloud, you need to install the same plugin we mentioned earlier—Monitoring Kubernetes–Metrics and Log Forwarding—which allows you to create alerts and monitor the health of your Kubernetes cluster.
Conclusion
Selecting a Kubernetes monitoring solution isn’t easy. To help you make your choice easier, this article highlighted two specific tools, New Relic and Splunk.
New Relic is essentially an APM (application performance monitoring) solution that also integrates with Datadog. Given that, New Relic could be the better choice over Splunk if you already have Datadog in your workflow. New Relic has four different price plans, from basic (free) to enterprise—you can take a look at the different plans here.
Splunk is more of a data platform with security as its main priority. The process of setting up and integrating Splunk with Kubernetes is also a bit different. Since it has many different integrations as a data platform, it’s a better choice for monitoring Kubernetes if it’s already part of your organization’s workflow. When it comes to pricing, Splunk has a variety of plans to choose from.
If you're looking for an even easier-to-use platform to build a monitoring dashboard for your Kubernetes clusters, consider using Airplane. With Airplane, you can transform scripts, queries, APIs, and more into powerful workflows and UIs. The basic building blocks of Airplane are Tasks, which are single or multi-step functions that anyone can use, and Views, which are React-based custom UIs. Airplane also offers strong out-of-the-box features, such as audit logs, permissions setting, and more.
To try it out, sign up for a free account or book a demo.


