


Every layer of your architecture generates massive amounts of data. To gain a comprehensive view of what’s happening inside your environments, you need to know where all of your data sources are, as well as have a solid method for collecting, processing, and storing your data from each one.
If you’re already collecting logs and metrics, no doubt you and your team have found ways to capture log data, performance metrics, and even application stack traces. But how can you make sense of it? What tools do you use to analyze this data? What are your options for viewing this data so you can understand trends and patterns?
Let’s compare two of the leading open source data analysis and data visualization tools on the market today: Grafana and Kibana. We’ll review how they each work, what their core benefits and features are, how they’re installed, and their alerting methods. By the end of this article, you should be able to fully consider what it would take to integrate one (or even both) of them into your monitoring and observability stacks.

How Grafana and Kibana work
Both Grafana and Kibana are free and open source tools for analytics and data visualization. Let’s begin by summarizing how they each function, and what they’re most commonly used for.
Grafana at the high level
Grafana is an open source data visualization and data analytics tool that provides you with ways to display your time-series database data in intuitive graphs, like heat maps and histograms. Grafana can be described as offering a fully-featured observability stack, complete with ways to create and share dashboards with your team members.
Grafana began as a fork of the Kibana project in 2014. The aim was to turn Kibana into a time series and graph-focused dashboarding tool. Today, Grafana is available via three distinct versions—Grafana: Open-Source, Grafana: Cloud, and Grafana: Enterprise.
Grafana: Open-Source is the free and open-source dashboarding product. Grafana began as an open-source project and continues to receive contributions to the project for bug fixes and feature enhancements.
Grafana: Cloud is the managed observability service offered by Grafana. It allows you to leverage all the features of Grafana without having “control plane responsibilities”—things like installing, configuring, and maintaining the nodes that host Grafana for you.
Grafana: Enterprise is the self-managed product offered to customers who want to manage their own observability stack yet gain access to all of the Enterprise features that are available, like the Enterprise Logs, Enterprise Metrics, and Enterprise Traces.
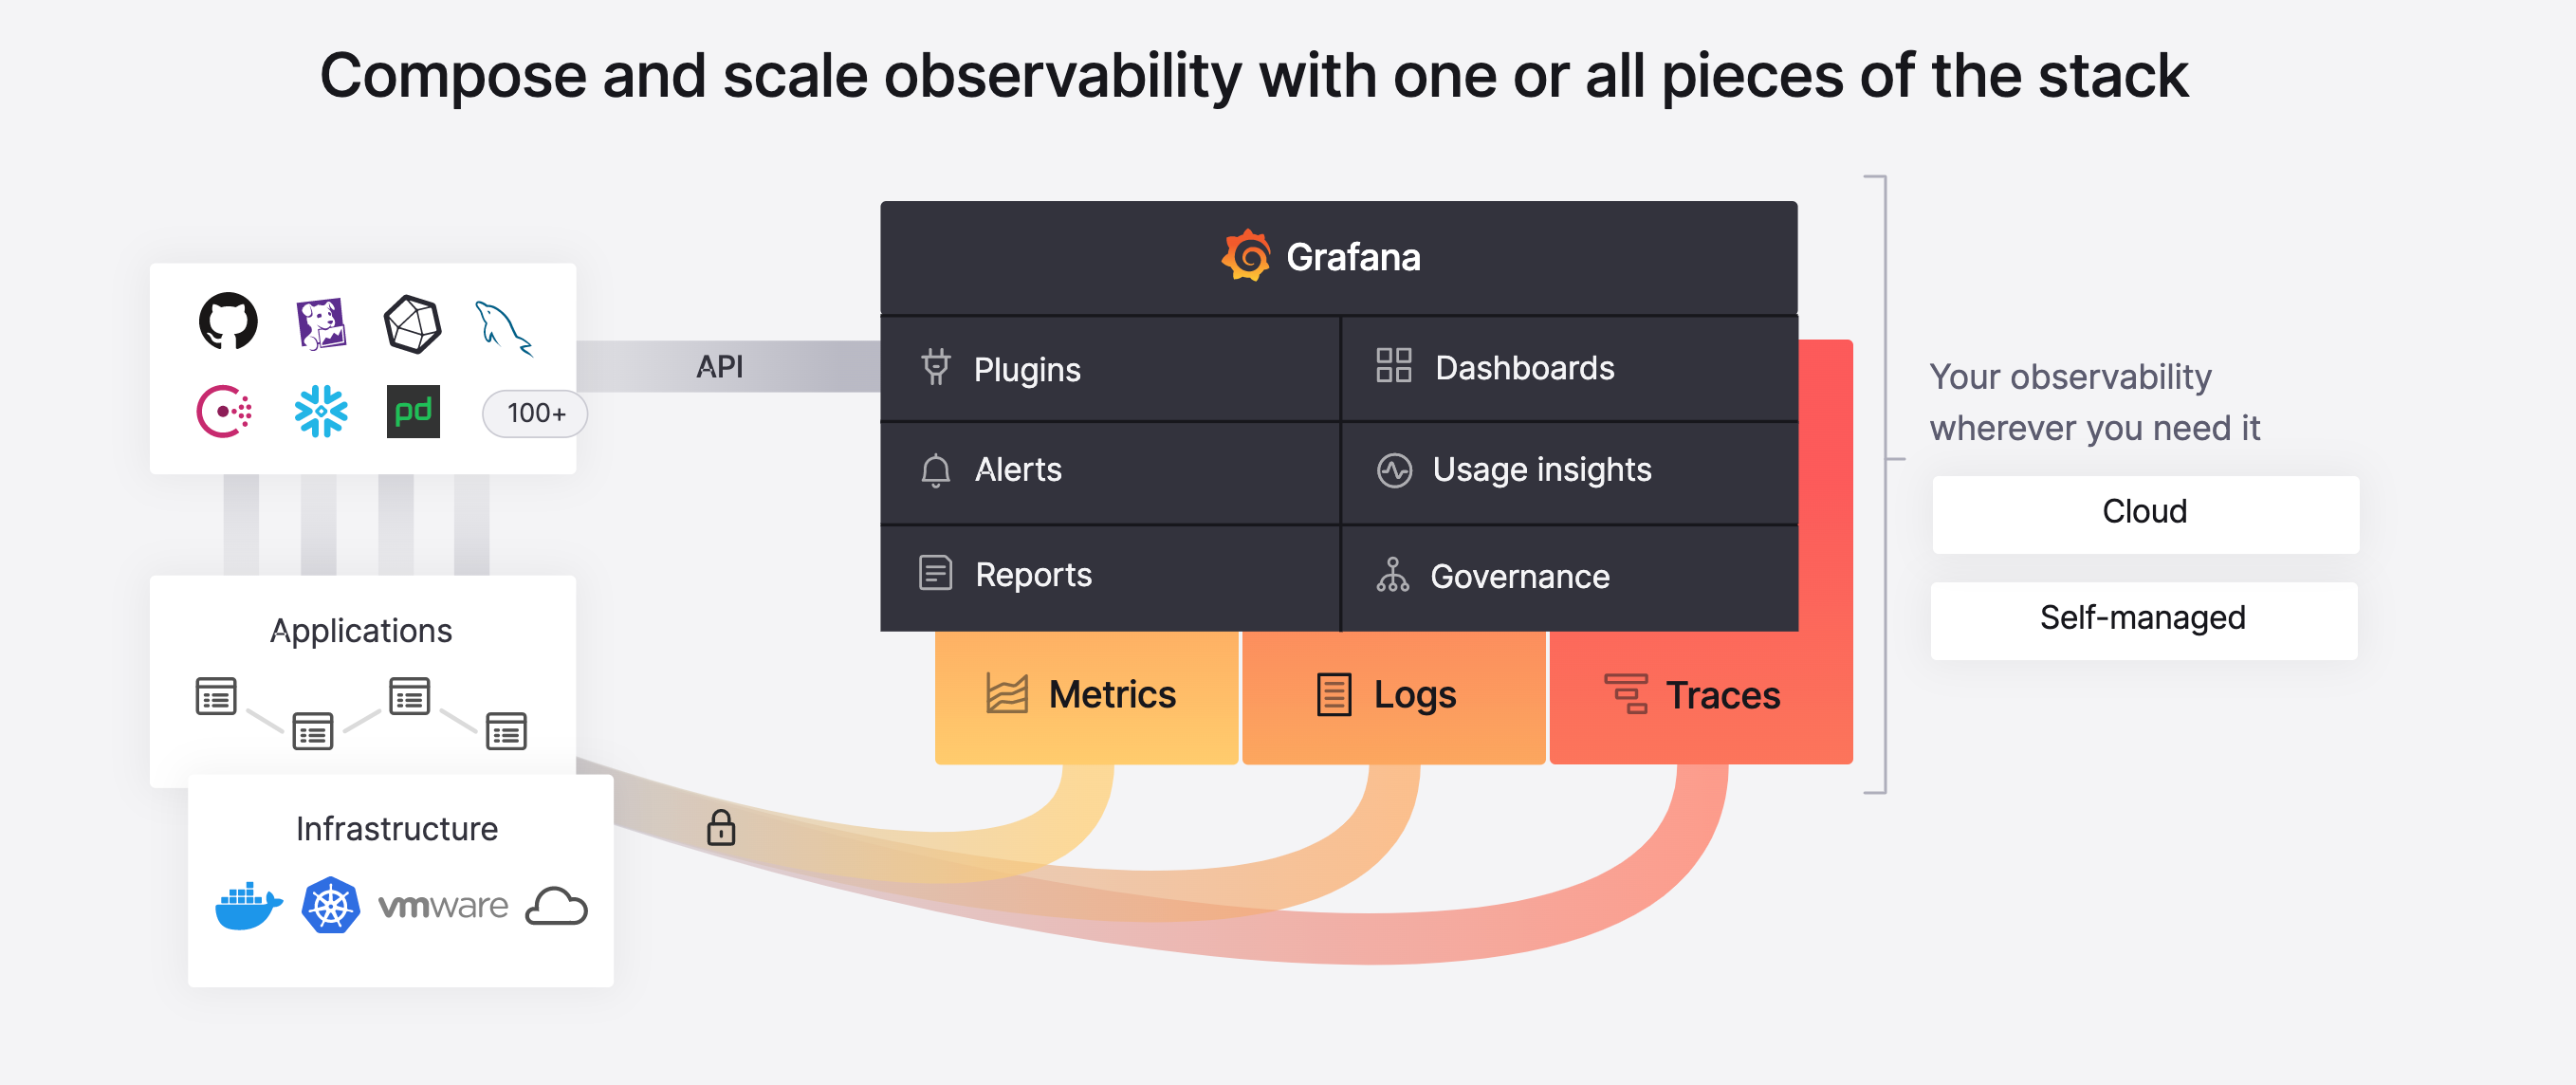
Grafana plugins allow you to integrate a wide array of data sources, including Prometheus, DataDog, Percona, and Splunk.
Kibana at a high level
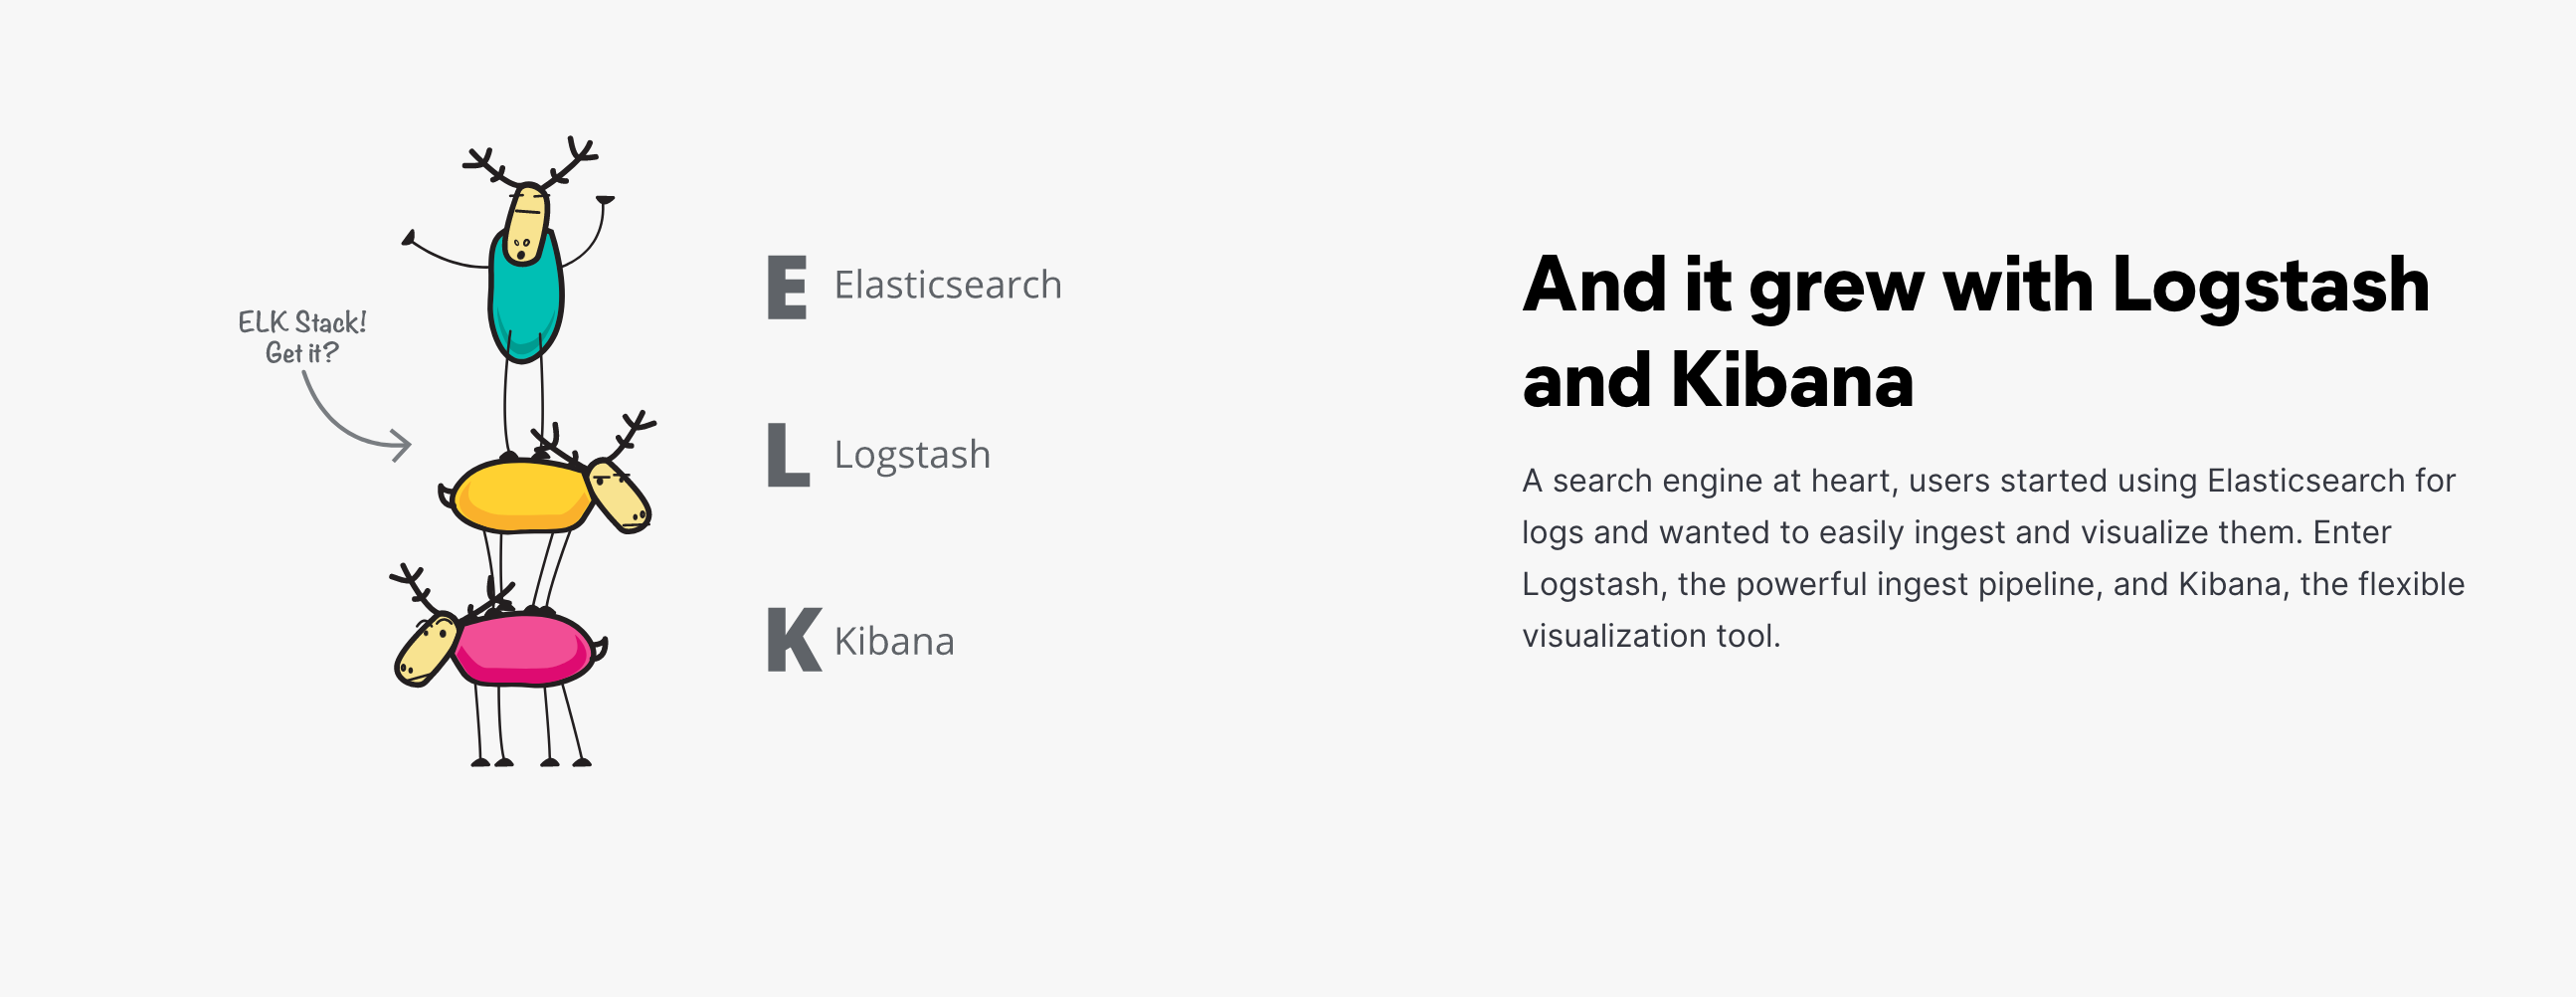
Kibana was developed in 2013 in the ElasticSearch open-source community and serves as an ElasticSearch add-on that enables the visualization of ElasticSearch data from one or more indices.
Kibana allows users to search ElasticSearch indices and display your search results via a number of visualization options. It supports a number of these options—from line graphs to histograms, and even heat maps.
Kibana is often combined with Elasticsearch and Logstash to create the widely known ELK or Elastic Stack for monitoring and observability.
Core benefits
Both Grafana and Kibana are helpful visualization tools, but let’s quickly review some of the core benefits of each so you can decide if one or the other is more appropriate for your organization’s needs.
Grafana benefits
Grafana does not require you to actually ingest data in order to leverage its visualizations. As they put it, Grafana takes the “single-pane-of-glass” approach to aggregate all of your data, no matter where it’s located.
Not only does Grafana allow you to create a dashboard to visualize your data, but it allows you to share these dashboards across your organization for collaboration with data analysis. Grafana also includes a number of pre-built dashboards created by the Grafana community. These dashboards offer you a way to quickly visualize your data without having to create your own.
Finally, Grafana allows you to transform and translate your data into highly customizable visualizations so you can be sure you’re getting the insight that’s most relevant to you and your teams.
Kibana benefits
Kibana allows you to visualize your Elasticsearch data in a number of ways. Kibana Lens, for example, makes the creation of data visualizations easy with its drag-and-drop user interface.

Geospatial analysis is a key feature of Kibana’s visualization capabilities—you can easily identify the location of events happening inside your infrastructure.
Kibana also offers a number of pre-built dashboards, allowing you to quickly visualize your data. This is possible when the Elastic Stack is used for analyzing logs and metrics, since this is a common data source for Kibana.
Kibana also supports a number of machine learning features that allow it to model your ElasticSearch data’s behavior to show trends and to perform forecasting.
Installation methods
Obviously, you’ll want to use the tools that are the easiest for your team to set up and maintain. So let’s briefly compare the available installation methods for both Grafana and Kibana.
Grafana installation
Grafana is supported on many operating systems: Debian/Ubuntu, RPM-based Linux, and of course macOS and Windows. Their installation documentation states that the minimum required memory is 255 MB, but to support features like server-side image rendering and alerting, you’ll probably require more memory and CPUs.
No matter which Linux OS you’re using, Grafana is most commonly installed using DEB-based or RPM-based packages. You can install Grafana on Windows using the recommended Windows installer or by installing the standalone Windows binary, provided via a compressed .zip file.
You can also install Grafana using their official Docker images. Their documentation also describes a method for installing Grafana on Kubernetes.
Kibana installation
Like Grafana, Kibana is also supported on multiple operating systems, including Windows, macOS, and Linux, both Debian-based or RPM-based. Kibana provides compressed tarballs for Linux installations, but Debian and RPM packages are available as well.
For Windows installs, you’ll use a .zip package. Kibana supports macOS installation via the Homebrew package manager.
Just like Grafana, you can also run Kibana from a Docker container with the official Kibana image from the Elastic Docker Registry.
Alerting capabilities
A monitoring tool is only worth its salt if it can notify you when something has gone awry. Grafana and Kibana use slightly different methods for implementing their respective alerting capabilities.
Alerting in Grafana
Grafana has four main alerting capabilities, including:
- Allowing you to set alerting rules that serve as the criteria to fire off an alert.
- Using contact points, which is a channel for sending notifications when an alerting rule has met its criteria.
- Using notification policies to determine how frequent notifications should be sent.
- Using Silences to indicate when to silence alerts.
Alerting in Kibana
Kibana provides you with a way to define rules to detect unsatisfactory conditions. When those conditions are met, Kibana will trigger the actions that are associated with the condition. These actions often provide connections to third-party services, such as an SMTP connector to provide email notifications.
Dashboards
Both Grafana and Kibana claim to have fully featured and customizable visualization capabilities. Since visualization is the most important feature for both of these tools, let’s quickly review what each of them offer.
Dashboards in Grafana
Grafana makes it easy to creating dashboards with the appropriate data. It uses panels that can be configured to interact with many different data sources, such as Graphite, Prometheus, and InfluxDB.
Dashboards in Kibana
Kibana also supports panel displays inside of its dashboards. You can choose from among several different types of panels to display your ElasticSearch data, such as maps, swim lanes, and charts.
Search
To extract intelligence buried in the massive amounts of data you’ve collected from your infrastructure, you have to have a clear and concise way of querying your data in the first place. So let’s have a look at how Grafana and Kibana compare when it comes to supporting data queries.
Grafana search
Grafana has a number of ways to search across your dashboards. There’s the search bar, of course, which allows you to search both database and file-based dashboards. Grafana also uses stars to bookmark dashboards, a recent view so you can locate the most recently created dashboards, and folders to organize your dashboards. Granfana also supports tagging and filtering.
Kibana search
The latest version of Kibana uses the Kibana Query Language (KQL) for searching Elasticsearch data. For those who decide not to use KQL, Kibana also supports the Lucene query syntax.
Final thoughts
Obviously, both Grafana and Kibana have the ability to meet your data analysis and data visualization needs. The tool that your organization ultimately uses depends heavily on which product fits best within your environments. Kibana serves as a browser-based analytics and query dashboard specifically for Elasticsearch consumers. Grafana allows you to query, analyze, and visualize your data, even with mixed data sources. Grafana is often coupled with a time-series database product, such as Graphite or Prometheus, to conduct metrics analysis. Kibana, on the other hand, is part of the famous ELK stack: a comprehensive solution widely used for log data analysis.
In some cases, you may even find organizations that leverage both products for a full suite of monitoring and observability capabilities.
If you're looking to utilize a third-party, maintenance-free platform for monitoring and observing your applications, then Airplane is a good solution for you. With Airplane, you can use code to build custom workflows and UIs within minutes. Build internal tools for all of your engineering workflows easily. Airplane also offers strong out-of-the-box capabilities, such as job scheduling, audit logs, notifications, and more.
To build your first internal workflow using Airplane, sign up for a free account or book a demo.


