


Originally released in 2014, Grafana is an open-source platform for visualization. Created by Torkel Ödegaard, the platform has been a popular choice for developers looking to visualize data from time-series databases like Prometheus.
In recent years, Grafana’s feature set and capabilities have grown. Today, Grafana offers a number of toolsets including visualization, alerting, logging, tracing, paging, and load testing. Grafana is commonly used by nascent startups as a quick and easy way to get started with monitoring and observability. Grafana is also used by many of the largest corporations, like JP Morgan and PayPal, because of its flexibility and ability to scale.
While Grafana is an amazing tool, there are a number of alternatives to consider. In this article, we explore six unique alternatives in-depth, as well as provide a quick list of other alternatives you might want to consider.
- Datadog, An Alternative for Large Enterprise
- PagerDuty, An Alternative to Grafana OnCall
- Speedscale, An Alternative to Grafana K6s
- Splunk, An Alternative for Synthetic Monitoring
- Logz.io Hosted ELK, An Alternative to Grafana’s Loki
Datadog: An alternative for large enterprise
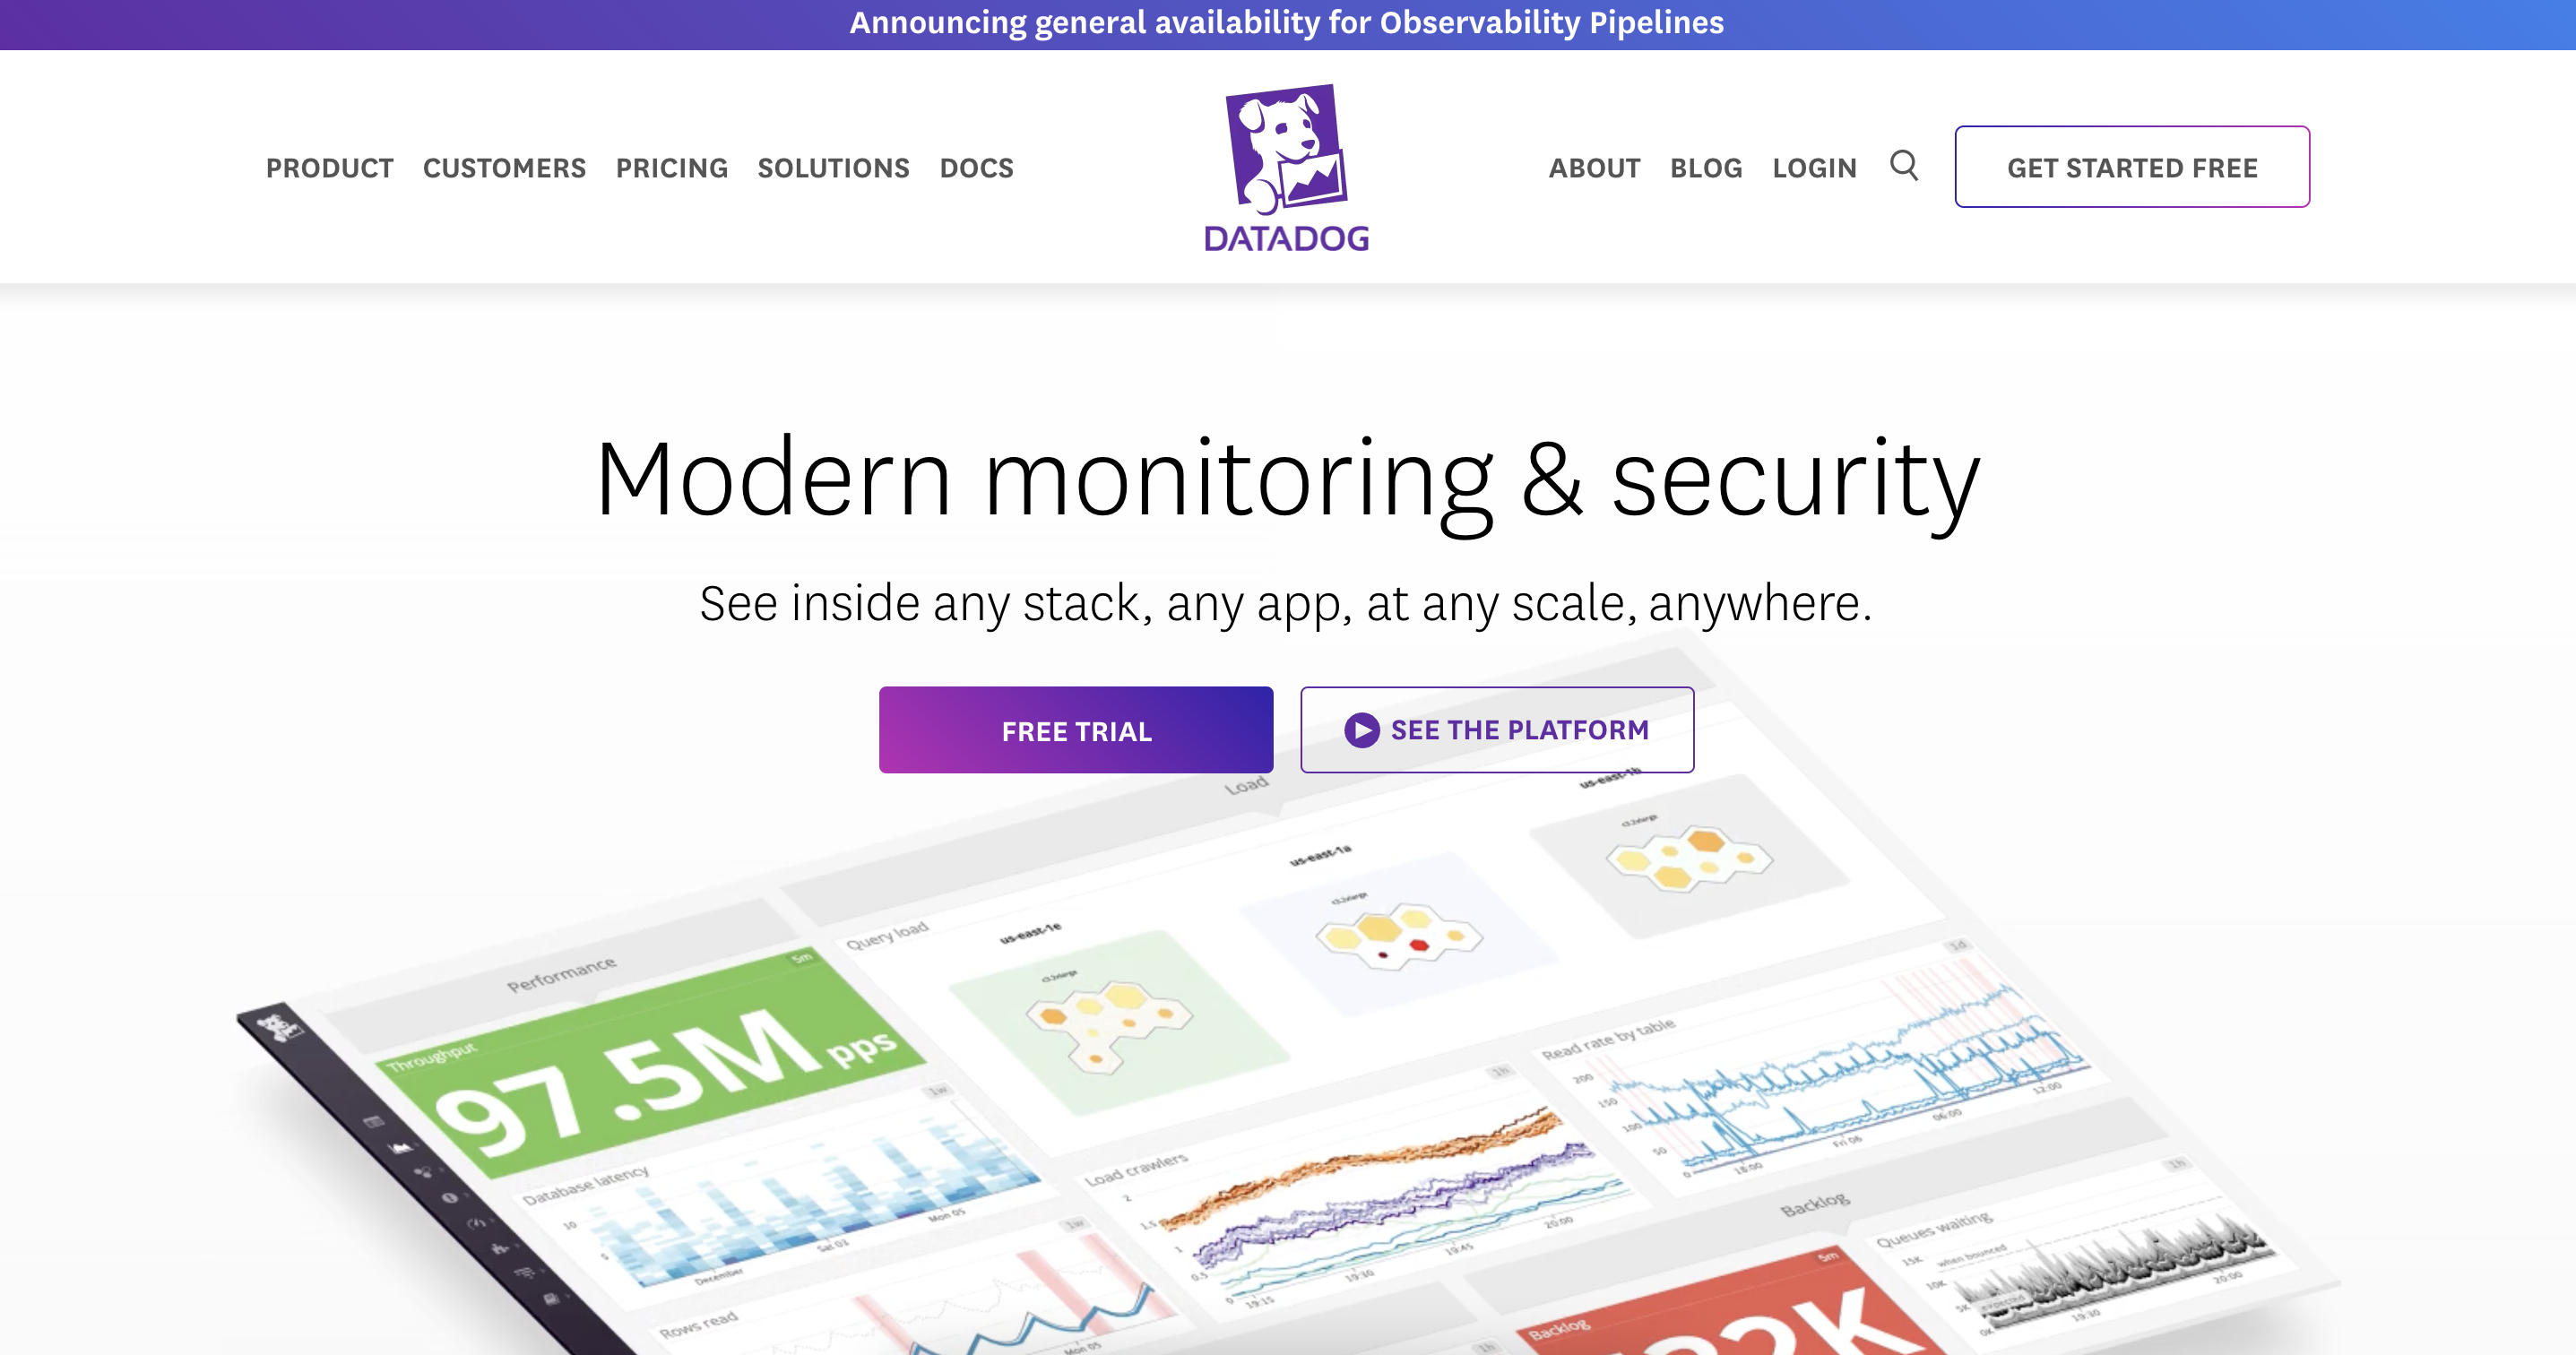
For large enterprises, Grafana’s Enterprise offers an incredible number of features and functionality including Enterprise Logs, Enterprise Metrics, and Enterprise Traces. Grafana also offers scalability guarantees, security, and authentication, as well as support.
Datadog, founded in 2010, is often compared to Grafana as a solution for large enterprises. Datadog counts many of the largest companies as customers including Verizon, Siemens, and Roblox.
Datadog offers a large number of features including logs, metrics, and traces. The company’s Enterprise plan is $23 per host per month when billed annually, with discounts available for companies using over 500 hosts. Datadog’s pricing is very much a la cart, where companies pick and choose additional features to include on top of the base pricing. For example, Datadog’s APM & Continuous Profiler features cost $40 / per service per month.
Datadog uses a variable and usage-based pricing model. Similar to Grafana, Datadog charges based on log ingest, per metrics, and per trace GB. Datadog charges $0.10 per GB of logs ingested with an additional charge for retention based on the period of retention.
Datadog has a self-service offering with a free trial available. But to learn more about the suite of tools they offer it likely makes sense to do a formal demo with a member of Datadog’s enterprise sales team.
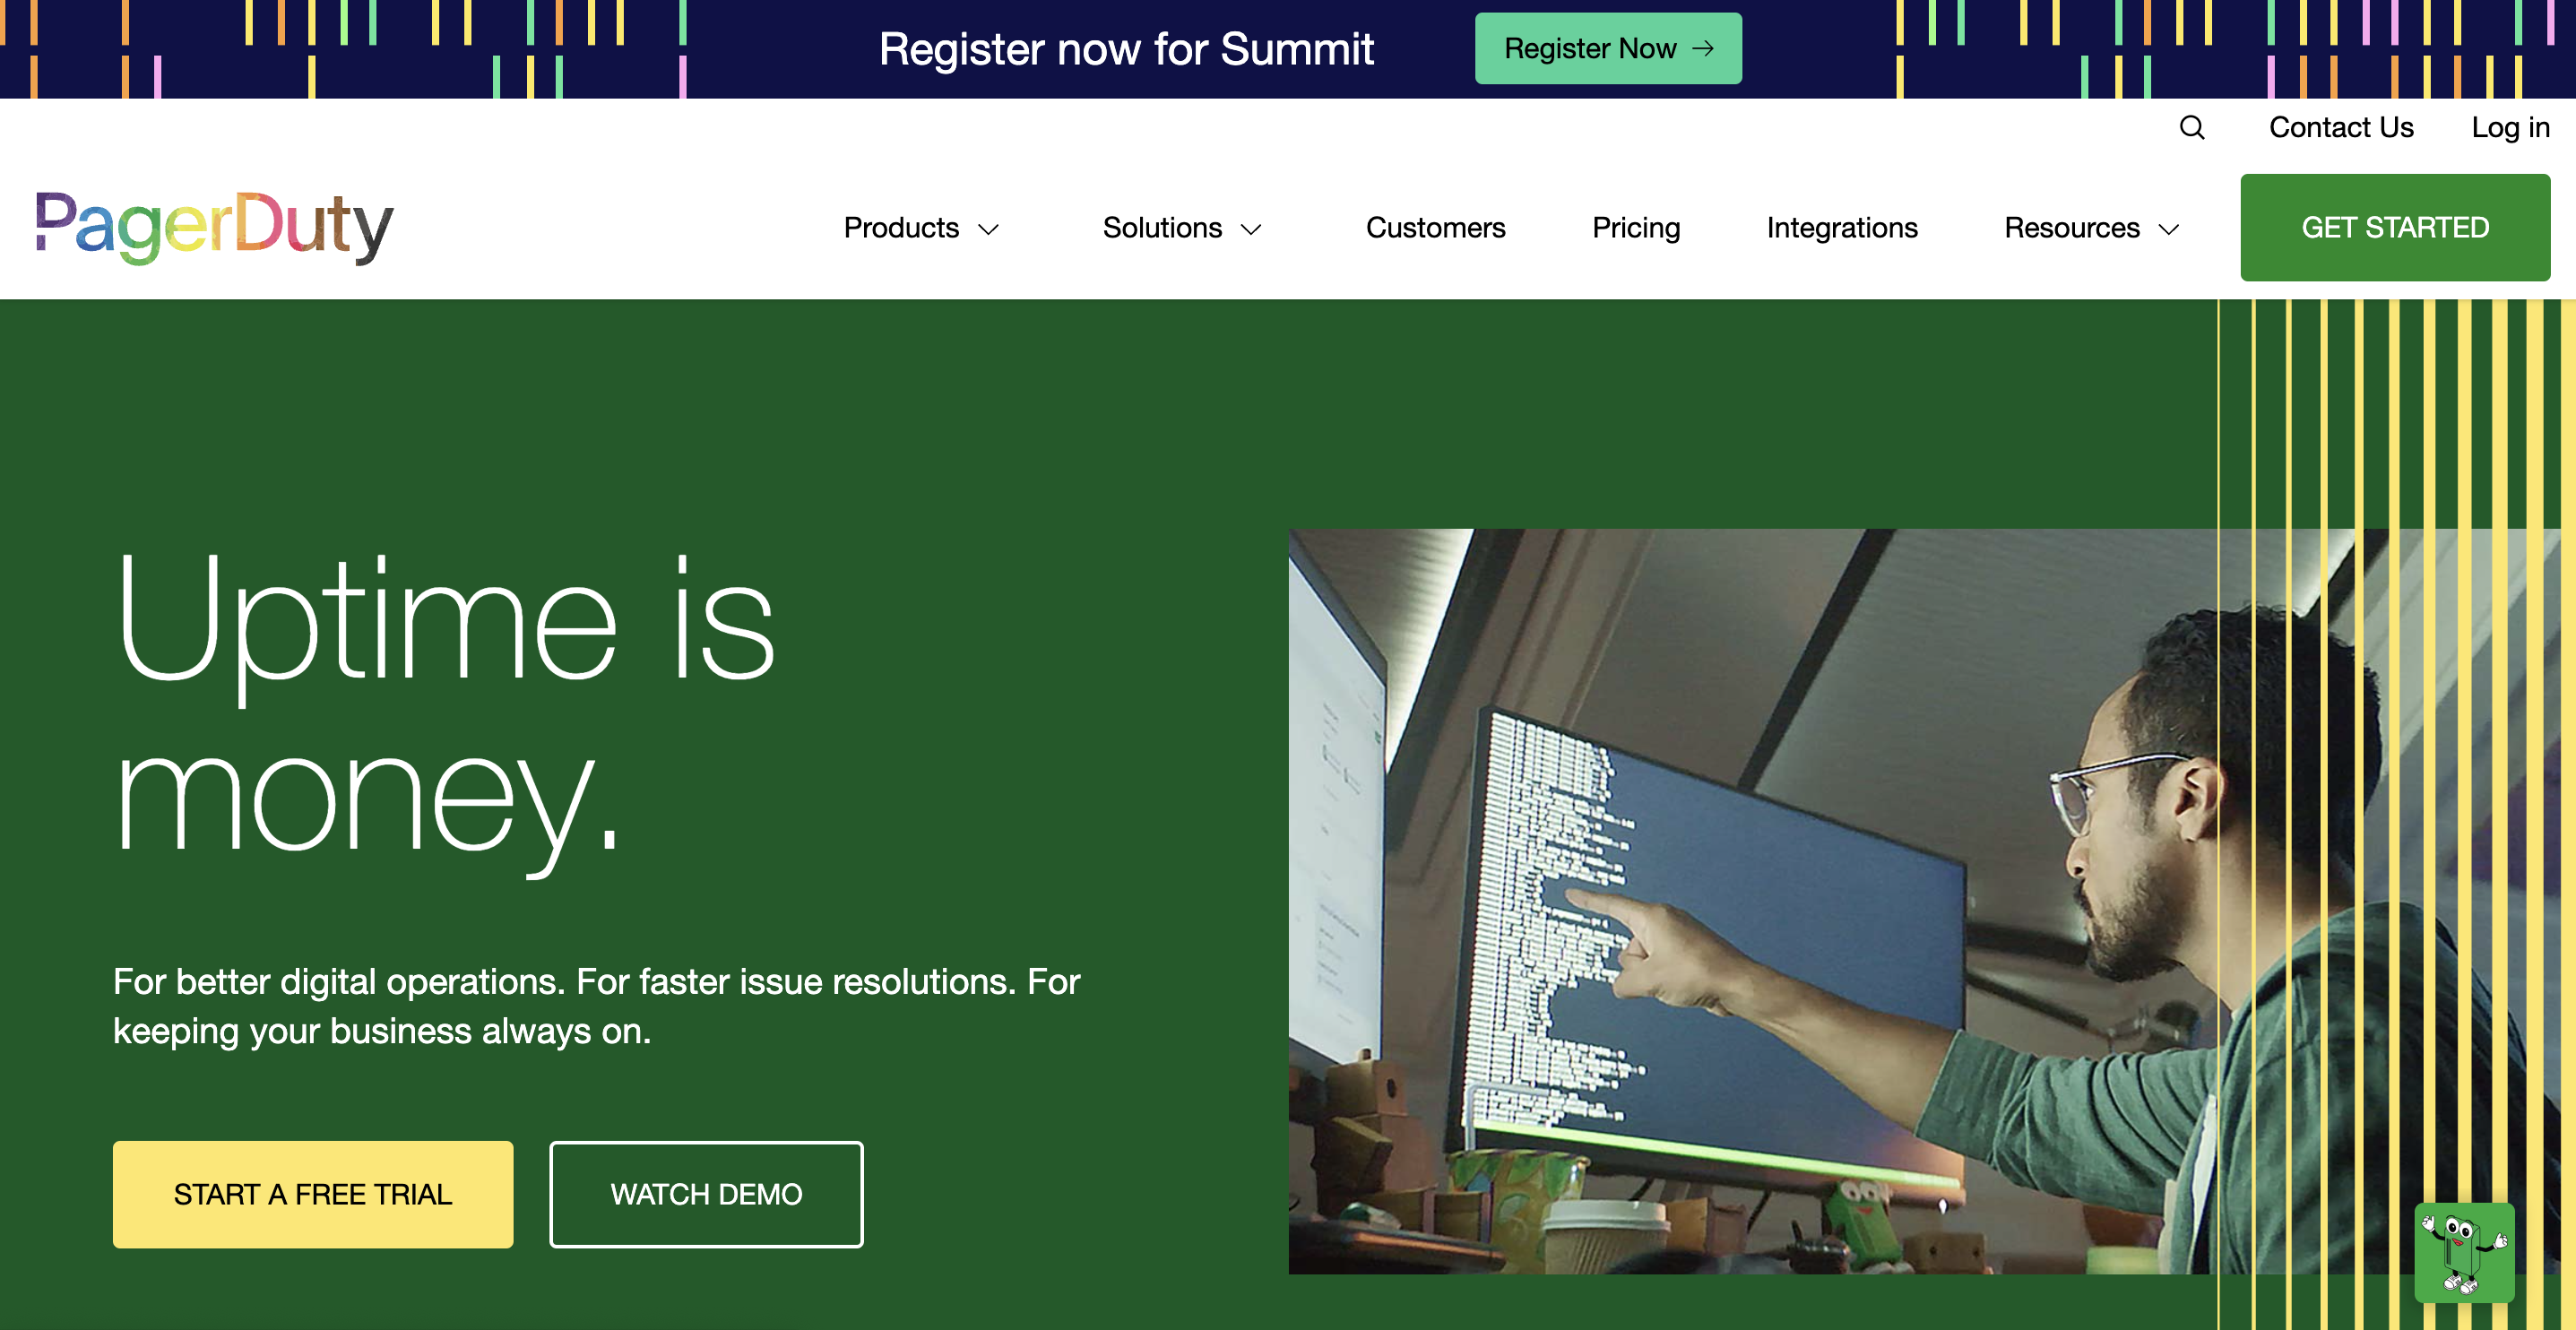
Pagerduty: An alternative to Grafana oncall
As the size of the engineering team grows, implementing an on-call management tool becomes crucial to the health of the organization.
In November 2021, Grafana launched OnCall, their take on on-call management providing workflows for engineering teams to resolve issues faster. While there are many benefits of using Grafana’s OnCall product, many engineering teams use PagerDuty instead.
PagerDuty has specialized in on-call management and tooling since the company was founded in 2009. For over a decade, PagerDuty has helped engineering teams schedule, communicate, and resolve technical issues faster.
PagerDuty offers four Incident Response plans to choose from Free, Professional ($21 per user per month), Business ($41 per user per month), and Digital Operations (call for a quote)
PagerDuty also offers a number of add-ons and additional series for AIOps, Process Automation, and Business Operations. For example, users are able to use the Business Operations customer service feature to alert customer service teams to technical issues or outages automatically.
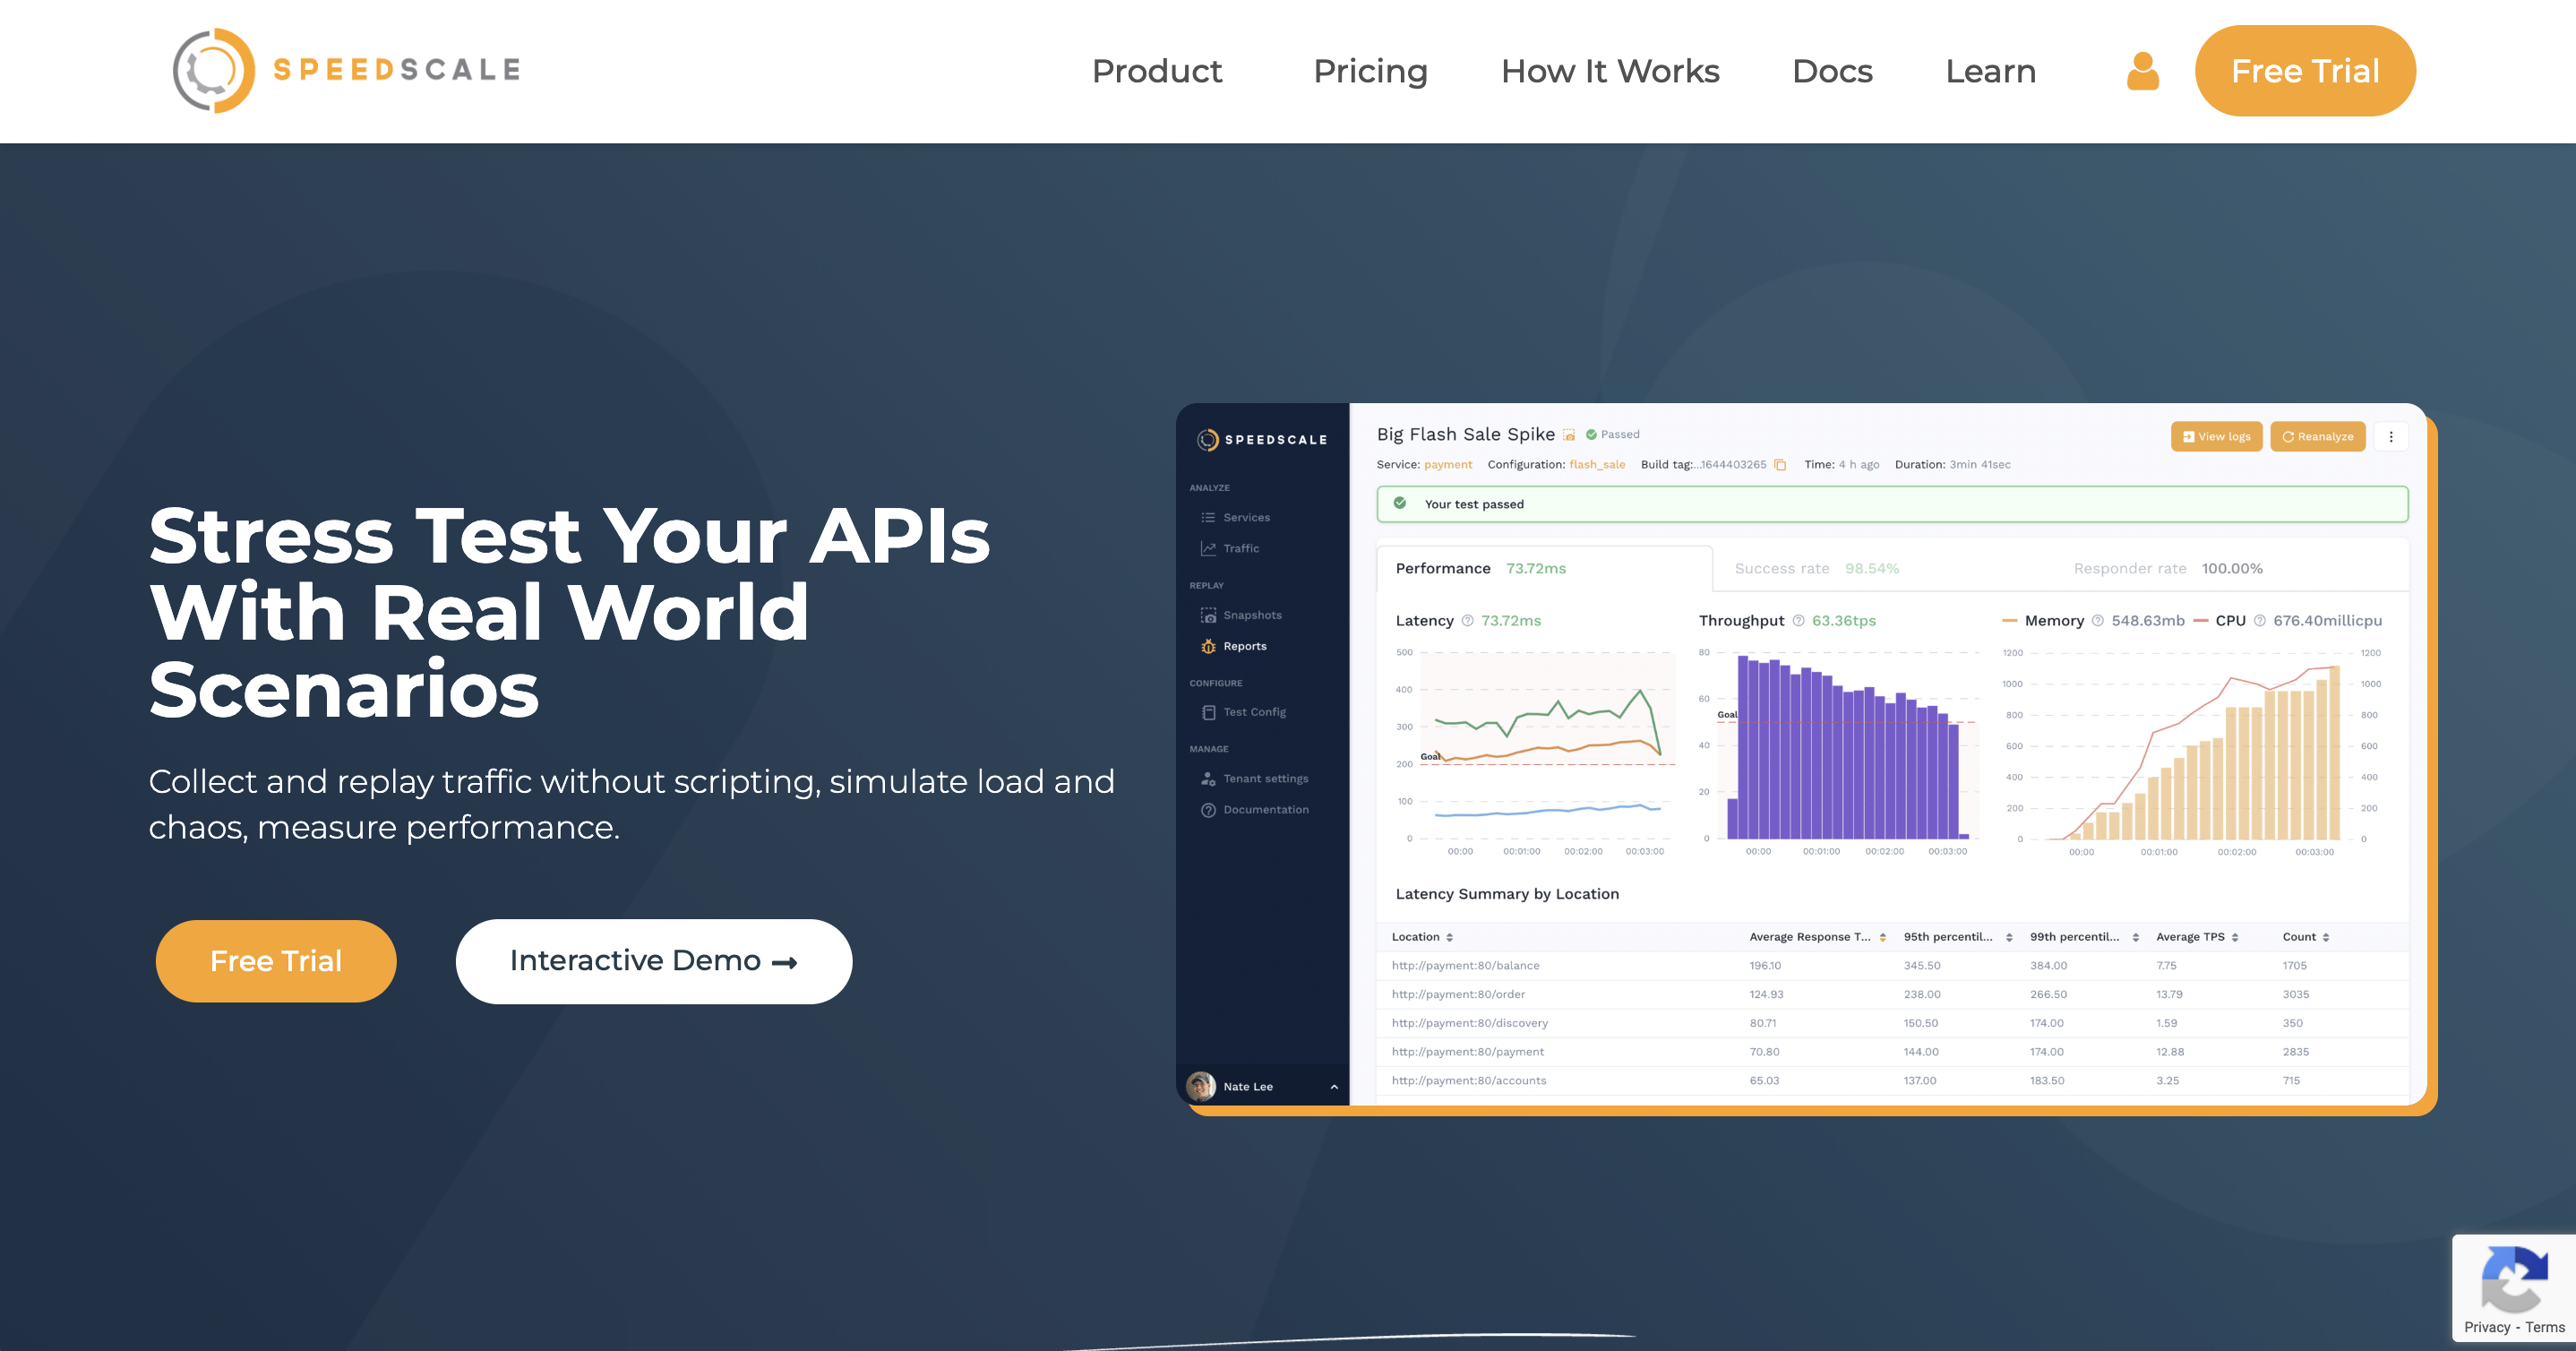
Speedscale: An alternative to Grafana K6s
In June 2021, Grafana acquired K6, an open-source and SaaS offering for load testing. Today, Grafana promotes K6 on its homepage, although users are still directed to the standalone K6 website and onboarding. K6s offers two plans for users to choose from, Open Source, and Cloud
Load testing solves a difficult set of problems. It is hard for engineering teams to know exactly how their applications and infrastructure will perform under significant load. This is where a tool like K6 can be extremely useful. While K6 is becoming a popular solution for load testing, there are a number of alternatives to consider. One alternative is Speedscale, a company that is also focused on load testing.
Speedscale offers teams a number of features for collecting and replaying traffic, measuring performance, and creating a simulated environment of chaos. Speedscale, like K6, has a number of integrations with the tools you may already use like Datadog, Grafana, and more.
Speedscale has three different plans available including Free, Pro, and Enterprise. The company’s free plan can be accessed from GitHub directly, whereas the company’s two paid plans can be accessed via registration and a free trial. The Pro plan is $500 per month, and Enterprise plans pricing is not currently displayed.
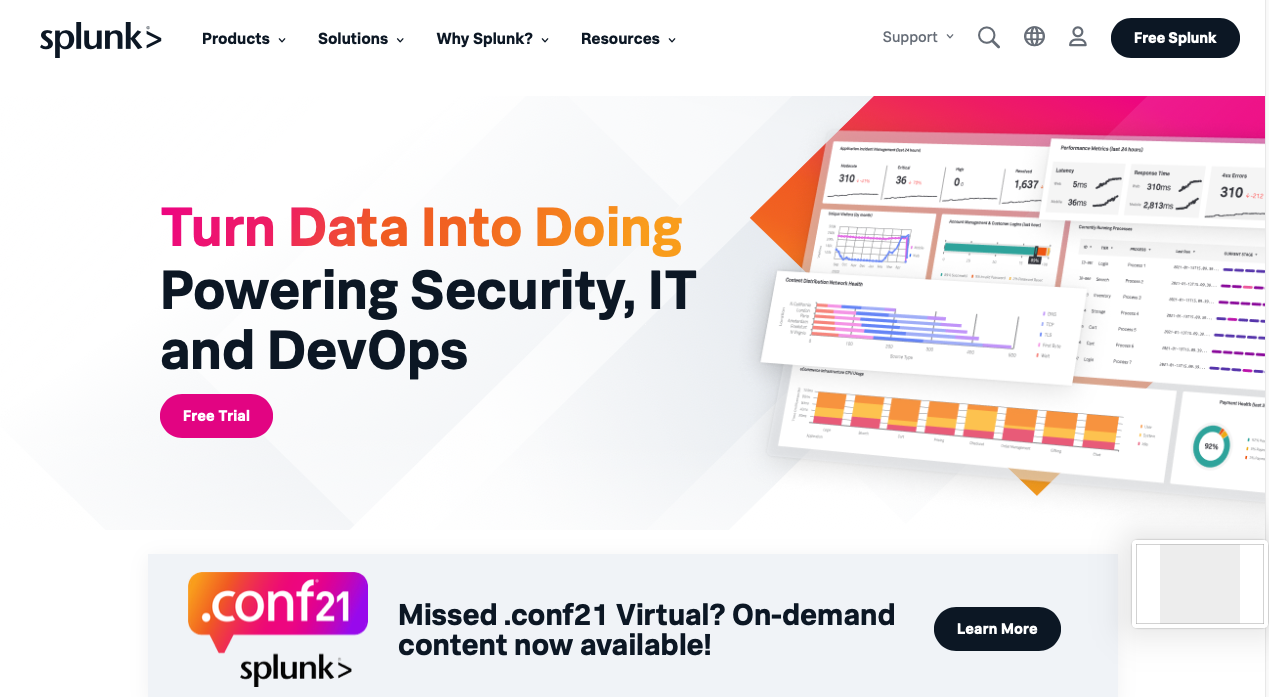
Splunk: An alternative for synthetic monitoring
Synthetic monitoring is helpful for teams looking to gather information and perspective on how their applications are performing from an external lens. Grafana offers a synthetic monitoring feature set via Grafana Cloud. Users are able to create tests to continually check the availability and performance of services. And if using Grafana’s metrics and logging feature sets, Prometheus and Loki, respectively, users are able to view this data as the tests are performed.
While Grafana’s synthetic monitoring toolset is helpful, you might be interested in comparing it to Splunk’s synthetic monitoring offering. Splunk has a comprehensive feature set and offers synthetic monitoring. Included, Splunk allows users to monitor and alert on end-user performance metrics. Additionally, Splunk makes it easy to optimize and improve end-user journeys with over 300 default recommendations.
One of the more interesting features is known as benchmarking, which allows you to compare the performance of your services vs. competitors or others in your industry. There are also a number of integrations available like PagerDuty and Slack, which can be helpful for teams who need to alert and notify areas when performance changes.
Splunk, like Grafana Cloud, offers a free trial for users to test their synthetic monitoring feature set. You can sign-up for a free 14-day trial, without a credit card, by using the sign-up form on the Splunk website.
Logz.io hosted ELK: An alternative to Grafana’s Loki
Grafana’s Loki feature set is undoubtedly powerful and complementary to Grafana’s entire offering. However, many companies would prefer to approach logging with the ELK stack.
Logz.io, which was originally launched in 2015, has become a popular toolset for organizations of all sizes. Today, the company is best known for its ELK stack Log Management feature set. If you are using the ELK stack, the popular acronym for Elasticsearch, Logstash, and Kibana, then Logz.io might be a good choice for your log management.
With Logz.io, log collection, analytics, and visualization are easy and cost-effective. The company offers a number of features within its log management toolset including alerting, pattern recognition, and application insights. Logz.io is also very flexible when it comes to short and long-term storage with a number of options available. For example, for the long-term storage of logs, users are able to choose to store logs with S3 at a low price point, and then re-ingest them back to Logz.io in the future, if needed.
To get started with Logz.io, you can sign-up directly on the company’s website. A free trial is available and no credit card is required to test the platform.
Final thoughts
Grafana is an increasingly popular tool and for good reason. Grafana continues to innovate and delivers a comprehensive set of tools. However, Grafana isn’t for everyone. For some companies, Grafana might require too much setup and maintenance. For other companies, Grafana might be too expensive. And for others, Grafana might not have the full set of features they are looking for.
In this article, we highlighted Datadog, PagerDuty, Speedscale, Splunk, and Logz.io as alternatives to each of Grafana’s core offerings.
If you're looking to build a data visualization dashboard quickly, check out Airplane. Airplane is the developer platform for building custom internal tools. You can build Tasks, which are single or multi-step functions, or Views, which are React-based custom UIs. Build customer insight dashboards, admin panels, database issues alert workflows, and more using Airplane.
To build your first metrics dashboard using Views, sign up for a free account or book a demo.


