


When Google partnered with the Linux Foundation in 2015 to form the Cloud Native Computing Foundation (CNCF) and release the code for Kubernetes v1.0, few people foresaw that it would become so successful. Nevertheless, according to the 2020 CNCF Survey, the use of Kubernetes in production has increased from 78% in 2019 to 83% in 2020, reaffirming Kubernetes as the leading open source, container-orchestration platform. The widespread adoption of Kubernetes has created a need for monitoring systems that provide engineering teams with the metrics used to observe Kubernetes clusters proactively.
This article will guide users on how to monitor a Google Kubernetes Engine (GKE) cluster, a managed environment designed by Google to run Kubernetes clusters.
Importance of a GKE monitoring stack
Given the flexibility and scalability of Kubernetes, a monitoring stack is crucial. Monitoring provides you with vital information, allowing you to make informed decisions and alerting you to potential problems. A Kubernetes cluster is incredibly complex and, while you need visibility into application performance and underlying infrastructure metrics to improve its efficiency and prevent problems, it’s difficult to manage this without a monitoring stack.
What exactly do the terms monitoring and metrics refer to? The best way to illustrate the meaning and scope of these terms is through examples.
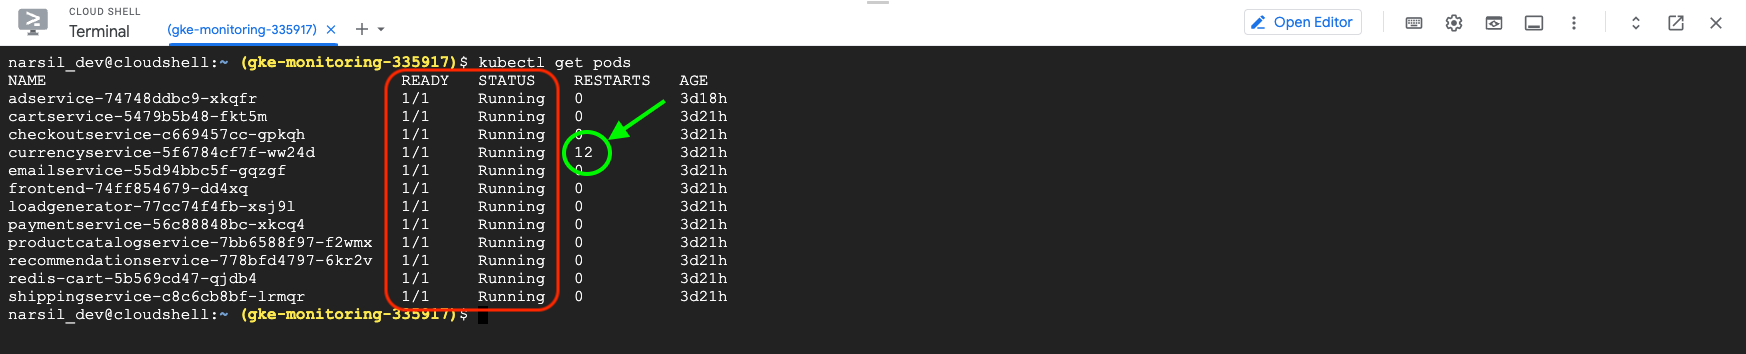
A classic example of monitoring is to collect metrics on the status of resources used by applications to ensure that everything is working as expected. In GKE, a simple way to do this is from the integrated command console, known as Cloud Shell. To check the status of the Pods, you can use the kubectl get pods command.
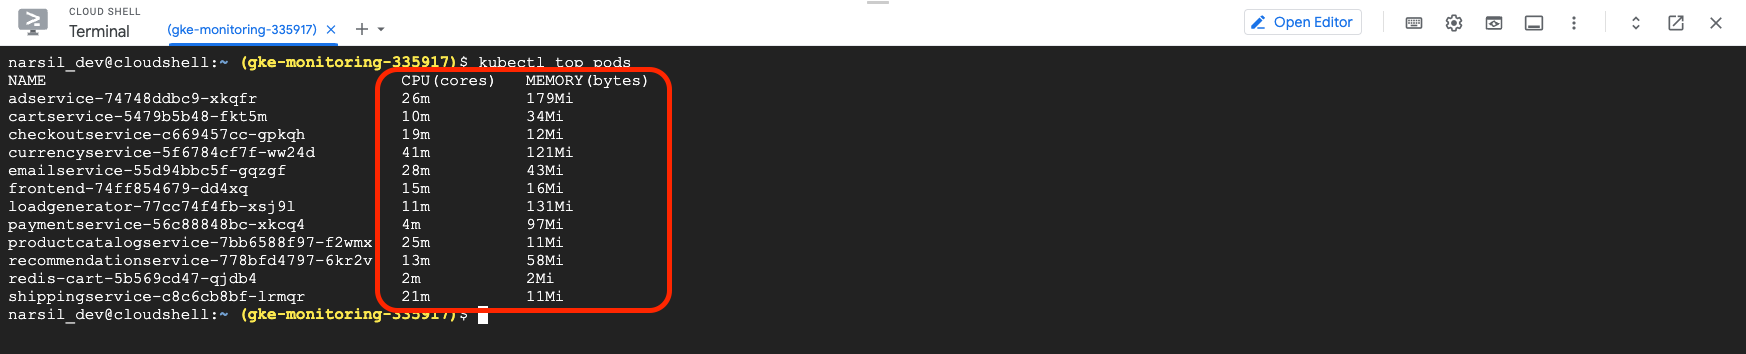
GKE also comes ready with the kubectl top command, which allows you to check the resources used by the Pods using kubectl top pods.
While these metrics are helpful for a quick check, they’re a far cry from a full-featured monitoring solution that collects and displays data in real time. Fortunately, GKE has a monitoring and alert system that shows metrics in real time via a graphic interface.
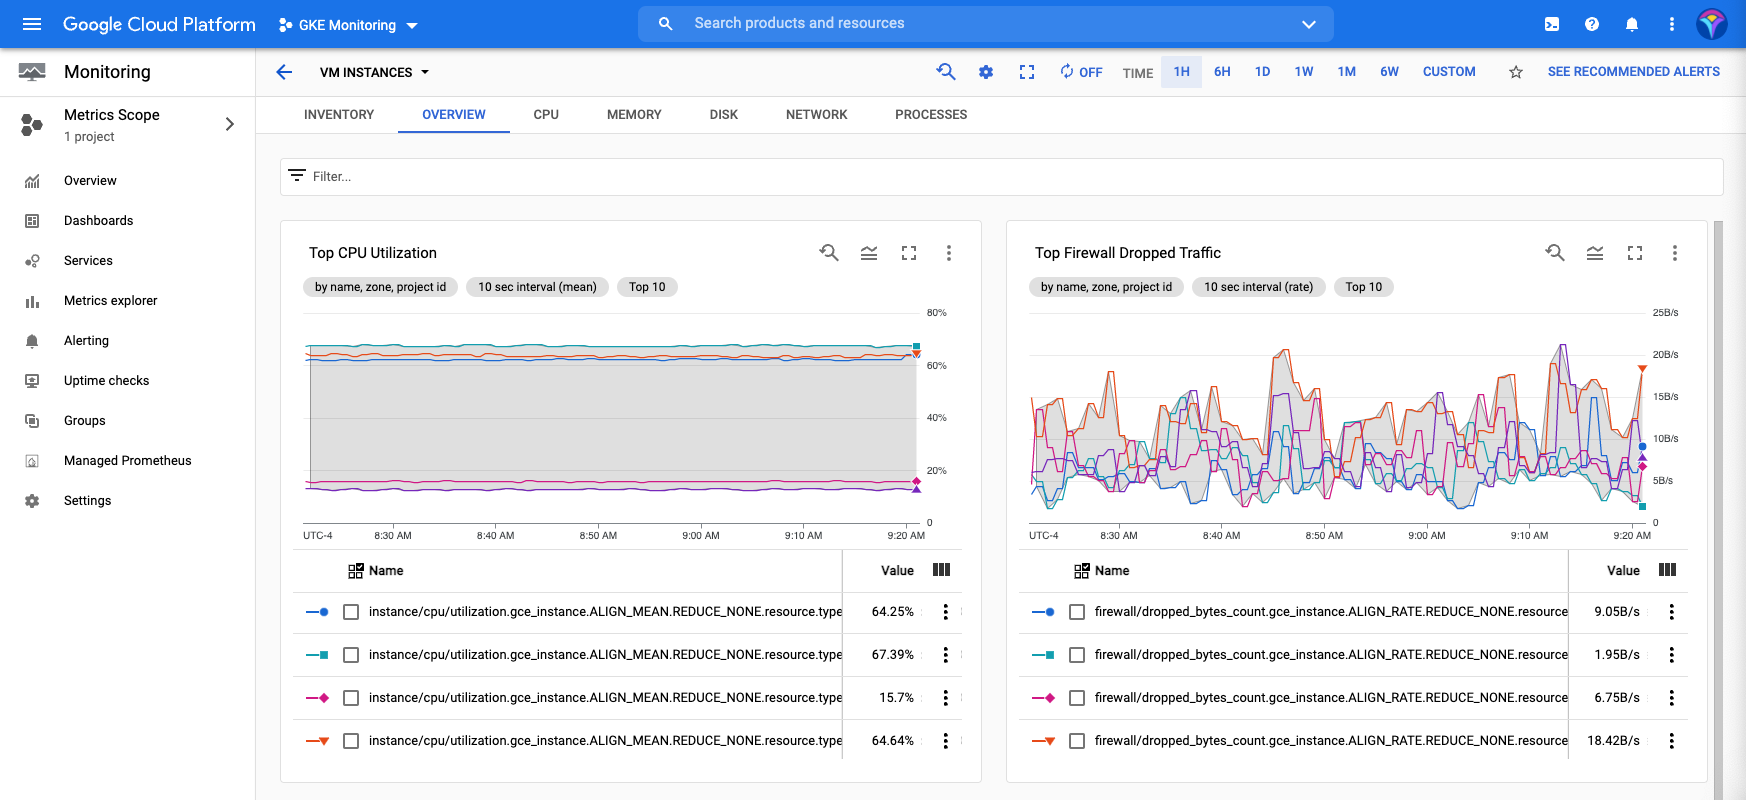
Thanks to GKE Metric Explorer, you can monitor node health, resources used, disk performance, node load, ingress packets per VM, and several other Kubernetes-specific metrics.
These metrics have different use cases—for example, monitoring cluster performance and resource availability are crucial to know if the cluster needs to be scaled up, or if there’s a traffic bottleneck that requires revising the load balancer. In the following section, we’ll take a longer look at the features offered by the monitoring system included in GKE.
GKE built-in monitoring tools
One of the main reasons that GKE is so popular is the number of metrics that can be monitored simply and conveniently. This section will help you understand the monitoring options built into GKE.
Cloud operations for GKE features
Google Cloud's operations suite consists of a group of built-in tools and services to enhance functionality.
Fully managed cloud logging
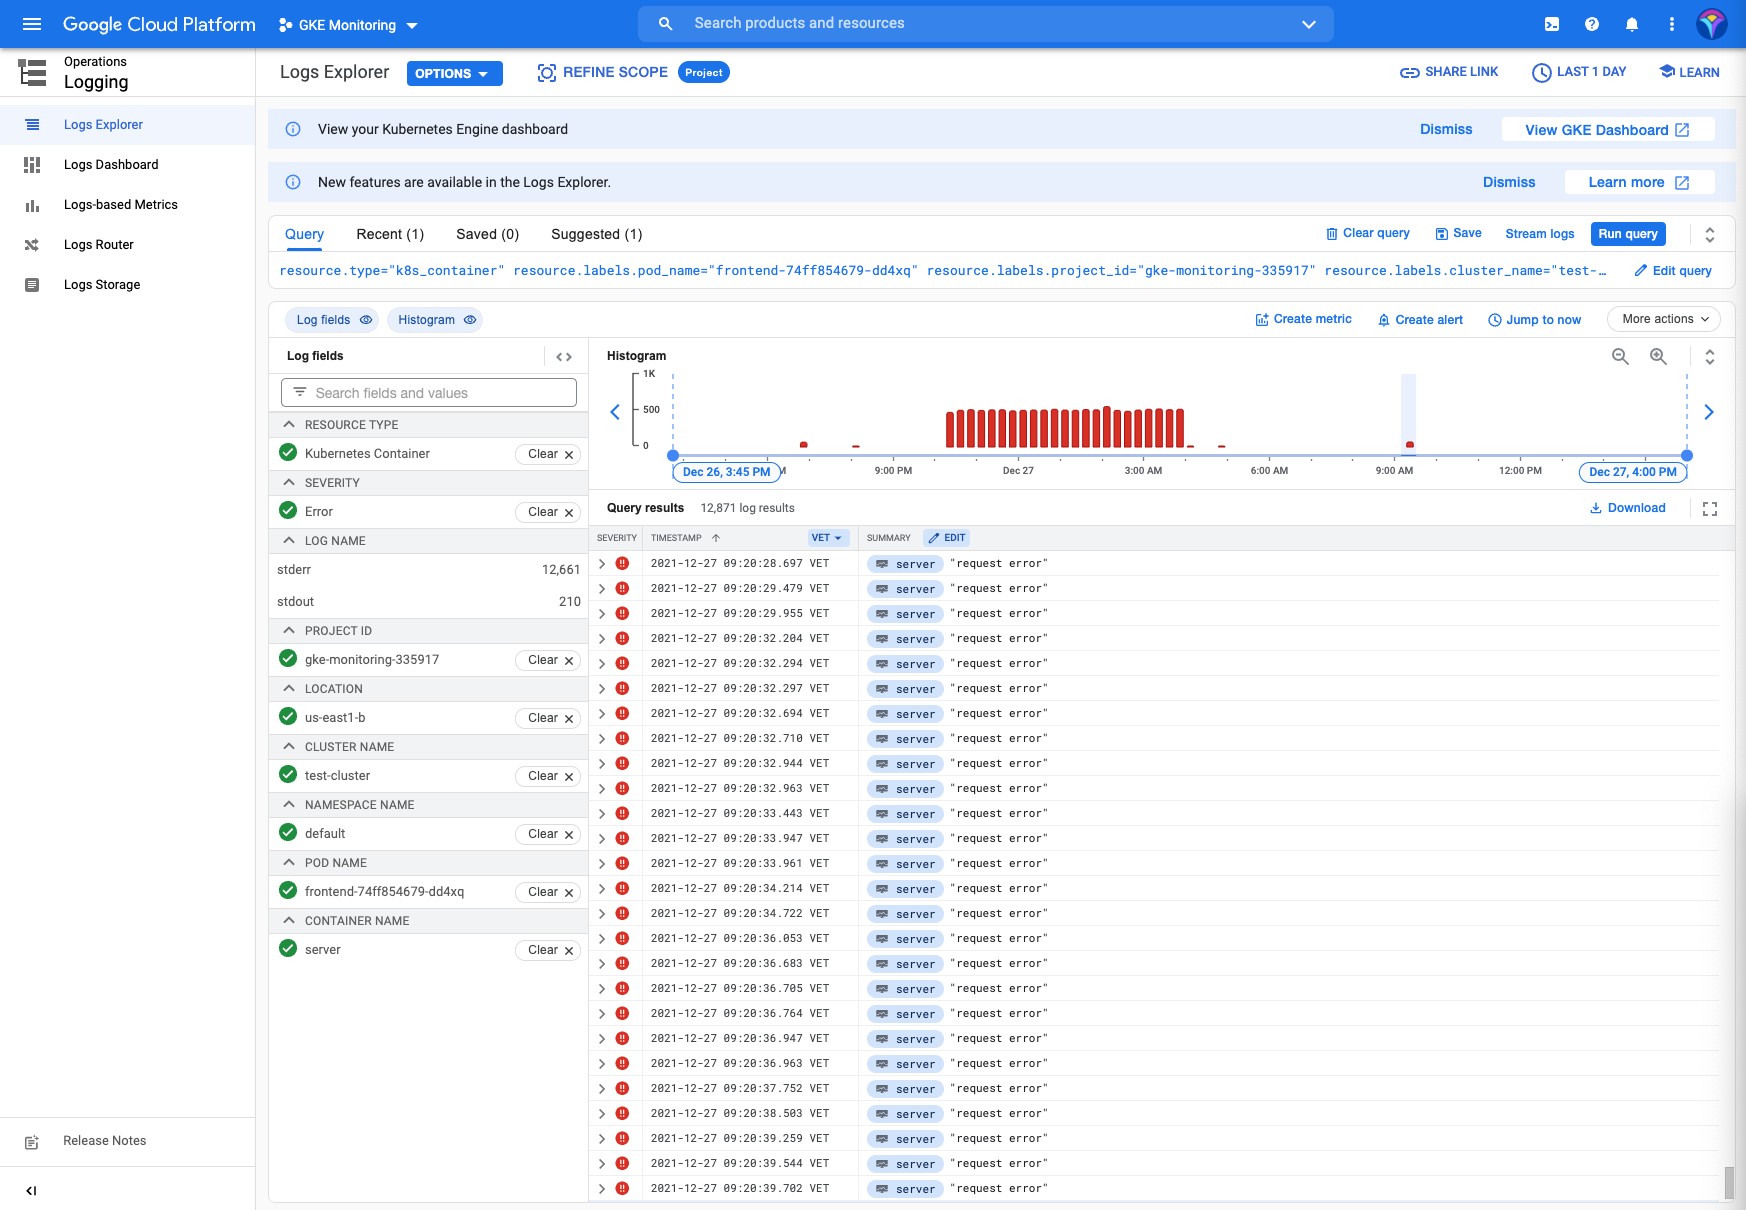
The cornerstone of Google Cloud’s operations suite is its Cloud Logging, which automatically collects logs from all infrastructure and applications running on Google Cloud, including GKE. All the logs obtained by this highly scalable service can be conveniently accessed at any time in the Cloud Console.
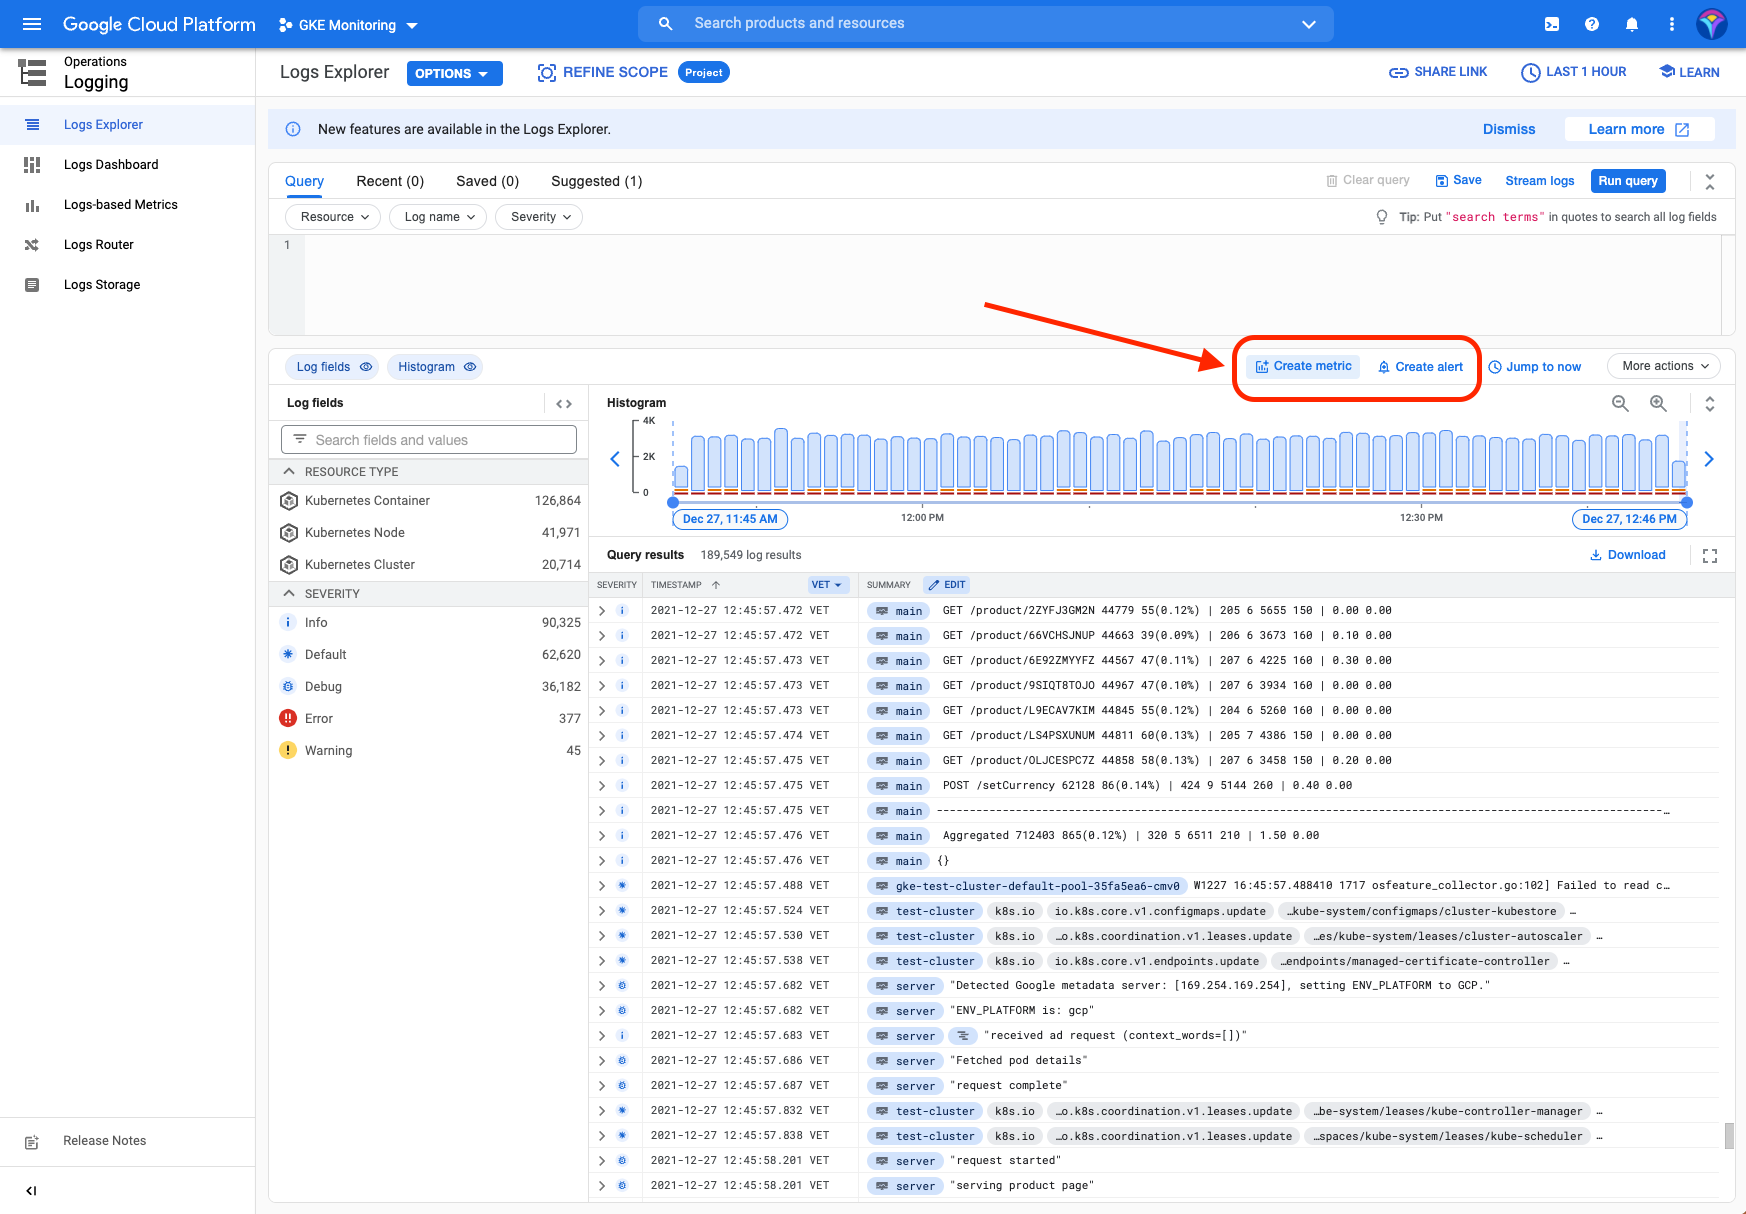
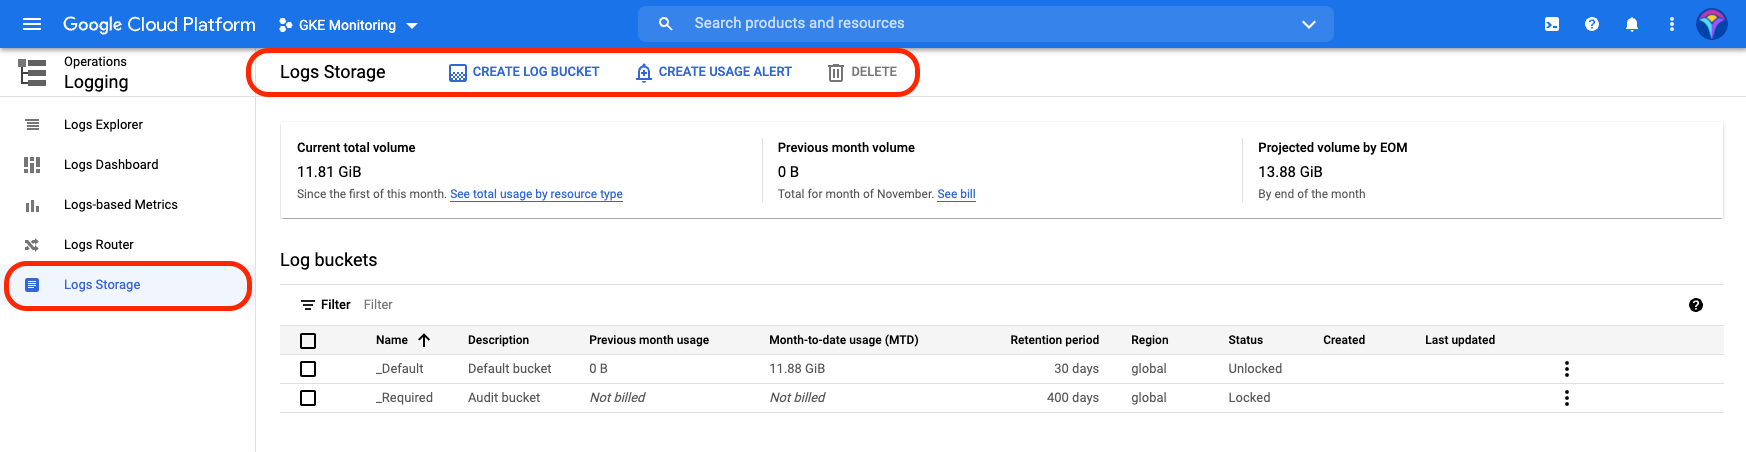
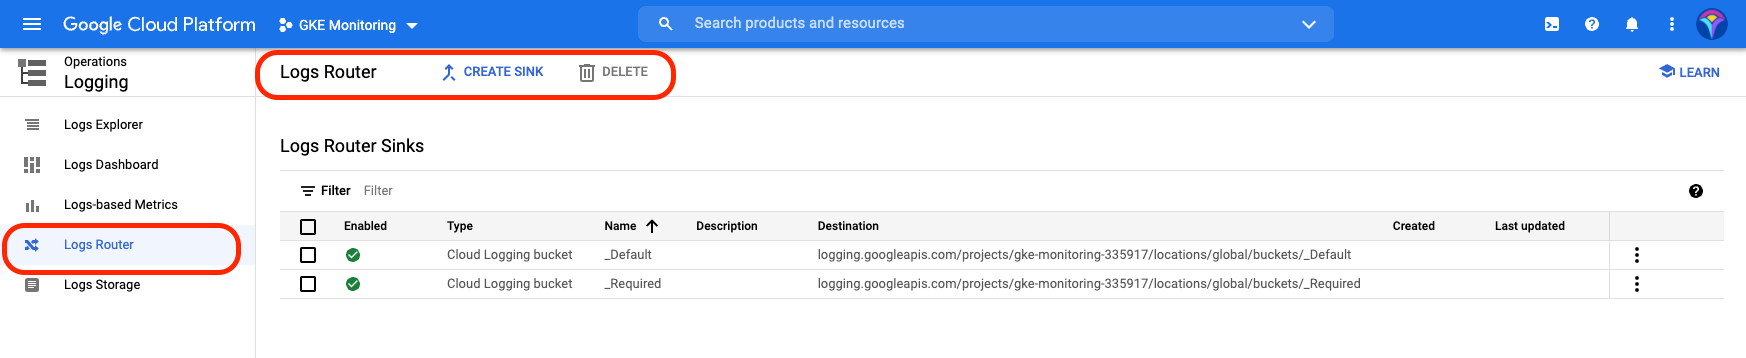
From the Logs Explorer, you can see an overview of the logs, filter the results according to various criteria such as severity, resources, or log name, and even convert results to metrics and log-based alert policies. Moreover, Cloud Logging's flexibility allows you to use the Ops Agent, fluentd, or an API to collect data from custom sources such as applications, on-prem sources, or other clouds. Another advantage of this service is that it allows you to choose where to save the captured logs. This means you’re not limited to storing the logs in GCP Logs Storage—you can also export them to Google Cloud Storage, or stream them via Google Cloud Pub/Sub to any third-party provider.
Another convenient feature of Cloud Logging is the Logs Dashboard, where you can view information such as GKE container errors or GKE container logs as graphs. By hovering the mouse over an area, you can get information from the log, and even analyze it in detail.
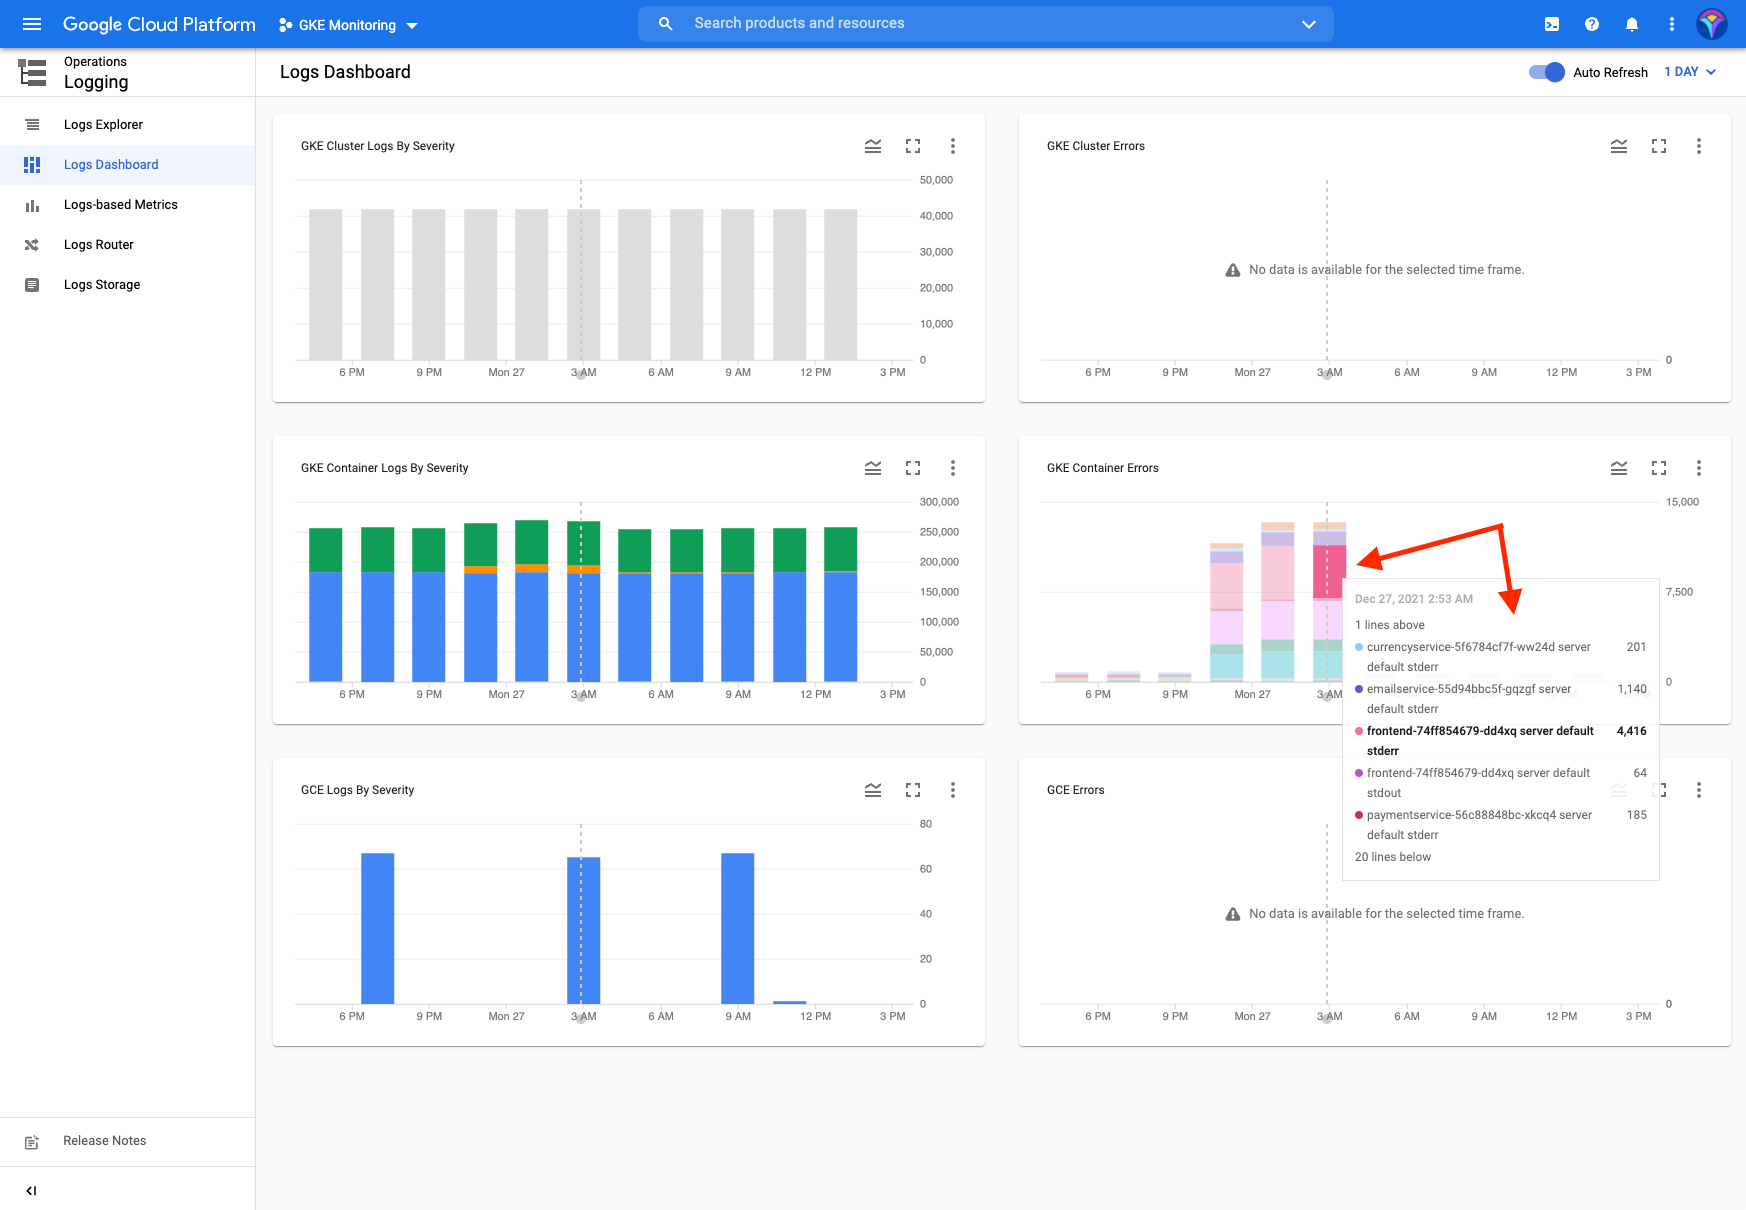
The ease of viewing data and the ability to access logs from all sources in a single place makes Cloud Logging a powerful troubleshooting and analysis tool.
Cloud monitoring
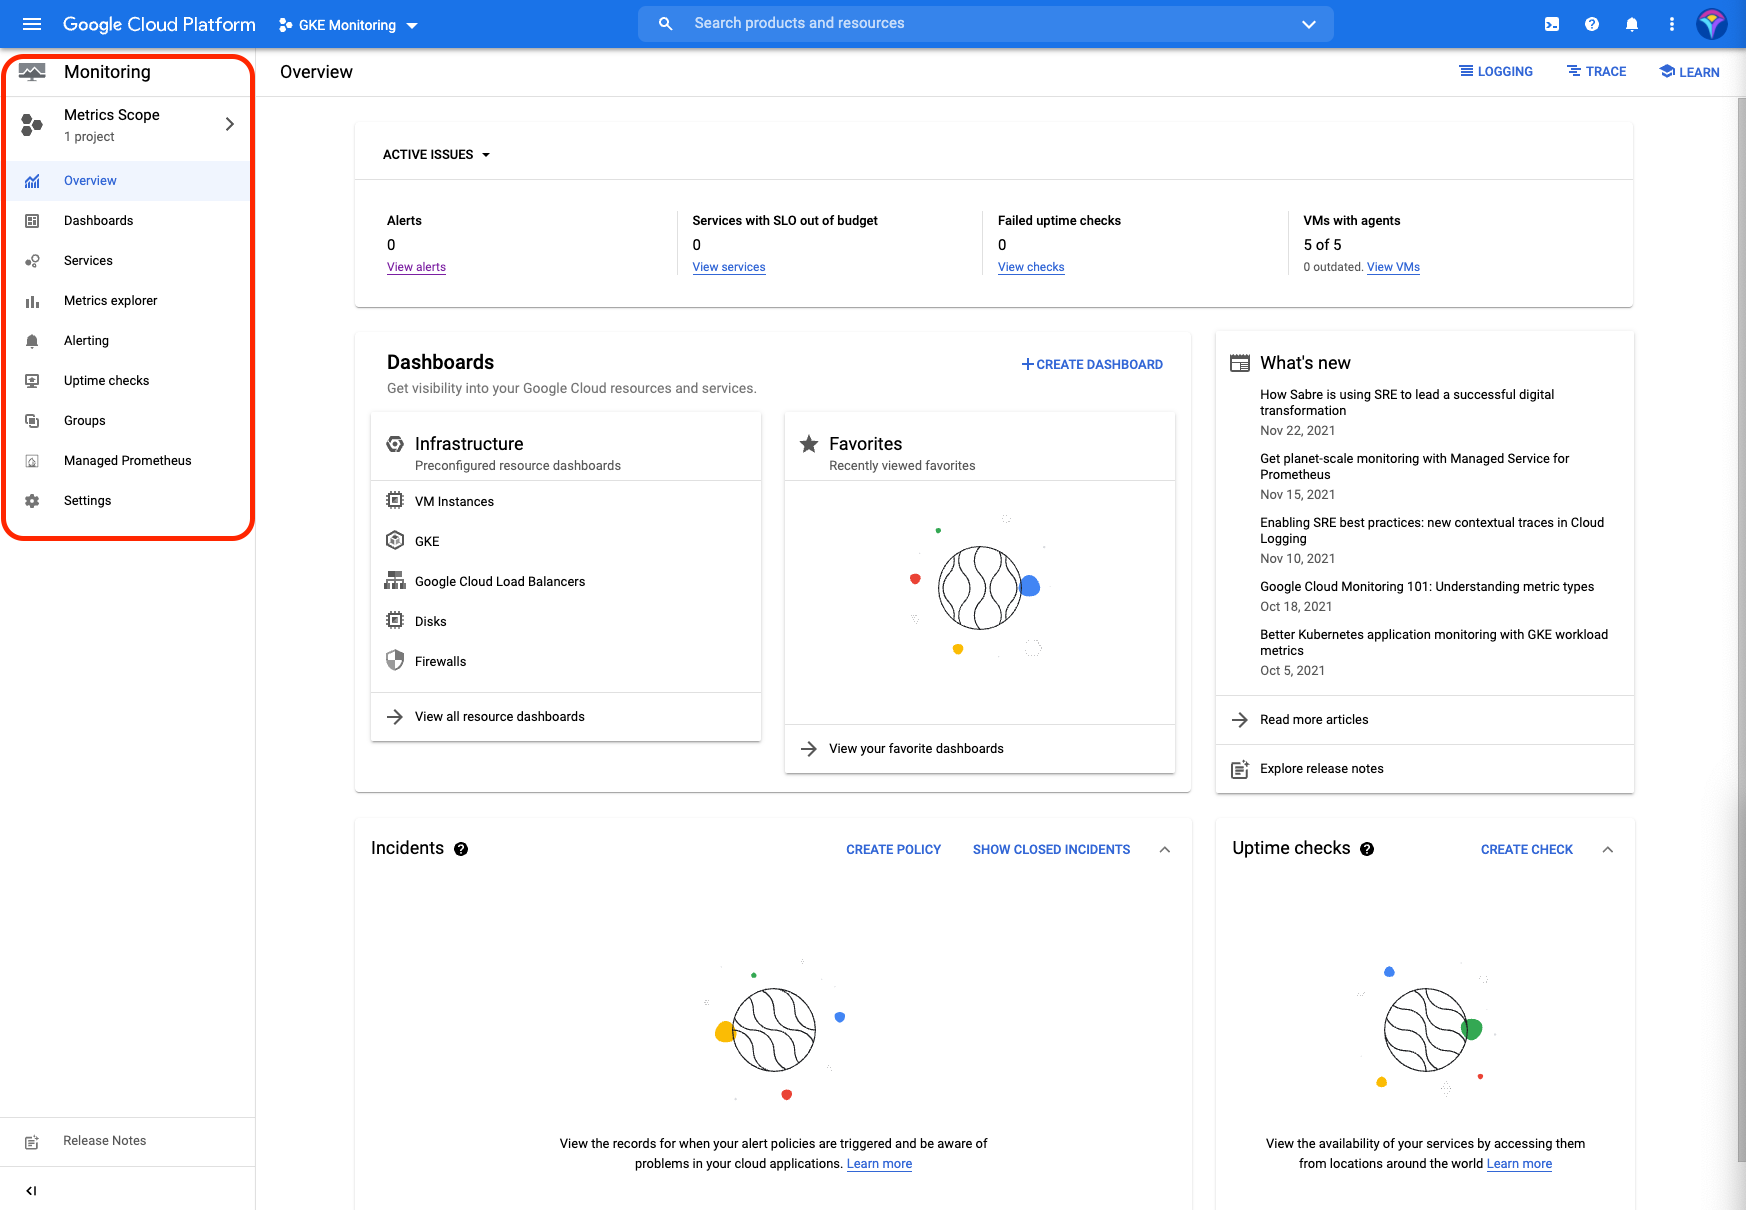
Similar to Cloud Logging, Cloud operations offers a complete solution Cloud monitoring which provides visibility for both infrastructure and applications, whether they are hosted on premises, in Google Cloud, or in another cloud. Out of the box, Cloud monitoring gives you an overview of the events of your Kubernetes cluster, as well as dashboards that put a wealth of information at your fingertips. If necessary, you can also define your own custom metrics and export them to third-party services for further analysis.
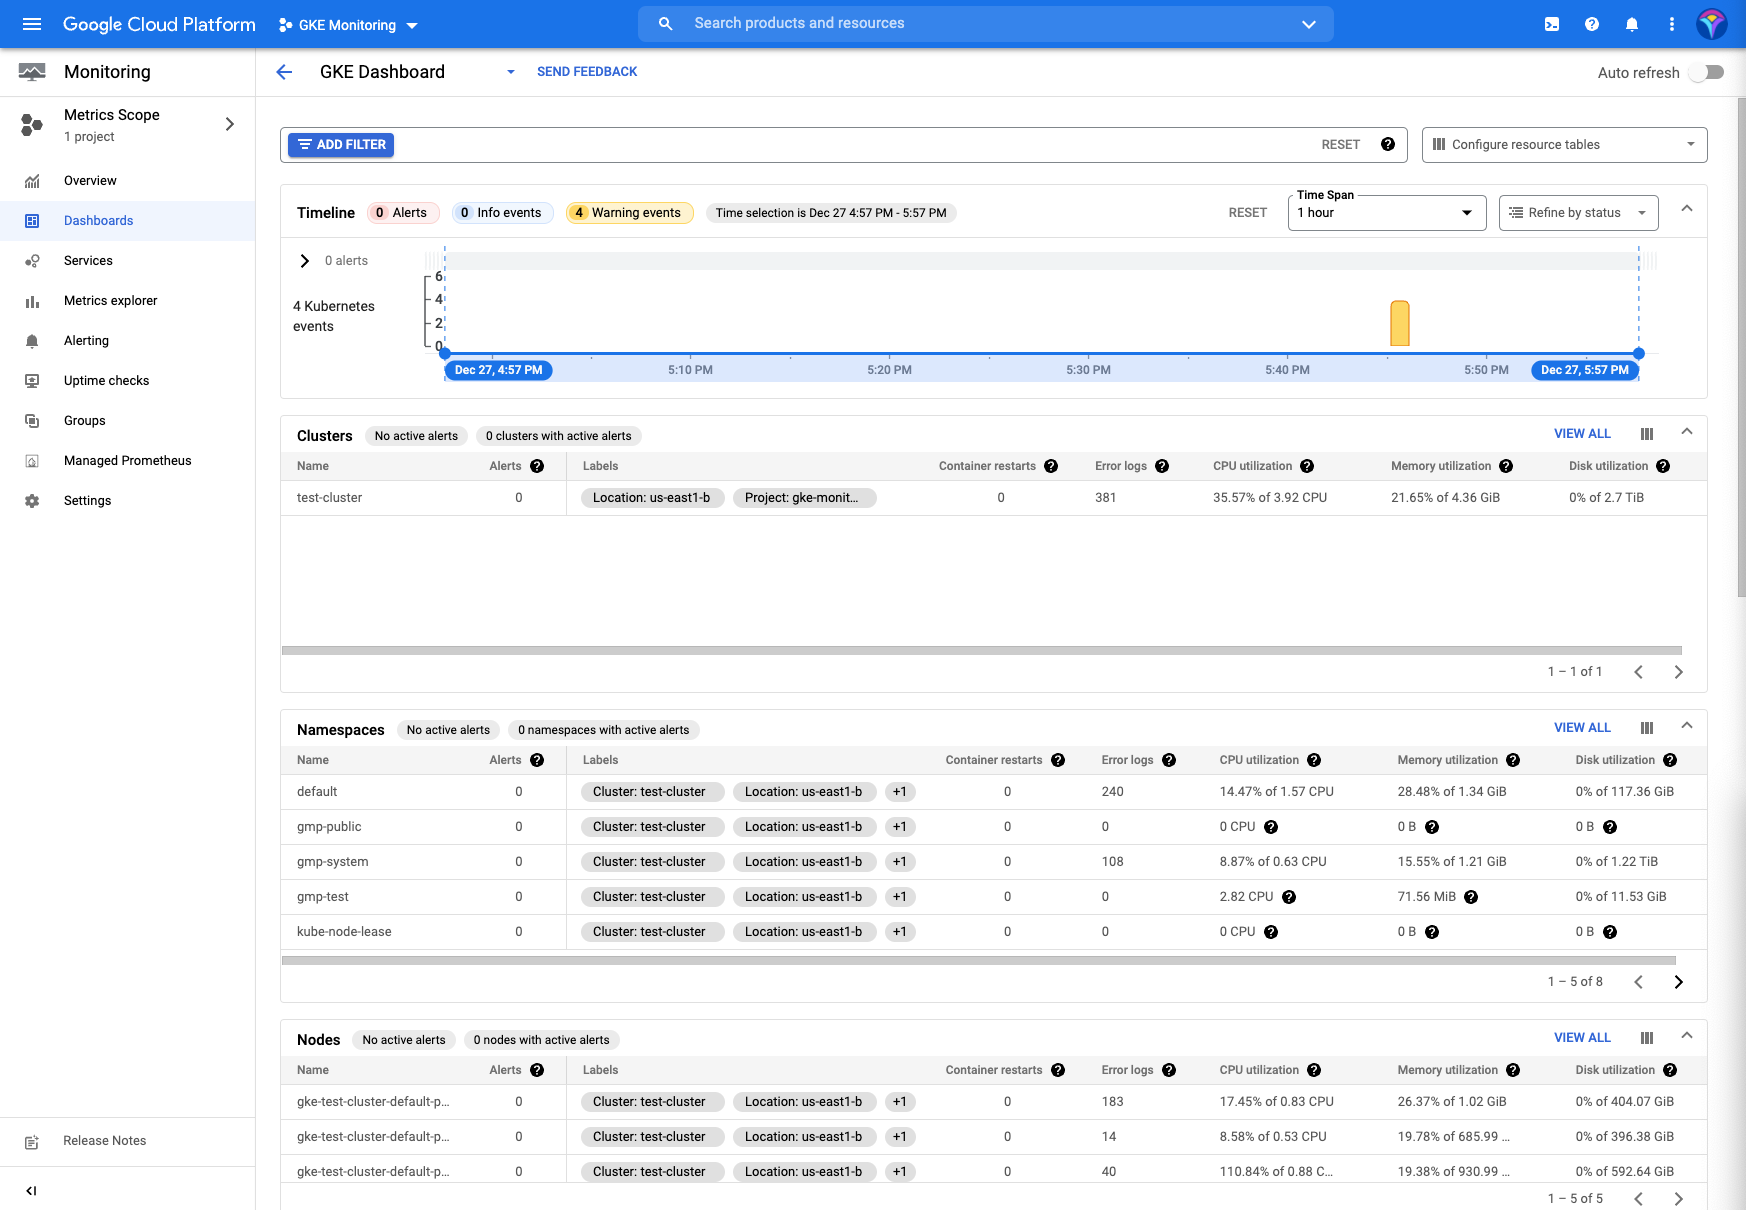
Cloud monitoring also includes a handy GKE Dashboard that offers you a bird's-eye view of your Kubernetes clusters.
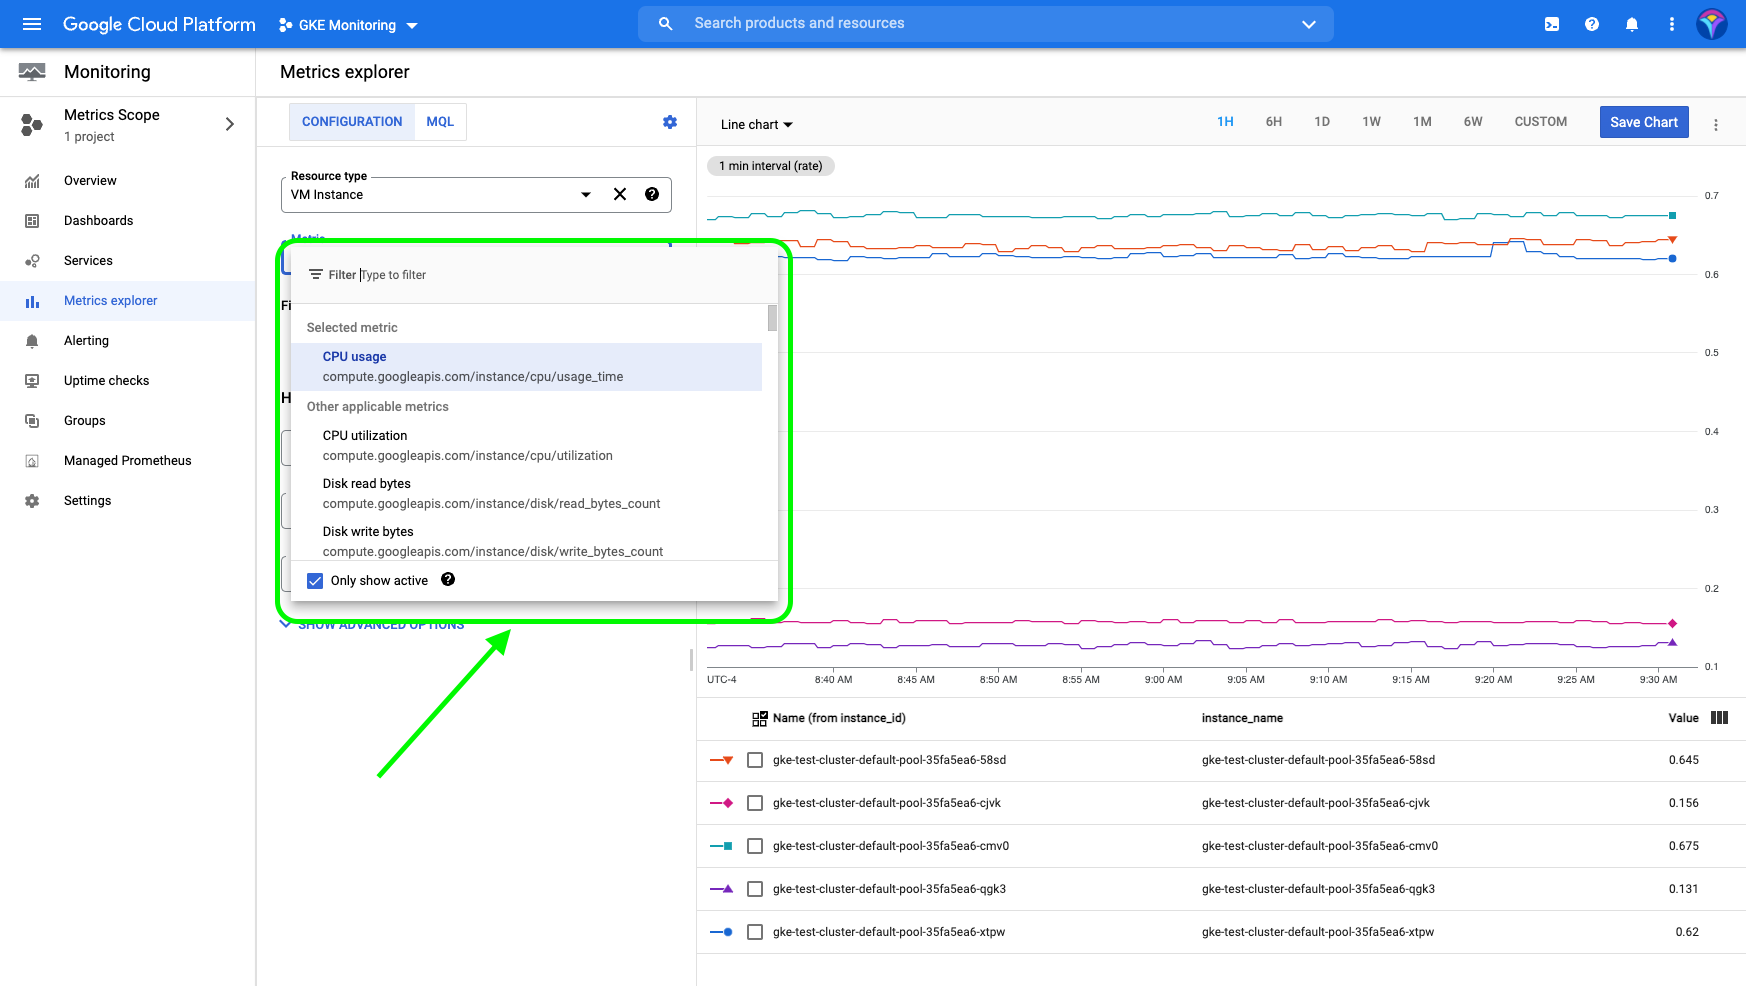
The true power of Cloud monitoring, though, is how easy it makes it to navigate through the different metrics using the Metric Explorer, which allows you to analyze metrics in real time, identify correlations, problems, or points of interest, and add graphs with these metrics to any dashboard. Best of all, you can configure the charts visually or do it programmatically by using the Monitoring Query Language (MQL) built into the Metrics Explorer.

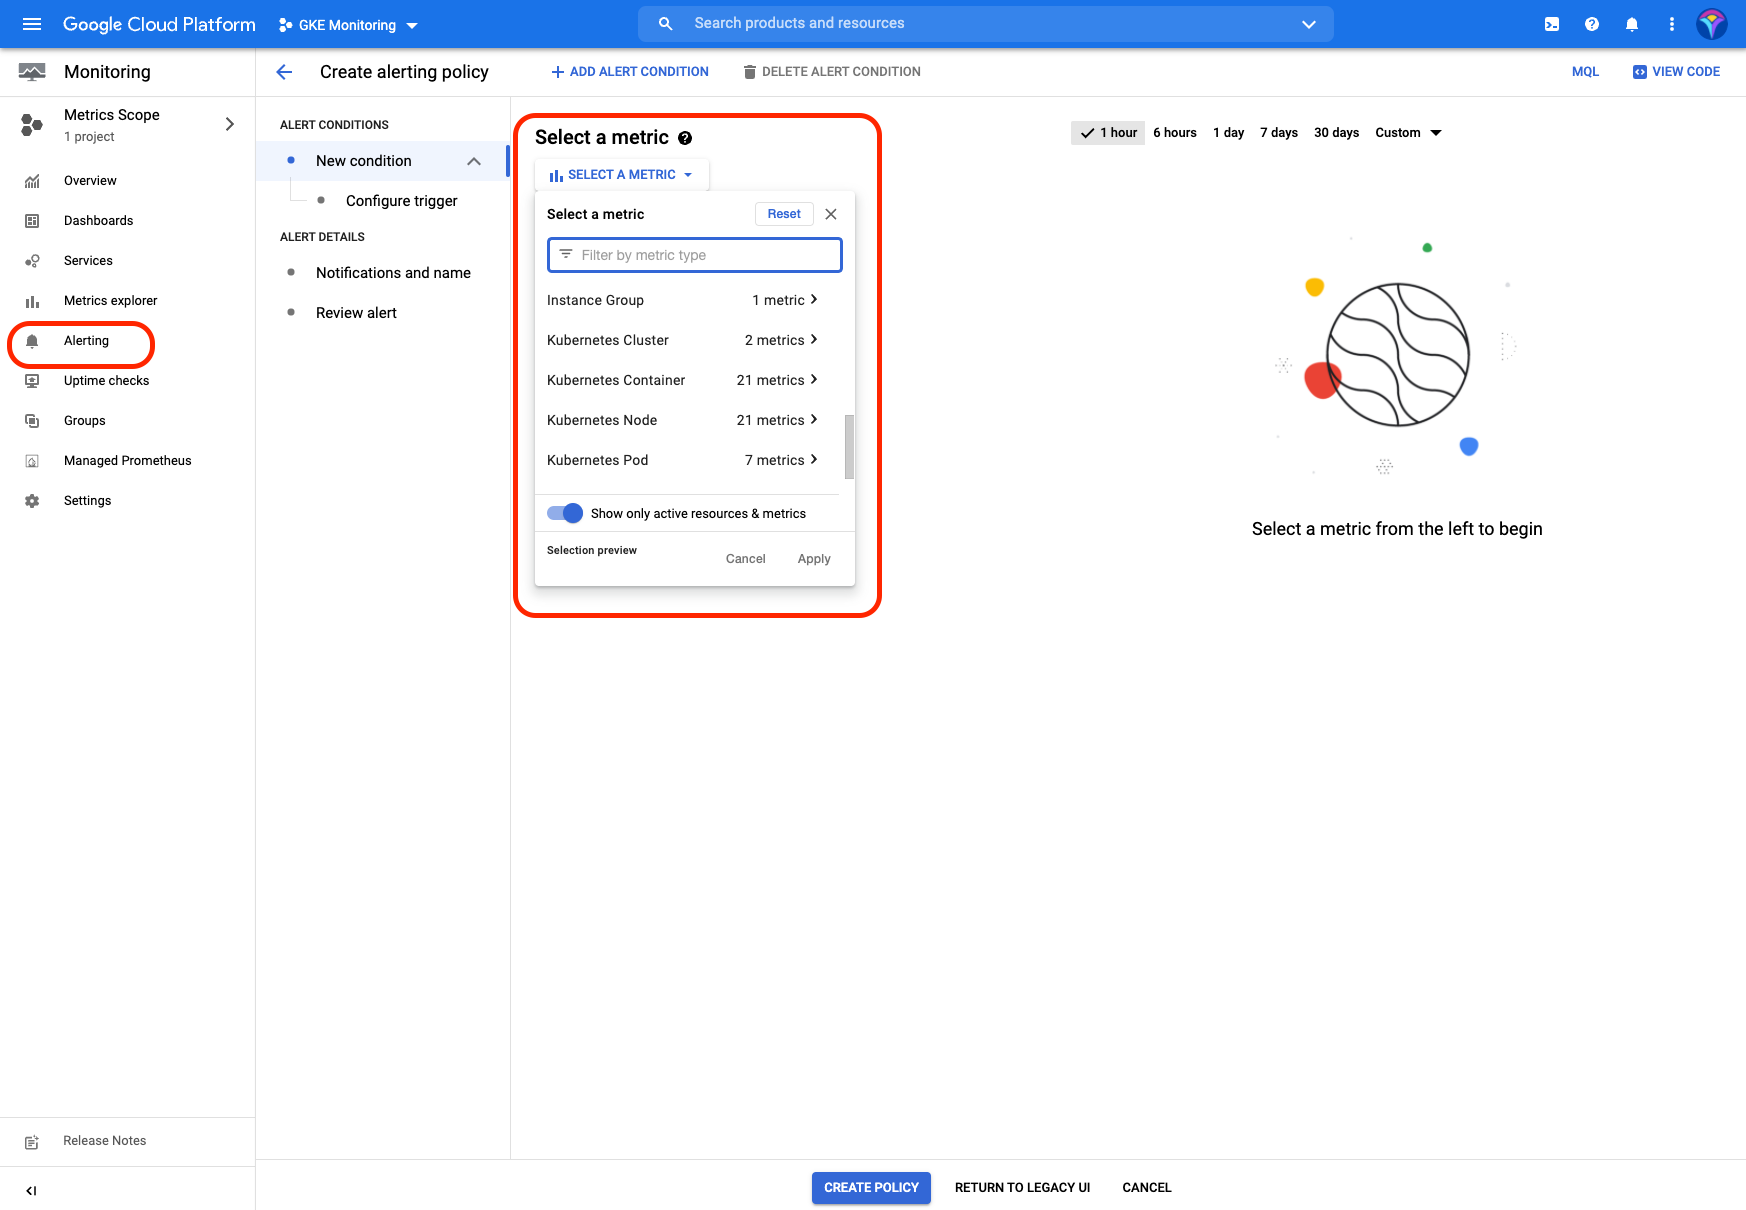
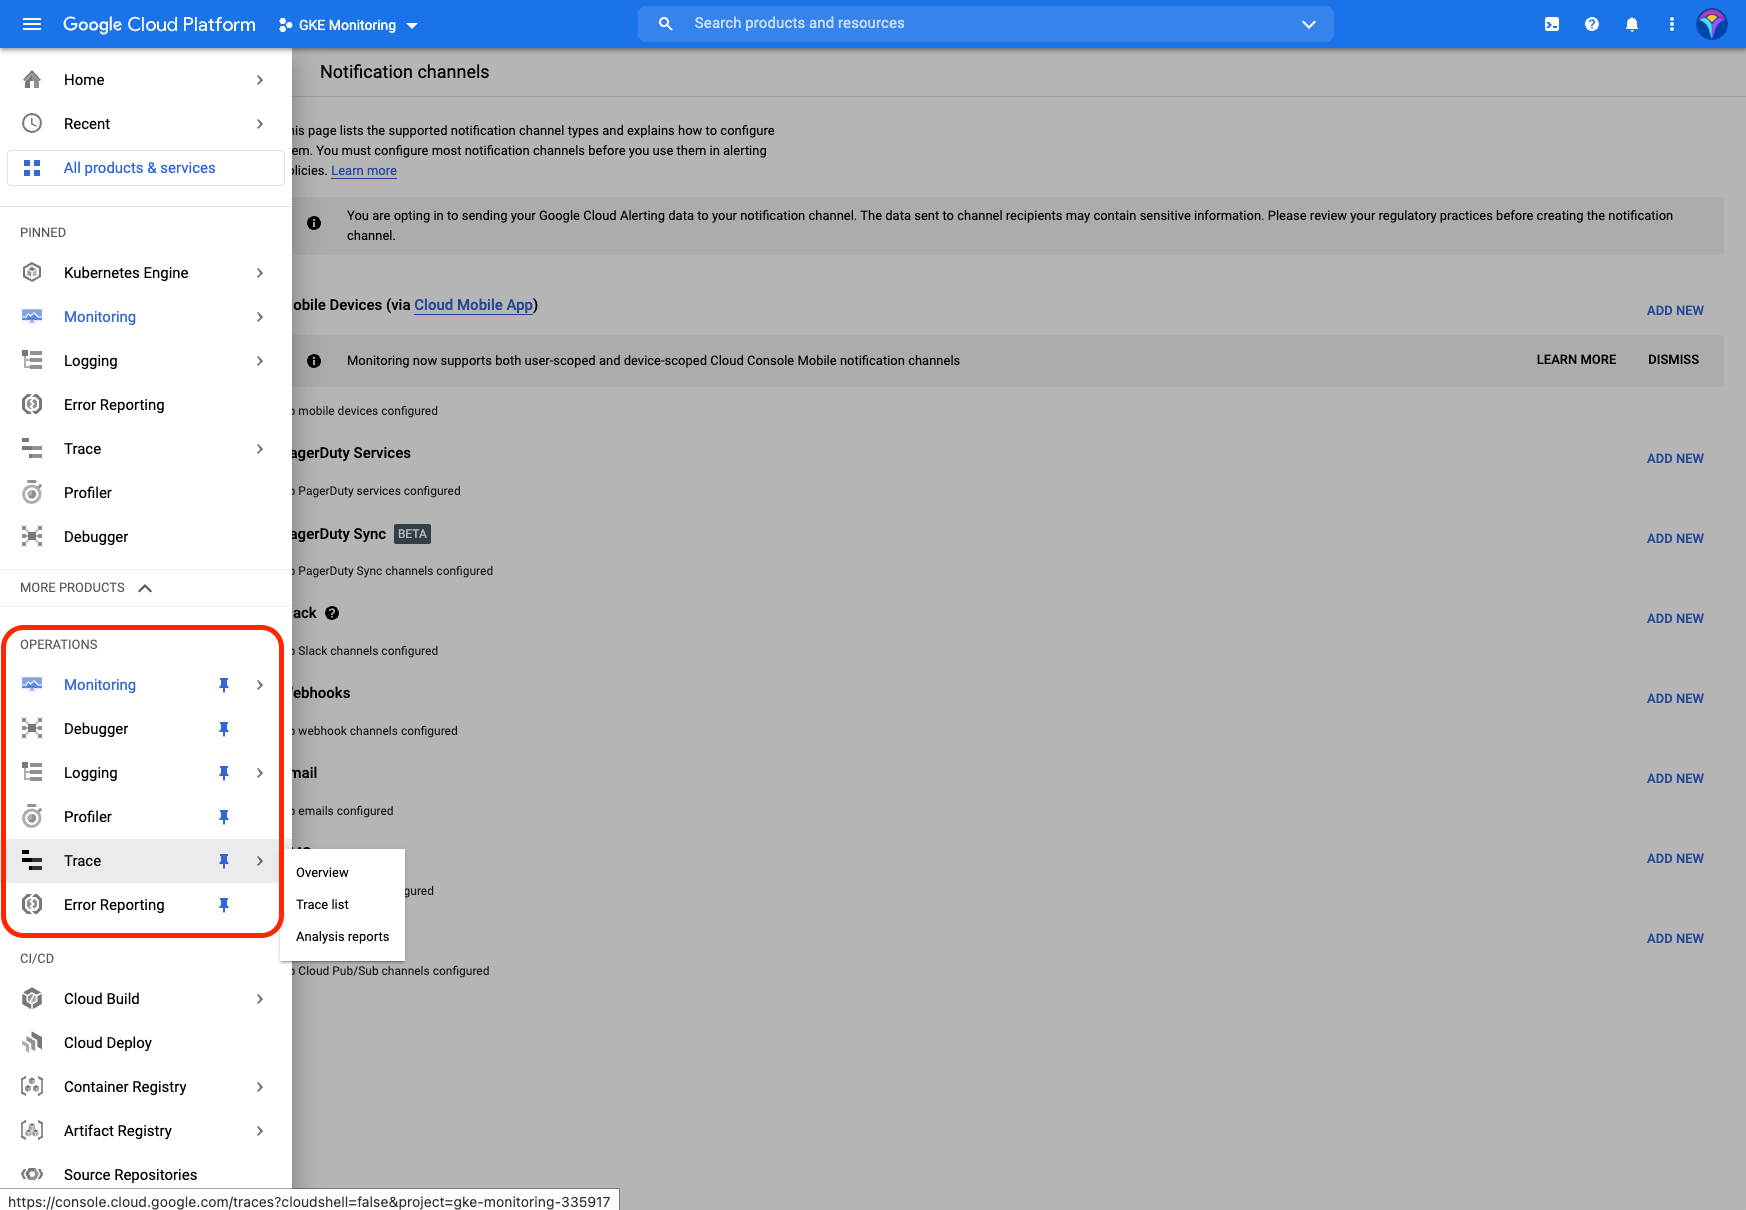
A monitoring system wouldn’t be complete without a way to define alerts. The Alerting menu offers you a summary of recent incidents, as well as the ability to create alert policies based on metrics of interest. You can also configure notification channels such as Cloud Mobile App, PagerDuty Services, PagerDuty Sync, Slack, Webhooks, Email, SMS, and Cloud Pub/Sub to receive these alerts.
Application performance management
Other tools included in the Cloud operations suite are Cloud Trace, which allows you to understand the flow of information and detect latency issues; Cloud Debugger, which enables you to inspect applications in real time without having to stop them; and Cloud Profiler, which constantly analyzes the performance of your code on each service to help you improve speed and keep costs under control. All of these tools leverage the power of Cloud Logging and Cloud monitoring to offer a complete solution for managing the performance of your applications.
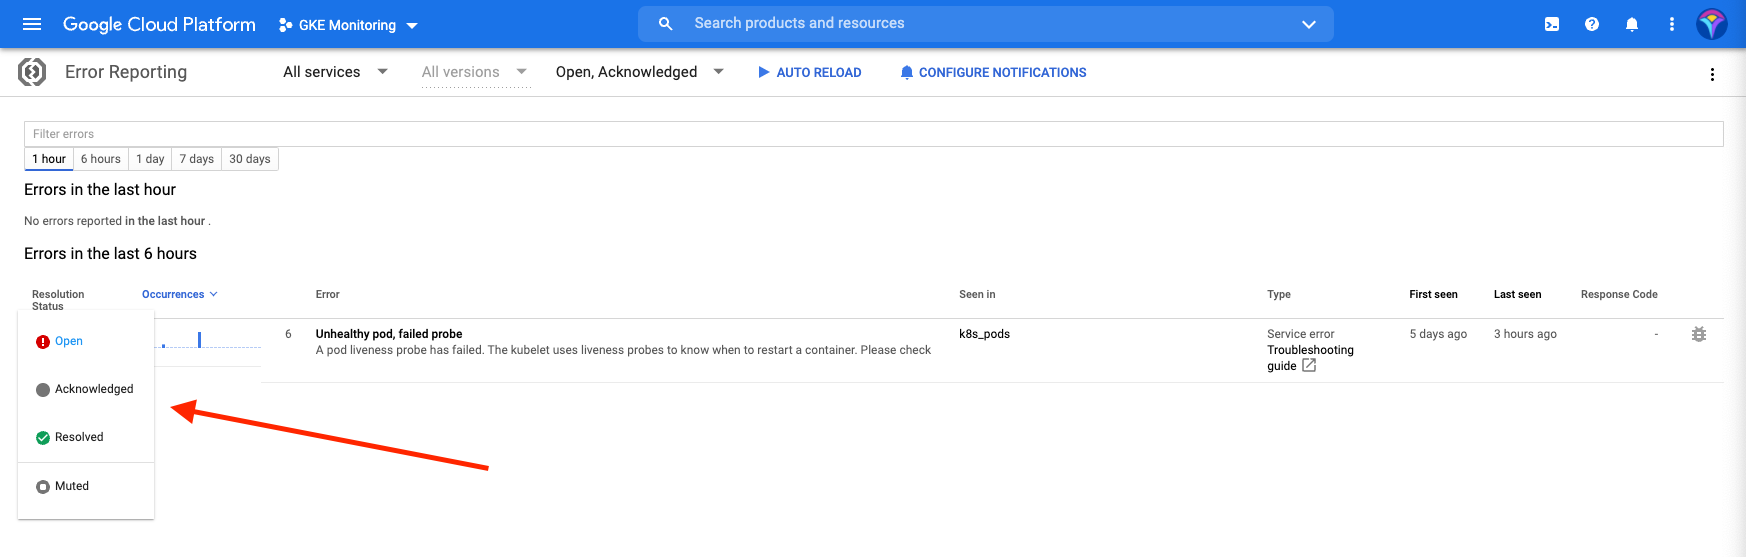
There’s also a section for error reporting. In it, you can view the most recent errors and their status, as well as configure notifications that offer the same options as the alerts.
Cloud operations configuration and pricing
For new GKE clusters, Cloud Logging and Cloud monitoring are enabled by default, though you can disable them from the Cloud Console or Google Cloud Console. Because these services are enabled by default, you can monitor your GKE clusters, manage your system, debug logs, and analyze cluster performance right out of the box.
Like most providers, Google Cloud operations suite offers a free monthly allotment for each of their services. Beyond that allotment, each service is billed separately, and pricing depends on how much data is processed. For more information about Cloud operations suite pricing, you can check the pricing documentation.
Google Cloud managed service for Prometheus
Google Cloud Managed Service for Prometheus is an optional Cloud monitoring service that allows you to monitor and receive alerts for your workloads using Prometheus without having to worry about manually managing or scaling it. Google Cloud offers this fully managed storage and query service for Prometheus metrics in two modes: managed data collection and self-deployed data collection. For more information on the differences between these modalities, you can read the Prometheus documentation, but for the purposes of this article, you’ll focus on the managed service, because it’s the recommended option for GKE environments.
To get started with the managed collection, you’ll need to make sure that Google Cloud APIs and Services are enabled. You’ll also need to configure your environment using the gcloud config set project PROJECT_ID and kubectl config set-cluster CLUSTER_NAME commands. Once this is done, you can create a namespace and set up the managed collection using the following commands:
After these changes, the service will be ready to use, but you’ll still need to configure the PodMonitoring custom resource for ingesting metric data to Prometheus. The detailed procedure to configure this resource is found in the documentation. Once you’ve configured the target scraping and metrics ingestion using the PodMonitoring resource, you’ll have access to the Managed Service for Prometheus in the Cloud monitoring menu.
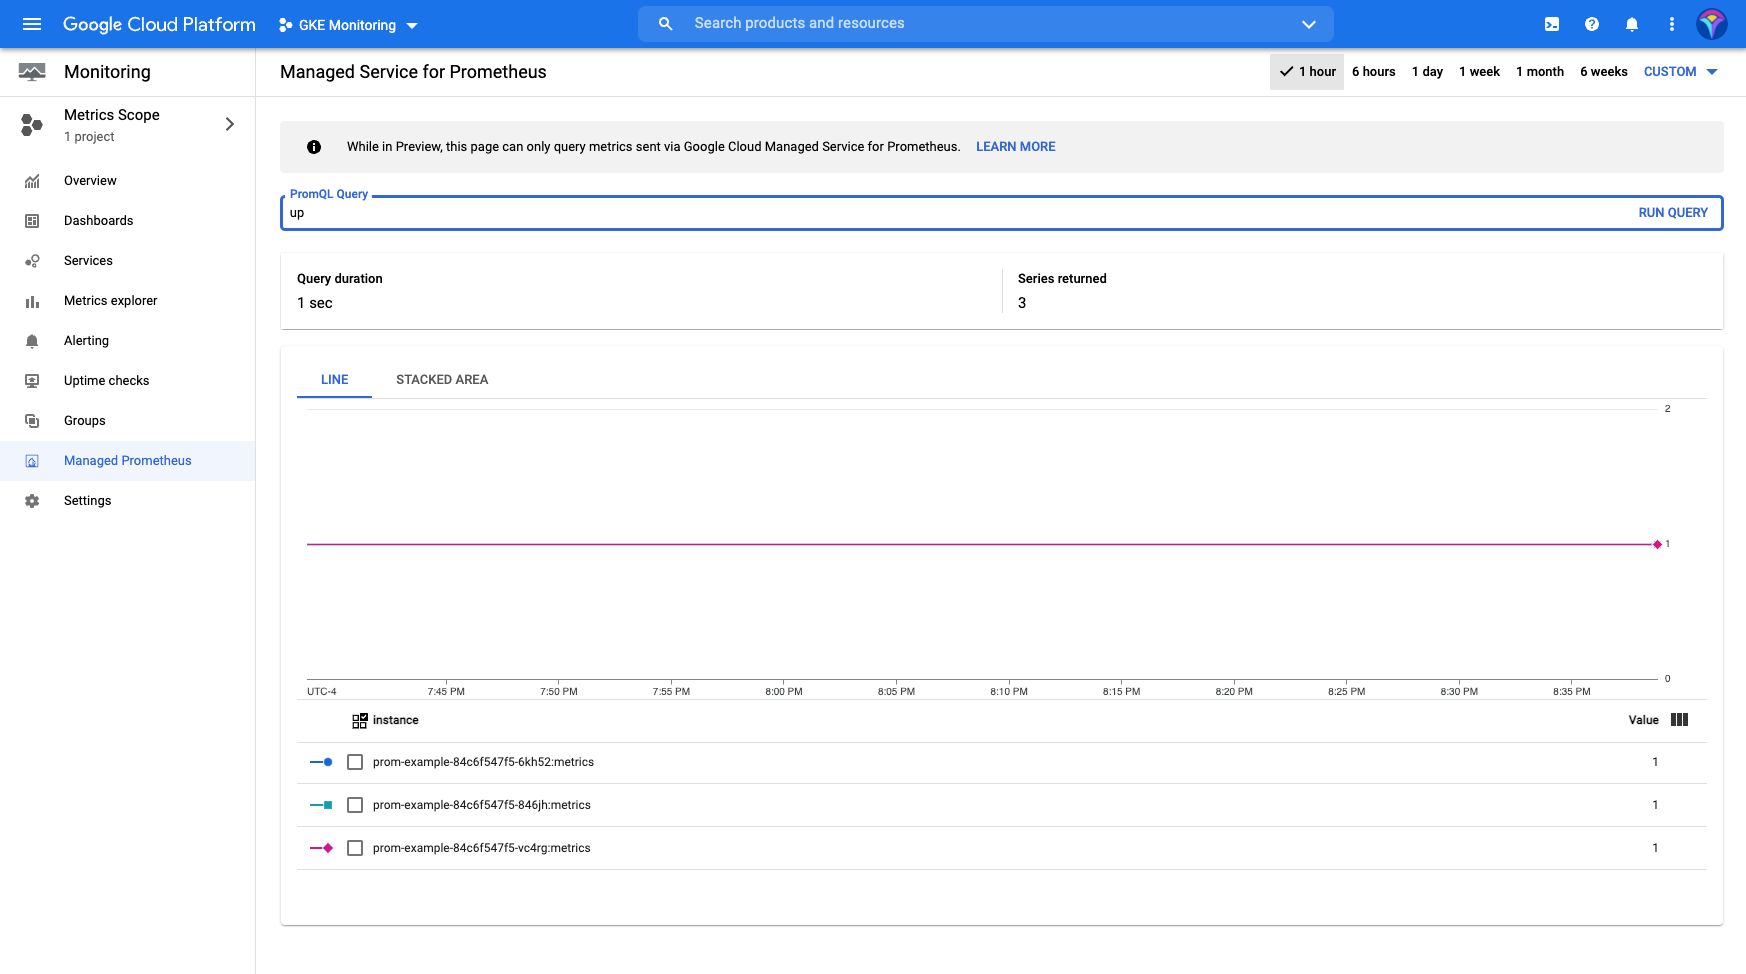
In the graphical interface, you can use PromQL to run queries in real time. Although having Prometheus is great, it’s even better when combined with Grafana.
Data visualization in Grafana
Grafana is one of the most widely used, open source data visualization and analysis tools available today. Among other factors, its popularity is due to the fact that it can pull and process metrics from almost any source, which allows it to integrate smoothly with Prometheus to process massive amounts of data from your infrastructure.
Grafana can be found in the Google Cloud Marketplace. One of the easiest ways to integrate Grafana into your GKE cluster is by using Google Click to Deploy.
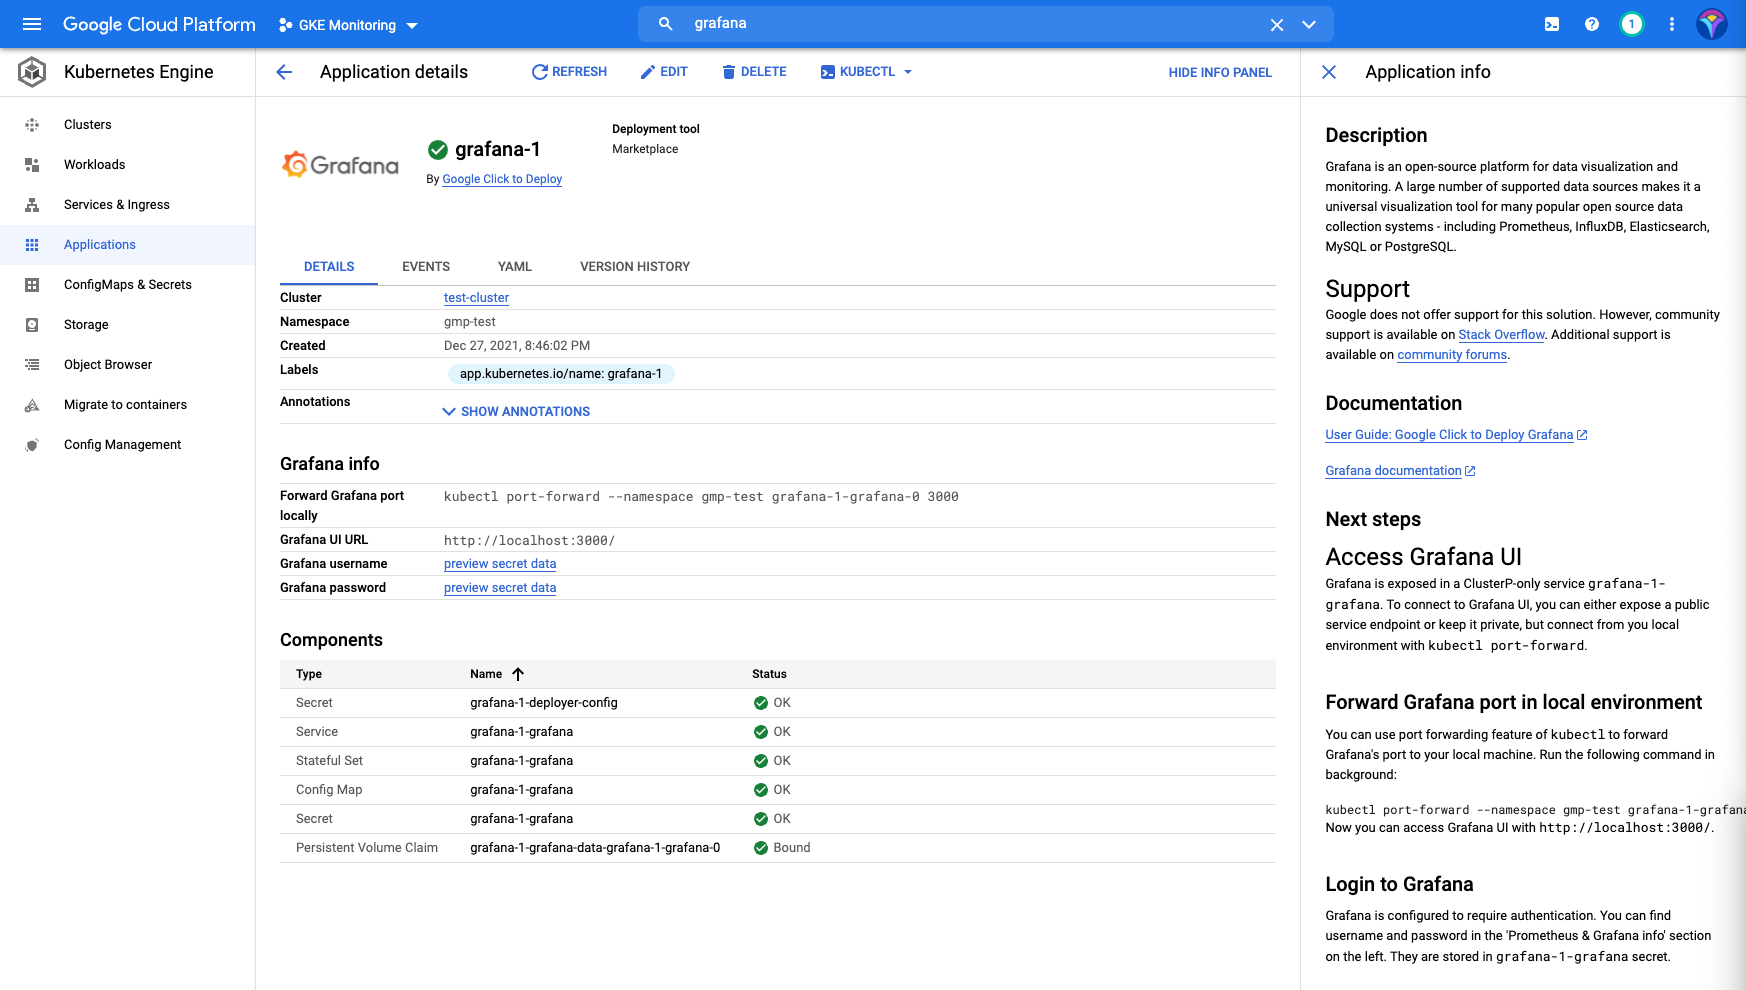
With the Grafana application installed, just follow the directions to redirect Grafana to your local machine using kubectl port-forward.
Once that’s done, you’ll have access to the Grafana UI and will be able to import or create dashboards using Prometheus metrics.
Final thoughts
In this article, we’ve explored how to monitor Kubernetes clusters with GKE using Google Cloud’s operations suite, Managed Prometheus and Grafana takes the monitoring and analysis of your Kubernetes cluster to a new level, thanks to unique visualizations that show you the metrics of your infrastructure in a clear, straightforward way, while also offering unique insights into the performance of your cluster.
If you're looking to build an internal UI to help make monitoring your Kubernetes clusters even easier, then consider Airplane. Airplane is the developer platform for building custom internal tools. With Airplane, you can build single or multi-step functions (called Tasks) or powerful, React-based dashboards (called Views) within minutes using code. With Views, you can build a monitoring dashboard using Airplane's pre-built component library and template library.
To build your first monitoring dashboard in Airplane, sign up for a free account or book a demo.


