


Many engineering teams find it useful to create alerts on Kubernetes events like CrashLoopBackoffs, Pod Evictions, and Kubernetes jobs either succeeding or failing. These events and others can provide a deep level of insight into the performance of the cluster and are also particularly useful for debugging.
However, by default, the cloud providers like GKE, EKS, and AKS, do not save Kubernetes events for long periods of time. Engineering teams will likely find it useful to store this information for longer periods of time and in the process create a historical record of the changes that have happened inside of the cluster.
At ContainIQ, we collect and store historical Kubernetes events for you. And users have the ability to create alerts on specific events and then feed those notifications to selected Slack channels.
Logging and storing Kubernetes events
As we mentioned above, Kubernetes events are typically stored in the cluster for less than an hour by default. In order to create a historical record of events you must capture them from the Kubernetes API and then export them into a database. There are a number of open-source exporters available, including one from OpsGenie, or you could use ContainIQ. At ContainIQ, we collect and store Kubernetes events for you and offer visualization and debugging tools on top.

Above is an image of our Kubernetes events dashboard where users can search for specific events, view all events over time, filter based on a date range or frequency, and toggle between normal or warning events.
A user, for example, can search for only warning events from the prior week and view that day on an hourly basis. As another example, a user could drill down on a specific node over the last month and see all of that data on a daily basis.
Creating alerts on Kubernetes events
After you’ve collected and stored the Kubernetes events from the API, the next step is to set alerts on these events. There are certain events that really every engineering team should be alerting on, things like CrashLoopBackoffs and Pod Evictions which are leading indications. But it is also common to alert on things like Kubernetes jobs failing, pods restarting, ImagePullBackOffs, FailedAttachVolume, FailedMount, FailedScheduling, NodeNotReady, HostPortConflict, and more.
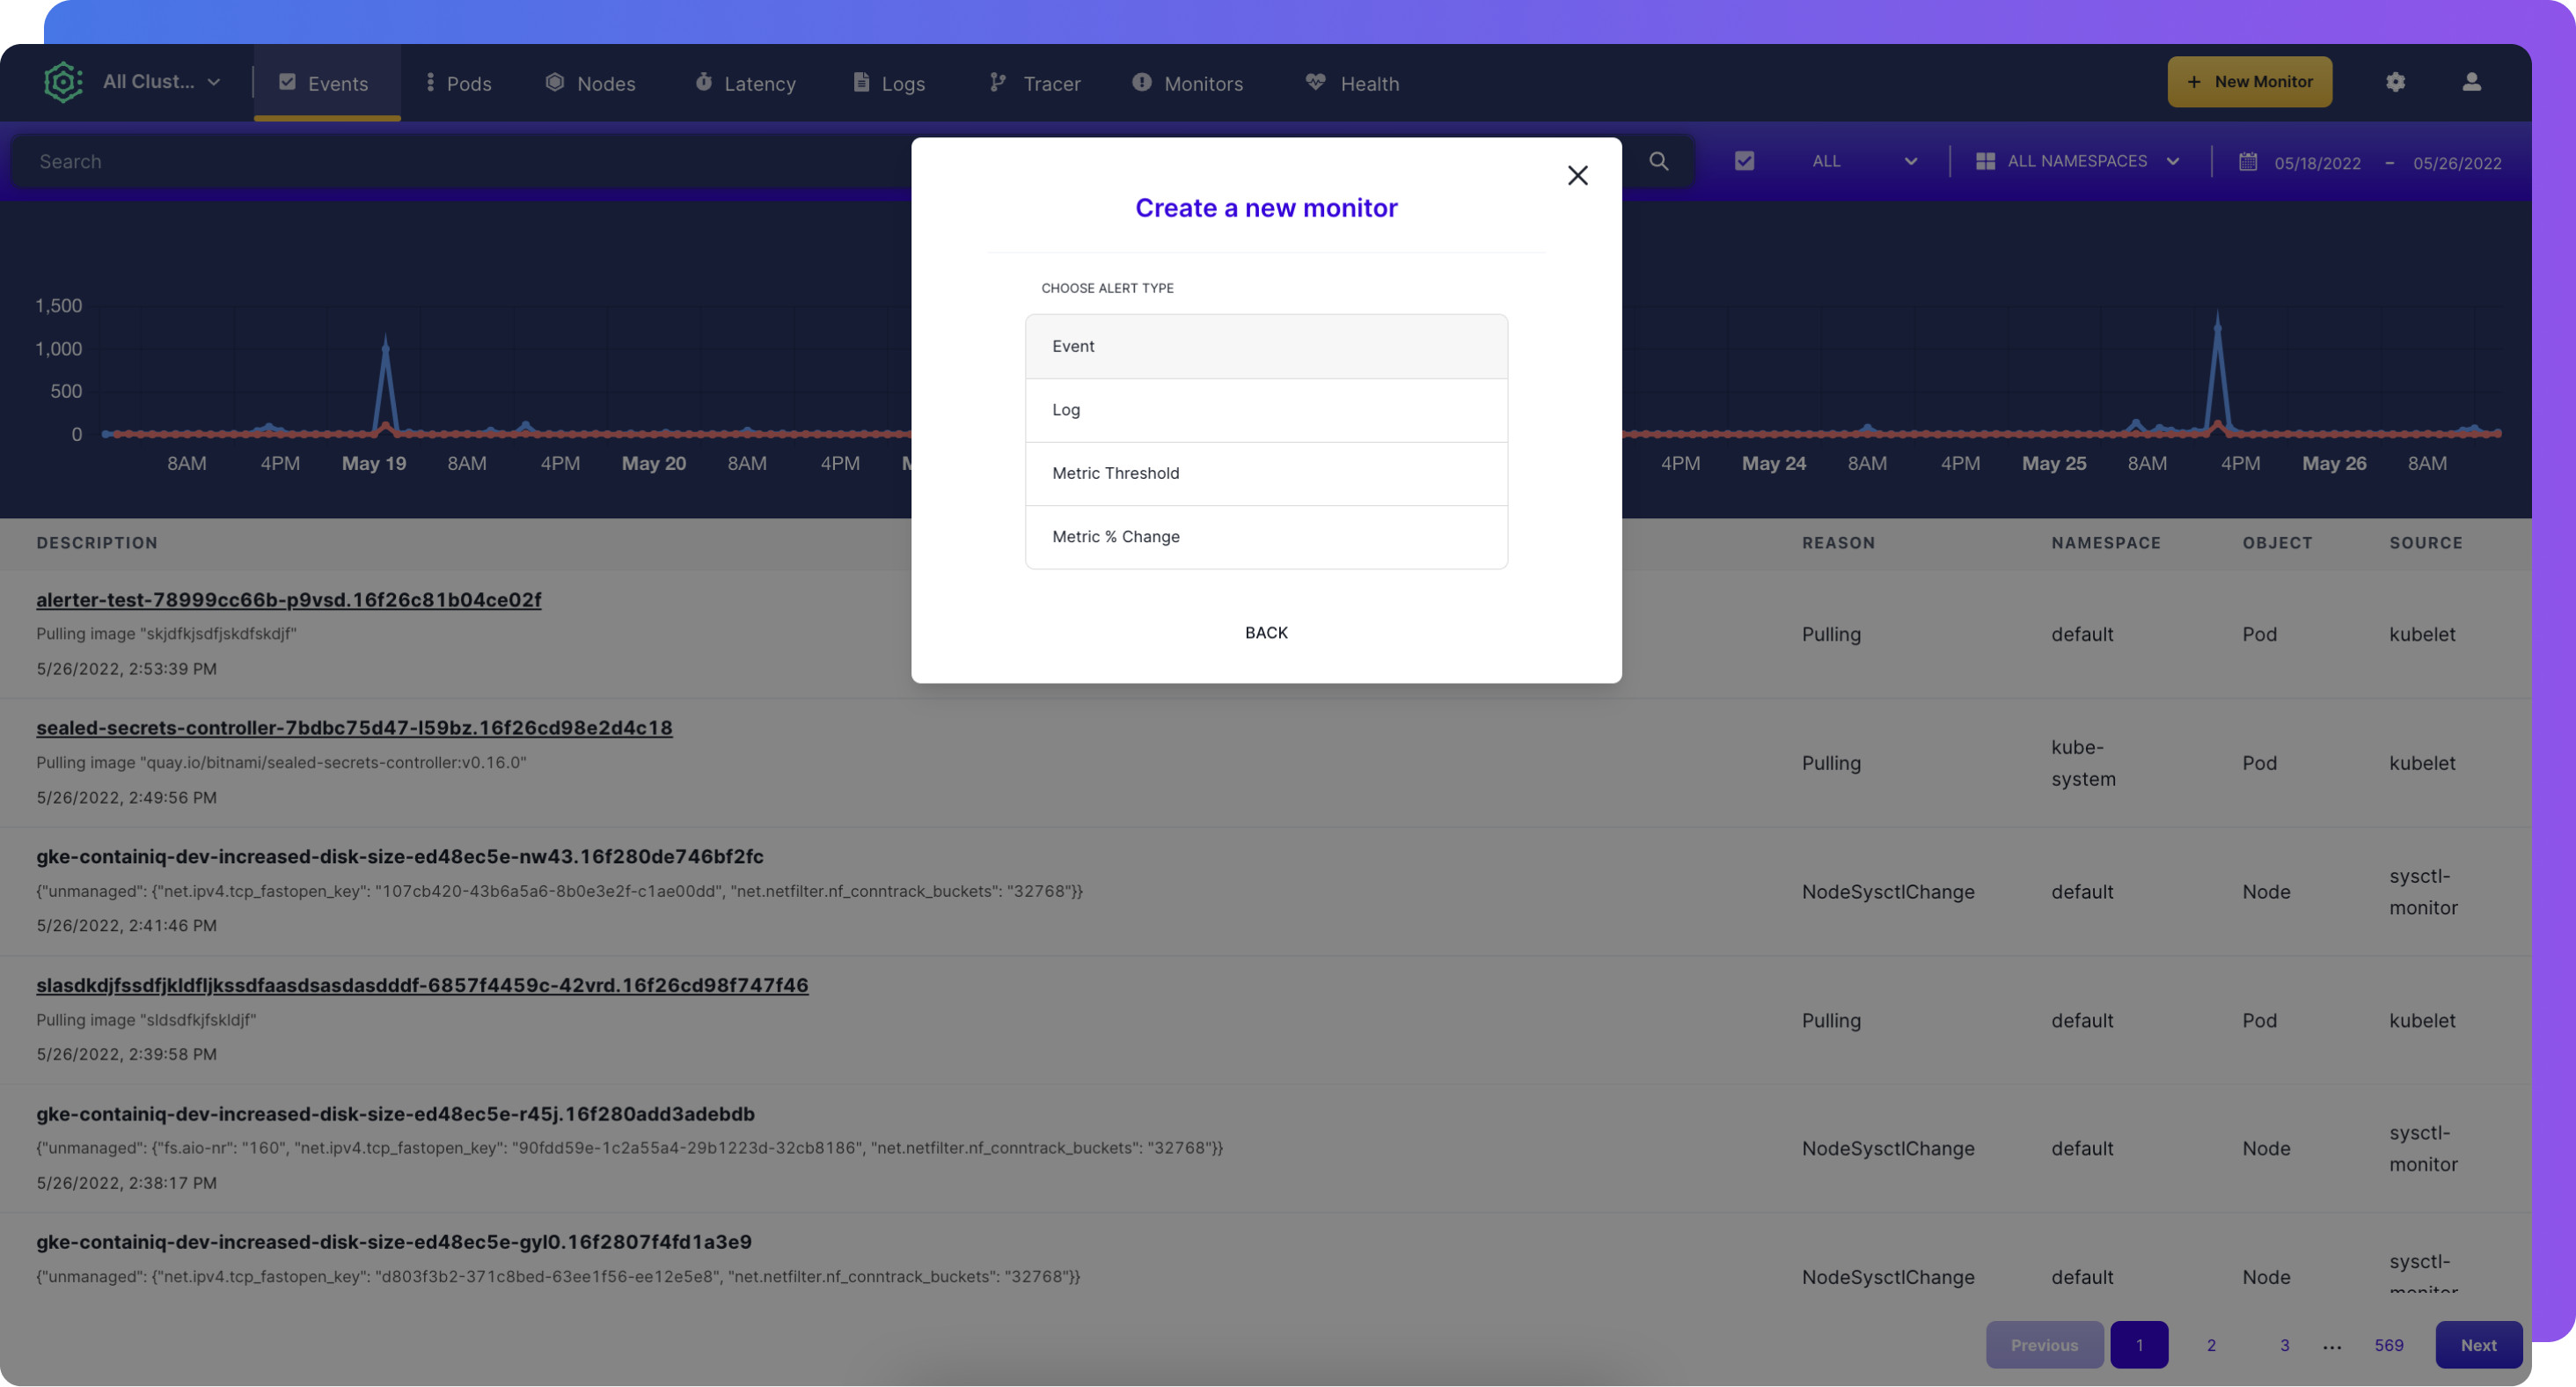
If you are using ContainIQ is is very easy to create alerts on specific Kubernetes events. By clicking on New Monitor, users will be prompted to create an alert on an event. The first step is to set the name for your monitor, or alert:
From there, users can choose the Event Reason and the Event Object Name:
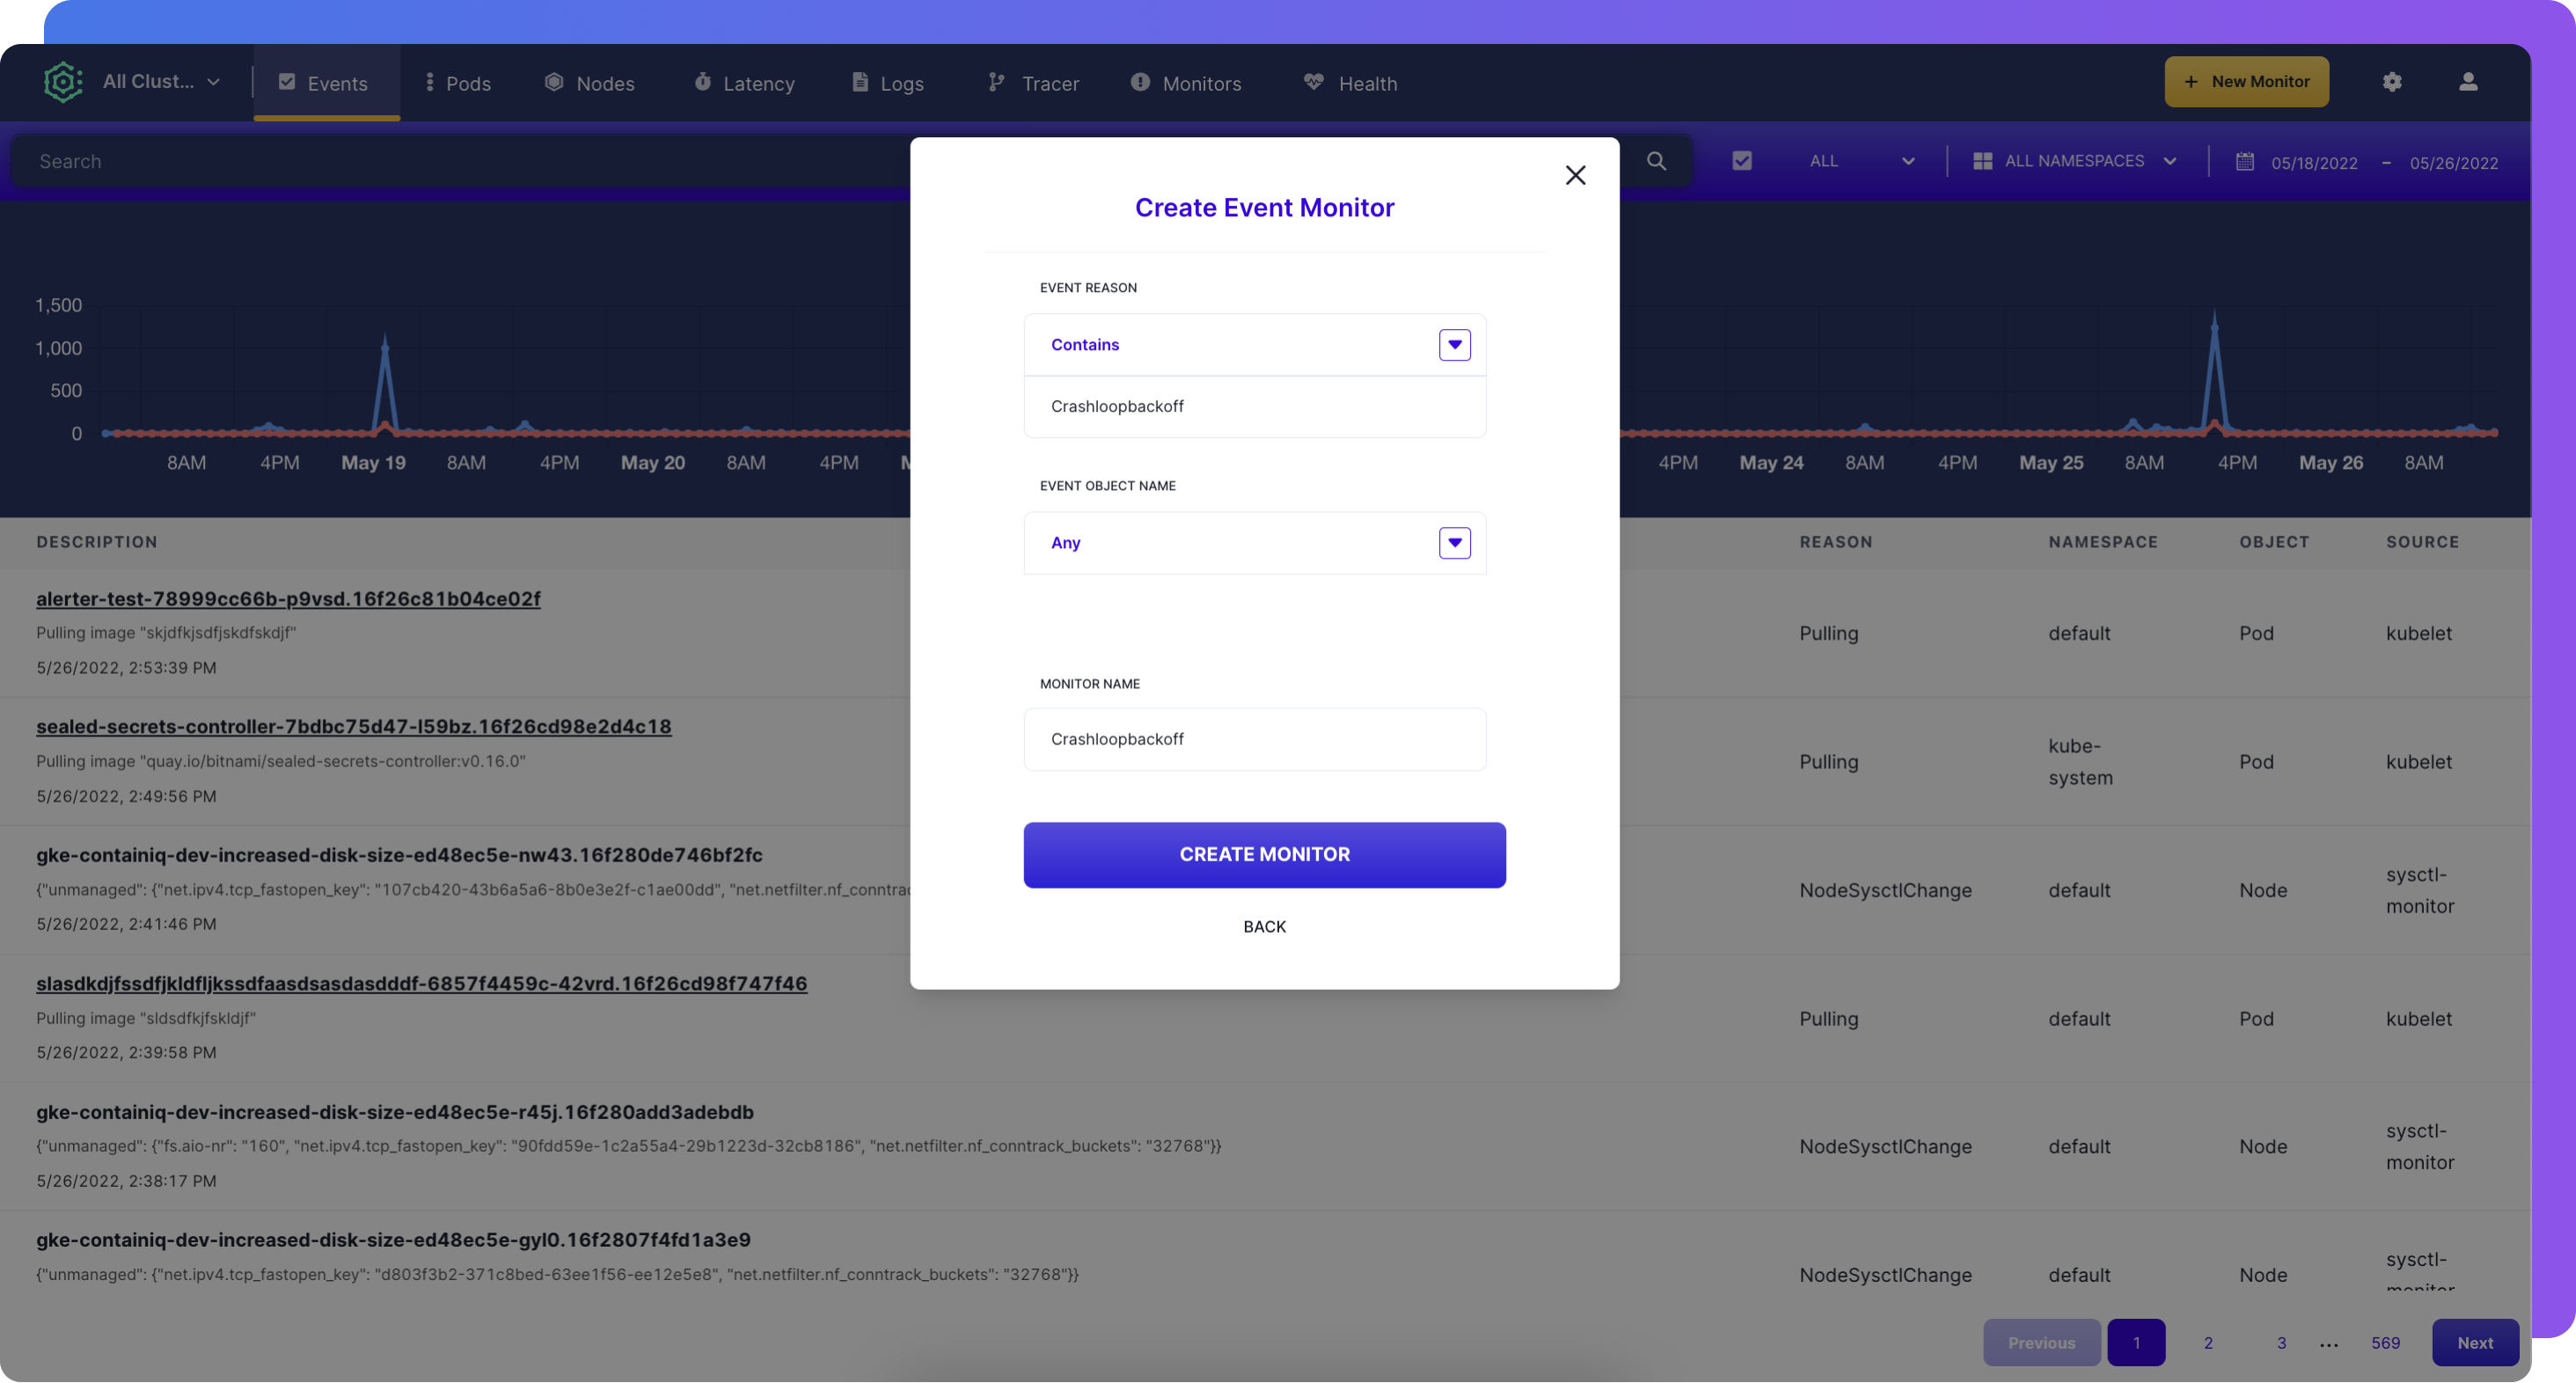
By clicking the Create Event Monitor button, the event alert will be created and notifications will start feeding to the connected Slack channel (instructions below). Once created, alerts on events can be toggled on or off or can be deleted from the Monitors tab on the ContainIQ dashboard.
Feeding Kubernetes events to slack
There are a handful of open-source tools you can use to feed Kubernetes event alerts to a Slack channel. Alternatively, ContainIQ is a managed tool that can be used to to feed Kubernetes events to a desired Slack channel.
Linking a Slack channel should only take a few minutes and users can change or update their Slack settings from My Account, Integrations.
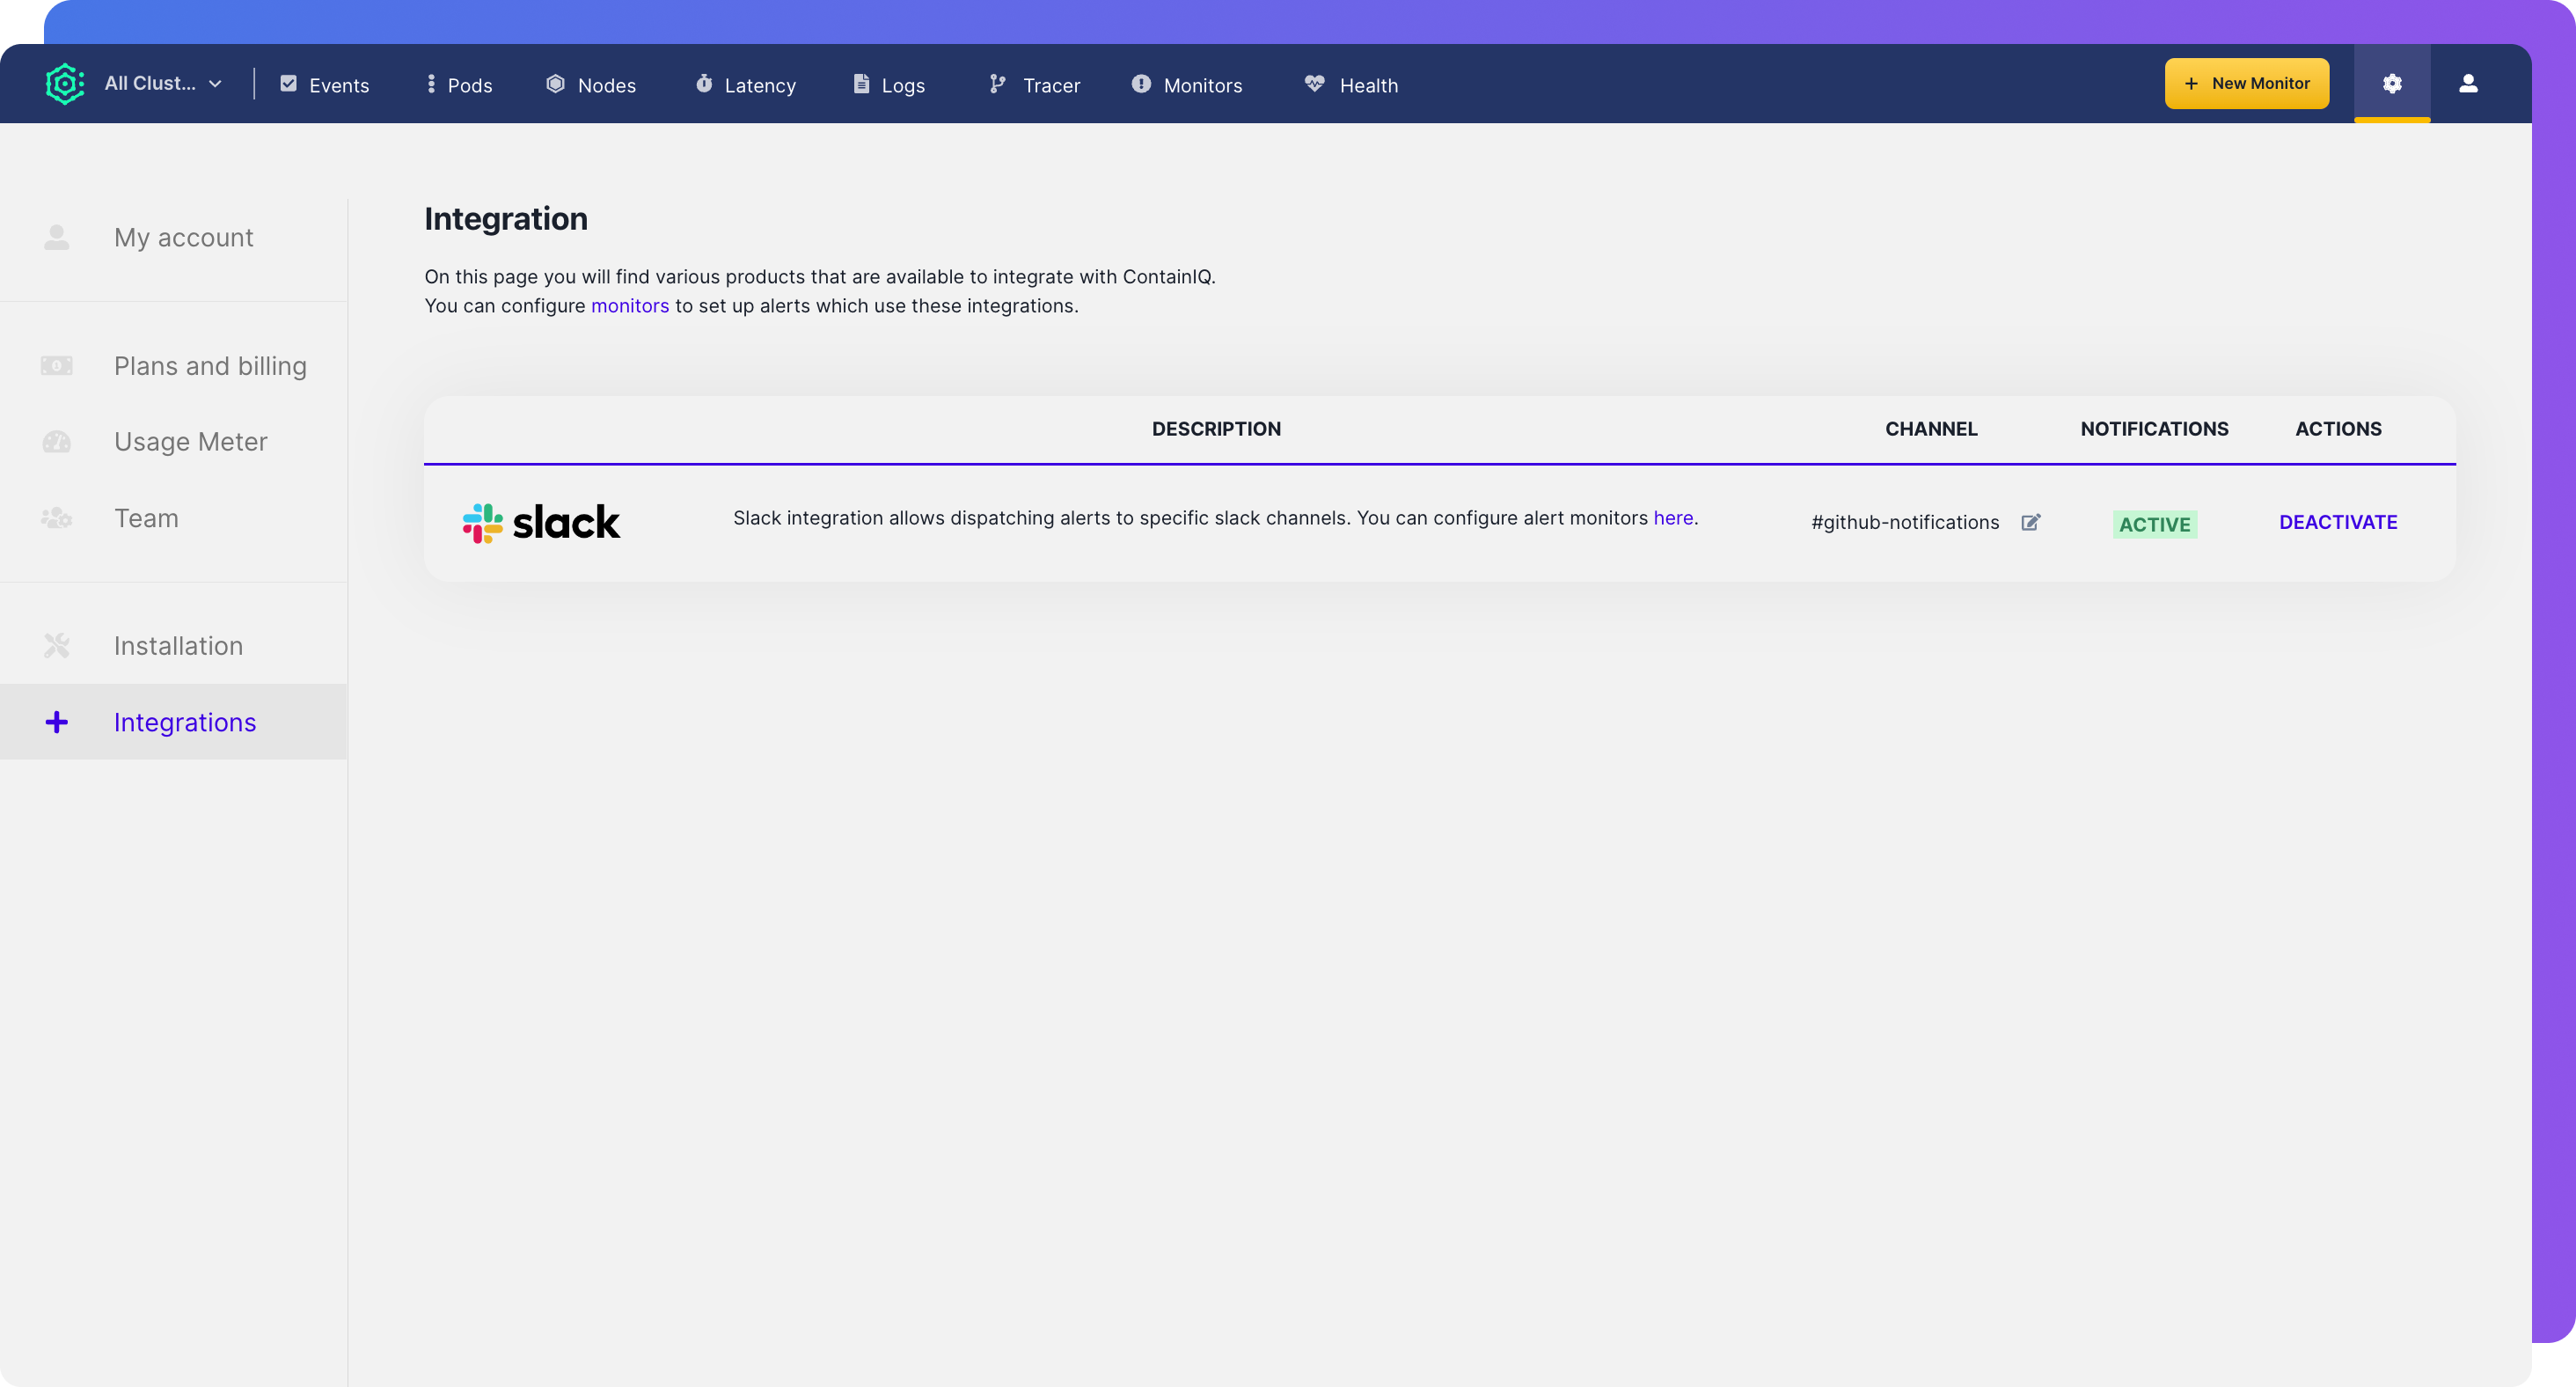
By clicking Activate, users can choose the Slack channel where they want to receive the alerts.
Conclusion
Alerting on Kubernetes events can be helpful for most engineering teams. Engineers can save time today and over the longer term by creating a historical log of Kubernetes events alongside smart alerting triggers. There are a number of open-source tools that you can patch together and will allow you to do both. But you also could consider using ContainIQ to collect and store your events and to create alerts on these events for you.
If you want to dig deeper into this topic, check out our articles on monitoring for popular metrics such as CPU and memory usage for pods and nodes, latency, and other helpful tools for rightsizing your Kubernetes cluster.
If you're looking to build custom workflows and UIs to help monitor your Kubernetes clusters, then you should try out Airplane. Airplane is the developer platform for building internal tools. With Airplane, you can use SQL queries, Python scripts, REST API calls, and more to build custom Tasks and Views. Utilize Airplane's pre-built component and template libraries to get started quickly.
To build your first internal tool that makes it easy to monitor your clusters, sign up for a free account or book a demo.


