


Kubernetes is the most popular container orchestration platform currently available and most, if not all, cloud providers offer their own Kubernetes managed solution. For AWS, that solution is EKS. Whether you already have an EKS cluster running or are simply wondering what monitoring aspects are specific to EKS, this article will help you get an idea of what tools and features are available to you.
Monitoring is essential for revealing issues in your Kubernetes clusters, whether those problems arise from your applications or the components of the cluster themselves. Without monitoring and alerting, you would have no idea how to solve a potential problem and are likely to waste time and effort in any resolution attempts. As important as monitoring is, there are dozens of solutions on the market, making the “how to monitor your Kubernetes cluster” question complicated to answer.
In this article, however, you’ll see what to monitor in your EKS cluster and why. You’ll also take a look at some solutions to help you achieve monitoring by using the services available through AWS and from third parties.
What to monitor in an EKS cluster
Using only kubectl to manage your Kubernetes cluster has its limits. You won’t achieve anything efficiently if you don’t implement a monitoring stack, because you lack the ability to process and analyze your data. A monitoring solution will bring you the benefits of alerting, visualization, centralized logging metrics, and events. Let’s first have a look at some best practices and what to incorporate into your monitoring stack if using only AWS products.
Know your limits
You may be at the beginning of your cloud adventure and notice that the limitations set by your cloud provider feel far away. But, what if one day you can’t scale up your application because you run out of IP addresses in your cluster? You will have to fix the problem in firefighting mode during peak hours—the makings of a nightmare.
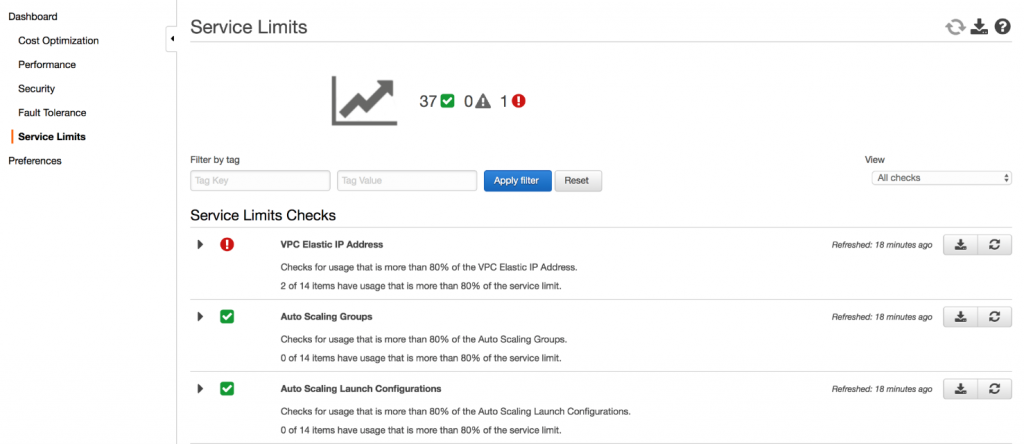
Instead of suffering from AWS resource limits, you should monitor them proactively and set alerts to trigger once you reach a threshold, such as eighty percent of the limit, to give you sufficient time to react. You can count on AWS Trusted Advisor to keep an eye on those limits, as well as a handful of recommendations in terms of cost optimizations, performance, security, fault tolerance, and service limits.
Keep an eye on your nodes
In terms of operation, nodes are the core of the business. A node failure means that all the Pods hosted on it will be ineffective, and while Kubernetes has a mechanism for the cluster to self-heal, you still want to keep an eye on your nodes.
A node is essentially defined by its resources (CPU, RAM, disk, etc.). Keeping your cluster healthy and cost-efficient can be achieved by keeping these resources around sixty to seventy percent. That way you have enough headroom, but aren’t overpaying for resources you’re not using. In the same vein, you should keep an eye on resource distribution to optimize cost by selecting nodes that better fit your workload.
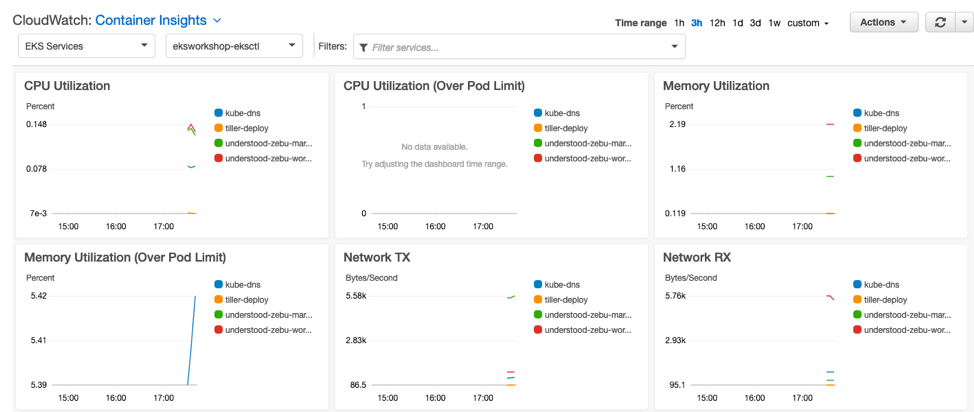
When working with AWS, make sure you deploy the CloudWatch Agent DaemonSet so you can analyze resource metrics in AWS CloudWatch. On top of the resource utilization, you will gain access to the Node health statuses (Ready, MemoryPressure, etc.). However, some find that these states provide only limited information about the root cause of an unhealthy node. To gain even more insight on node-related issues, you should add the Node Problem Detector DaemonSet that generates Kubernetes events regarding node health.
Listen for events
Kubernetes has a built-in event system that can help you detect problems. In addition to the events created by the Node Problem Detector referenced above, Kubernetes provides a handful of additional events out of the box. Here are a few to keep an eye on:
- CrashLoopBackOff: a Pod keeps crashing again and again
- ImagePullBackOff: a Pod is unable to start because the node is unable to pull the container image
- Evicted: a Pod has been killed by Kubernetes (because it uses too much RAM, for instance)
As long as you’ve set up the CloudWatch Agent DaemonSet, Kubernetes events will be sent to Container Insights, a subsection of CloudWatch dedicated to everything container-related (ECS, EKS, Fargate). Then you can create CloudWatch Alarms to be notified when an important event occurs.
Watch your applications
Monitoring an application involves several elements: logs, metrics, traces, and health checks. Let’s take a look at the EKS options available for each of these.
Application logs are not available in CloudWatch out of the box. Collecting logs requires the fluentd DaemonSet. The fluentd application will aggregate all the logs of Pods deployed on a node and ship them to CloudWatch, where you can read them.
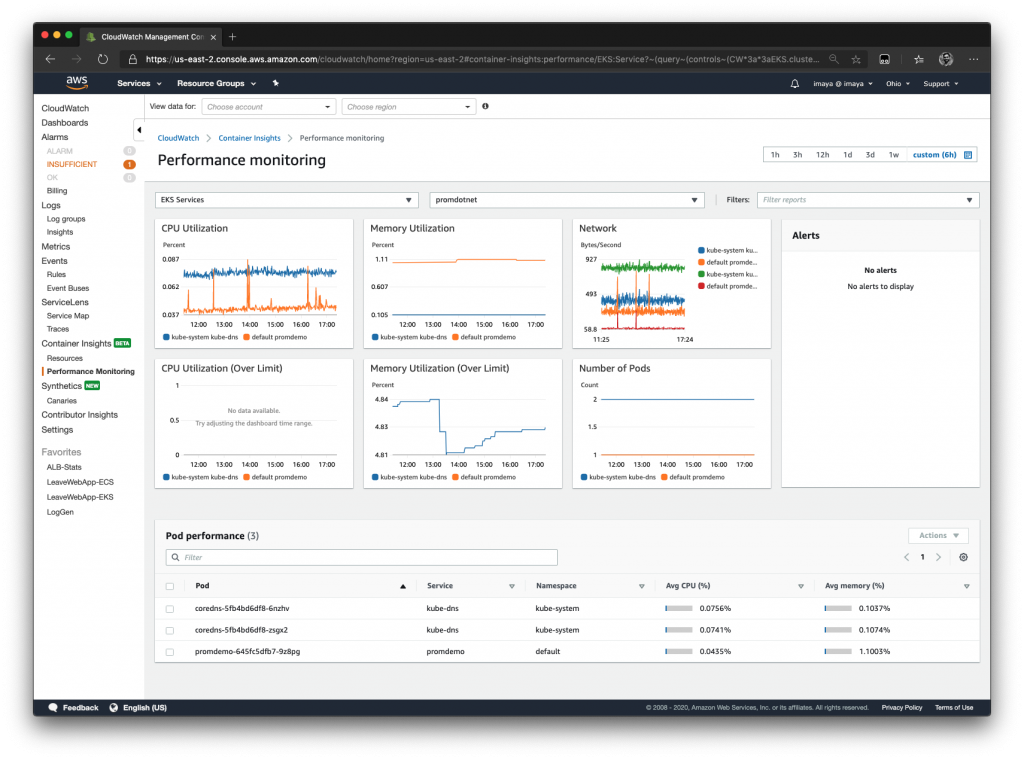
As for application metrics, AWS doesn’t have a dedicated service. Instead, you have to rely on Prometheus. Fortunately, Container Insights supports autodiscovery of Prometheus metrics and will auto-generate a dashboard under the performance monitoring section.
Concerning application tracing and distributed tracing, you should have a look at AWS X-Ray. This product enables tracing not only between applications on EKS, but also with other AWS services such as AWS Lambda, DynamoDB, and others.
Finally, the most common way to monitor the health of an application is AWS CloudWatch Synthetics Canaries. The canaries are scripts that are executed periodically. The advantage of using canaries is that calls are executed the same way your user would execute them, outside of your network and using a headless Chrome Web browser, making them ideal for health checks and smoke tests.
AWS built-in solutions for monitoring your EKS Kubernetes cluster
In the previous sections, you learned about what aspects to monitor in your Kubernetes cluster and were introduced to some great AWS tools that can help. Before moving on, let’s review some final thoughts on what needs to be done if you decide to go in that direction.
First off, you will heavily rely on CloudWatch as the central dashboarding and alerting system. CloudWatch won’t know about your cluster out of the box, so you will need to set up some exporters to have logs and metrics coming in. CloudWatch Agent will be in charge of collecting nodes, metrics, and events, while fluentd will be responsible for aggregating and shipping application logs. AWS X-Ray can be leveraged to achieve distributed tracing, and you can rely on Prometheus to collect application metrics.
The managed Prometheus and Managed Grafana options seem very tempting. Prometheus is the most popular option to handle application and system metrics. While AWS Container Insight is able to discover those metrics and create a dashboard, Grafana is a better option for dashboards as they look much better. Grafana is commonly used as the de facto UI for Prometheus, so the integration is seamless and you can benefit from the existing Kubernetes dashboard template.
One option also worth mentioning is AWS Elastic Service, the managed Elasticsearch solution provided by AWS. The ELK stack (Elastic-Logstash-Kibana) can replace all the tools we mentioned earlier, centralizing the solutions in one spot, but it has a steep learning curve. If you decide to go this route, you’ll want to make sure you know what you’re doing.
Final thoughts
Monitoring your Kubernetes cluster is essential, and there are many sources of information to track: service limits, Kubernetes events, node health and resources, and application logs and metrics. If you are running an AWS EKS cluster, you have at your disposal an AWS solution that covers all of these use cases.
However, monitoring solutions built using AWS services may feel like a patchwork of technology, where you have to learn and remember where to look for each particular use case.
Since the AWS offerings may not be the most user-friendly way to monitor your cluster, be sure to consider a SaaS provider, like Airplane, that makes monitoring Kubernetes clusters easy. Airplane is the developer platform for building custom internal tools. With Airplane, you can build internal workflows and UIs to track application metrics and ensure issues and debugged quickly and efficiently. With Airplane, you also get all of the essentials to monitor your application with out-of-the-box audit logs, notifications, approval flows, and more.
To build robust internal tools with minutes that make it easy to monitor your applications, sign up for a free account or book a demo.


