


Modern online applications are loosely coupled to provide flexibility and fault tolerance. However, this implies that numerous pieces of software are working together to run the application. Various data points from multiple application parts must be collected and monitored to ensure the application’s best efficiency and performance. This is known as Application Performance Management or Application Performance Monitoring (APM).
APM describes the process of examining application performance, availability, and user experience and then using this data to find and fix application issues before they impact customers. Monitoring applications is an essential step for understanding how applications can be scaled down to save money or scaled up to meet demand, as well as knowing when they are available and when they fail.
Django, based on the Model-View-Controller architecture, allows for the ease of building, publishing, and regularly maintaining applications. Monitoring a Django web application is crucial for developers who want to expedite the development lifecycle and accommodate code audits. A good Django monitoring solution can automate application performance monitoring, simplify metrics tracking and reporting, visualize application bottlenecks, and speed up the debugging process. Furthermore, good Django monitoring can assist developers in understanding and quickly resolving application performance issues caused by web server overload, databases, or network bandwidth.
In this article, you’ll learn how to best monitor Django applications, including some best practices and recommended tools to use.
Note: This article is meant for Django developers and software engineers who want to implement monitoring efficiently. Thus, a prior understanding of Django development is necessary to proceed.
Monitoring concepts every Django developer should know
First, let’s take a look at some crucial monitoring metrics and concepts before diving into the details on monitoring Django applications. Here are a few things to keep in mind when it comes to monitoring applications:
- CPU Usage: At the server level, you should monitor CPU usage, memory demands, and read/write speeds to ensure that usage doesn’t affect app performance.
- Error Handling: You should be able to measure how frequently the app’s performance decreases or fails (resulting in errors) at the software level. Error handling is the first line of defense for detecting application issues.
- Downtime: Avoiding downtime and evaluating every transaction’s availability, response time, and behavior is critical in the digital economy.
- Response Time: Average response time is a measure that indicates whether or not speed impacts app performance. So, when you encounter application slowness, you must establish why your application is slow, how long it has been running slowly, and what is causing the slowness.
- Request Rates: This indicator helps analyze the amount of traffic that the application receives—any spikes, idleness, or concurrent users.
- Customer Satisfaction: The most important metric is how users feel about their experience after or while using the application. Thus, user satisfaction and error tolerance are two primary factors when monitoring applications. Error tolerance refers to how an application reacts to the user’s errors; if any user action is not feasible, the application should inform the user and allow easy error correction while supporting the user as much as possible.
Built-in tools for Django application monitoring
There are a lot of ways to get started with monitoring Django applications. One of the most straightforward, built-in solutions for doing so is using Django Admin’s LogEntry model. Any time a user adds, deletes, or modifies an object in the Django Admin panel, the activity is logged in a database table named Django Admin Log, which keeps a record of any fields that were altered; including information regarding action time, user, object ID, action flag, and change message attributes.
To see the LogEntries in your admin panel, include the following code in your app’s admin.py file:
After this, restart the server and log in as the superuser. You should be able to see all the logs and monitor all the activities that have happened on the Django admin panel, as pictured below:

Another built-in way to keep track of the server errors in Django involves automatic emails sent to site admins whenever a user triggers a server error (including traceback errors) and requests context information. To enable this error reporting, you only need to set the admins who will receive the reports. Set the ADMINS configuration to the respective users in settings.py as shown below:
These methods can help track down individual bugs and errors and are suitable for projects of varying sizes. However, note that they may not be helpful in a few scenarios, such as:
- If you want to generate error reports only from certain modules of the application.
- If you want to explicitly decide and define what kind of information and metadata is sent in the error reports, as well as their format.
- If you want to categorize the error reports based on severity or priority.
- If you want to search through the error reports and logs for metadata (timestamp, log level, line number, process, etc.).
- If the Django application server crashes due to internal bugs.
Popular tools for Django application monitoring
Having looked at the built-in ways to monitor your Django application, now let’s discuss some other popular tools on the market that you might implement into your monitoring strategy.
Prometheus and Grafana

Prometheus is an open source system for monitoring infrastructure and applications cost-effectively and straightforwardly. It operates on a pull-based paradigm in which metrics are collected in memory and subsequently exposed through the HTTP endpoint /metrics, from which Prometheus regularly pulls metrics data and saves the exported data in its database.
django-prometheus is a popular package for generating Prometheus-style monitoring metrics from Django applications. It provides metrics for requests and responses and cache and database operations. It also lets you add custom metrics to measure anything relevant, like new monthly subscriptions or user sign-ups.
Meanwhile, Grafana is used alongside Prometheus to create interactive graphs of the metrics stored in the database.
Solarwinds appoptics
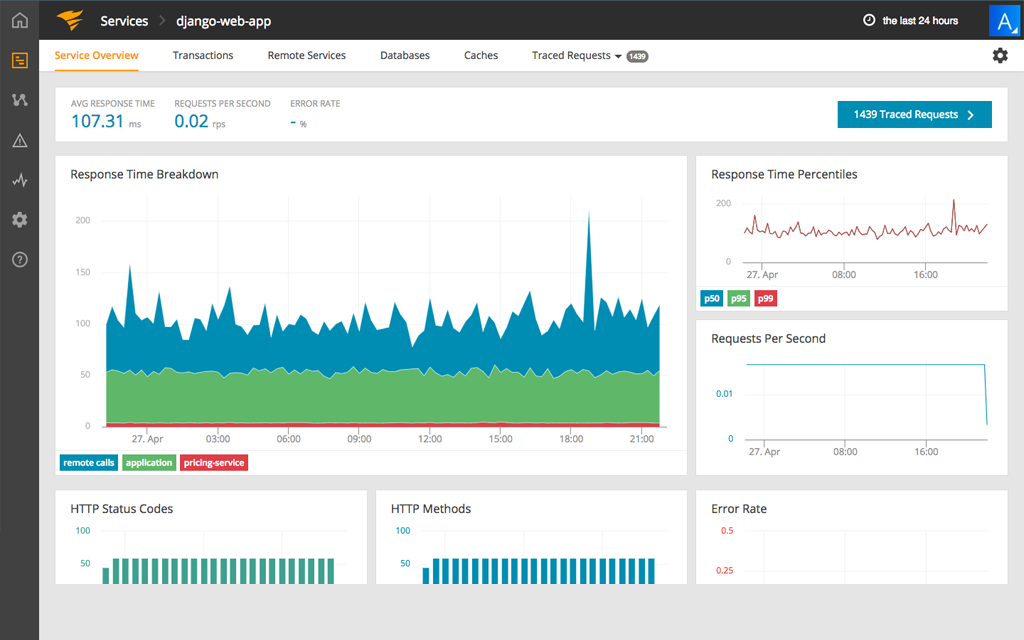
Another popular APM solution is Solarwinds appoptics, which enables continuous monitoring and visibility of the complete application stack in a single view of web servers, databases, and services to assess application performance. AppOptics offers a dashboard with an intuitive UI, comprehensive documentation, and distributed tracing functionality that helps developers troubleshoot faster.
Setting up AppOptics Monitoring for your Django application is very simple and straightforward. All you need to do is to follow the steps below.
First, install the APM agent package using the following command:
Then add the service key as an environment variable and make it available to the application as follows:
A service key is made up of an API token with write permissions and the name of the service being installed. The onboarding sequence at AppOptics offers the entire service key, or you can get a token and fill in the service name yourself by visiting the API Tokens page.
Finally, import the AppOptics agent and add it as a middleware to settings.py:
Now you can start the application and make some requests, and you will find the trace events reported on your AppOptics dashboard. Read about more configuration options here.
Atatus

Atatus is a real-time APM that captures all the requests to the Django application without requiring any changes in the source code and provides a visualization along with vivid analysis of how the transaction methods, API failures, database queries, and external requests might be impacting the end user experience.
Using the quick steps below, you can easily set up Atatus and gain end-to-end visibility of your Django application.
First, install the Atatus Python agent using the following command:
Then add atatus.contrib.django to INSTALLED_APPS in your settings.py:
Next, add the license key and app name in your settings.py:
You can generate the license key for your app by logging in to the Atatus dashboard as the account owner or admin and navigating to Settings » Account Settings. Go to the License Keys tab, where you’ll get your APM license key.
After that, just restart the server and make some requests. You’ll see your application’s metrics in just a few minutes on the Atatus dashboard.
Scout APM
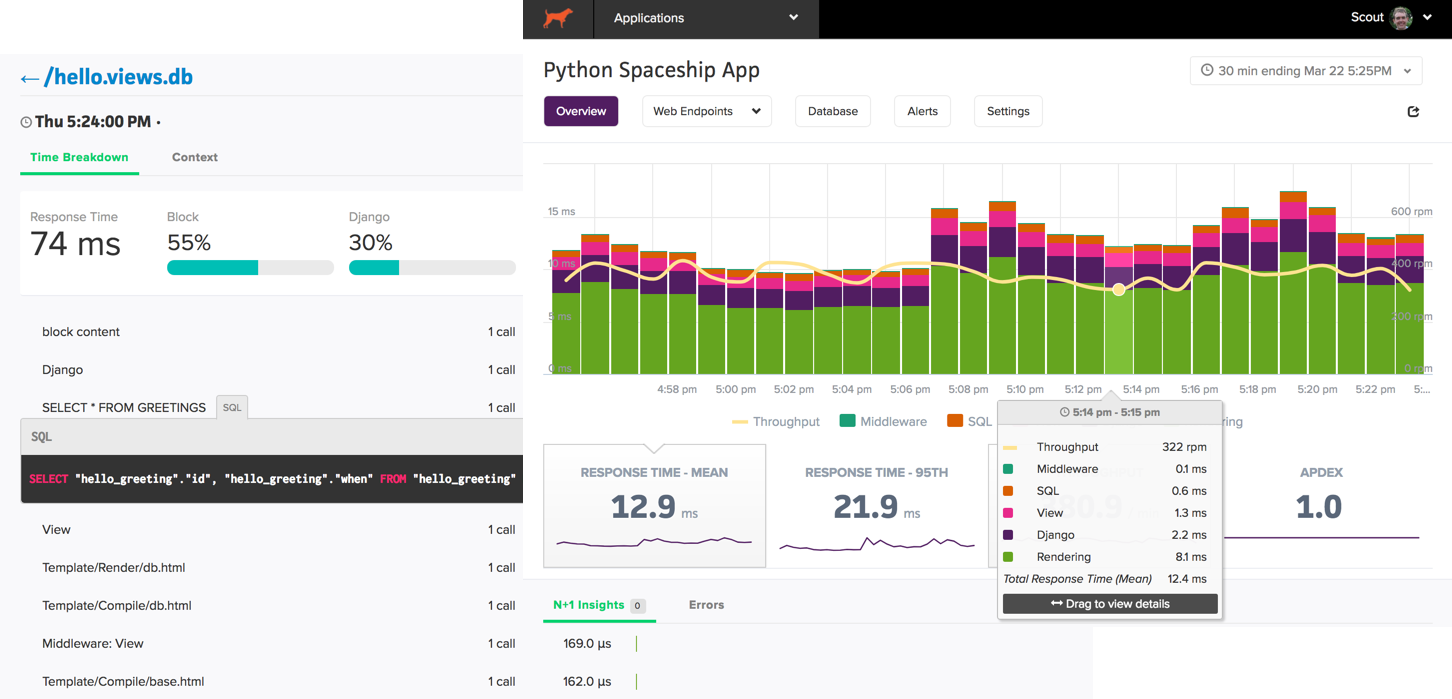
Finally, Scout apm is another popular tool that identifies the specific codes that can be the root cause for sluggish response times. Its improved query monitoring for databases enables users to observe and discover costly database queries to optimize performance. It also includes memory bloat diagnosis and integrated charts for a more detailed view of health data.
Here are some general instructions for setting up Scout apm with your Django application.
First, install the Scout apm package using the following command:
Then add Scout configurations in your settings.py file:
Optionally, you can also store your Scout configurations as environment variables.
Lastly, add Scout middlewares to your Django application as shown below:
And that’s all—now you can make requests from your Django application, and the metrics data will be reflected on the Scout UI in approximately five minutes.
Read the complete set up steps for Scout apm with your Django application here.
Architectural decisions helpful for monitoring
The ease (or complexity) of implementing monitoring solutions in your application highly depends on the architectural decisions that you make along the way in development. Here are a couple of things you’ll want to consider before moving forward to implement monitoring:
Deployment options
There’s a tremendous difference between the development and production environments, and thus, deployment infrastructure should be well-thought-out and carefully set up. Essential factors to be considered while making decisions related to deployment include the following:
- Traffic estimation on the web application
- The cost of data and computing resources required to meet the demand
- The level of scaling horizontally (adding more machines) and vertically (upgrading to more robust machines), and respective costs
- The location of data centers
- The application’s historical uptime and downtime performance
- Limitations of the host providers in terms of storage, live time, etc.
These deployment considerations are essential in determining the most suitable monitoring solution for your application.
Threading awareness
Django applications often implement multithreading and multiprocessing features, using threading or django-celery packages to perform asynchronous tasks. However, monitoring the status of threads of a main thread is a very challenging task, and most of the current monitoring tools fail to fetch the correct CPU usage or even call count information per coroutine.
If a Django application uses a single thread for execution, then it is easy to choose an APM tool. If your Django application has implemented multithreaded execution, though, you will need to use additional solutions like Loguru, datadog-threadstats-module, celerycam, celeryev, celerymon, or a custom camera to maintain a record of task and worker events.
Thus, threading awareness is an important consideration in choosing a suitable APM tool.
Best practices for application monitoring in Django
Django is not the fastest framework for development, and if not used optimally, a Django application may encounter bottlenecks. Developers should exercise caution when implementing the use case at hand in Django due to its monolithic characteristics, such as its reliance on ORM for most operations and the deployment of all collective components. Furthermore, setting Django on the fly may result in mismatched components, which becomes a major issue upon deployment.
Thus, whatever combination of tools are at your disposal, here are some of the best practices to follow when implementing application monitoring in Django:
- Monitor all the requests to and from your Django application, including the network calls made to any third-party apps or microservices. This can help you understand how each request impacts the app performance.
- Always include database monitoring to identify time-consuming database queries and obtain a comprehensive overview of database performance.
- Identify transaction traces to visualize which functions are being executed at each endpoint, from where they originate, how much time they are consuming, and where to debug to optimize the application further.
- Correlate the logs, hosts, and runtime metrics to each transaction to get a clear overview of how they affect the application.
- Ensure that the search index is healthy, if there is search functionality in the application.
- Always gather errors and exceptions with trace back details.
- Maintain a centralized logging solution, as the log data usually acts as the eyes and ears of developers once their applications are deployed.
- For critical issues, make sure to have an alerting system in place. For example, you can send alerts on telegram, Slack, SMS, or via call.
- Choose an appropriate APM solution that has a focus on managing apps built using Python or Django in particular, and that can help you monitor your infrastructure stack to ultimately help connect the dots between app performance and business outcomes.
Now, consider huge Django apps that are deployed using Kubernetes, a free and open-source container orchestration system that helps automate software deployment, scalability, and management.
Final thoughts
As you have seen, monitoring is a crucial part of Django development, allowing you to gain key insights and keep an eye on the overall health of your application and infrastructure. It enables developers to go deeper into the data for faster troubleshooting and a more satisfactory user experience.
If you're looking to build a dashboard to streamline your monitoring processes, try out Airplane. Airplane allows you to transform scripts, queries, APIs, and more into powerful workflows and UIs. Use Airplane Views to quickly build React-based UIs that allow you to monitor the health of your application in real-time.
To build your first internal UI, sign up for a free account or book a demo.


