


With the proliferation of microservices and distributed systems, there has been a need for every system or service to be tracked. This has brought about the usage of tracing tools, which help users better understand how a system behaves by tracking, finding, and diagnosing errors in multi-tiered applications.
The practice of distributed tracing offers many benefits, but its core uses involve observability and ensuring the correctness of services. When part of a system goes down, today’s tool can easily trace through the system to find where an error occurred, as well as the cause of the error. This could otherwise take engineering teams hours, or even days, if they attempt to figure things out manually. Tracing is highly useful for automation, visualization, and scalability, in addition to being very cost-effective. Some tracing tools can even be used to visualize latency issues by monitoring a system after deployment to compare the performance of the system at different periods.
Tracing tools can help with answering questions like the following:
- How long did a request take to complete from the moment it reached the first service to the moment a response was sent to the user?
- If an error occurred during processing the request, what was that error and where did it occur? Since distributed tracing tracks the request throughout the entire application stack, the exact service which produced the error can be located easily.
In this article, we’ll explore features and details of eleven of the leading tracing tools to use in 2022. To compile our list, various factors were considered, including the following:
- Availability
- Ease of use
- Core pillars of observability (i.e., accurate metrics and logs)
- Configurability
- Compatibility
- Developer experience
- Cost
- Brand credibility
There are a number of existing tools out there that you may or may not have come across. That said, let’s dive into these eleven awesome tracing tools to consider using in 2022.
Jaeger
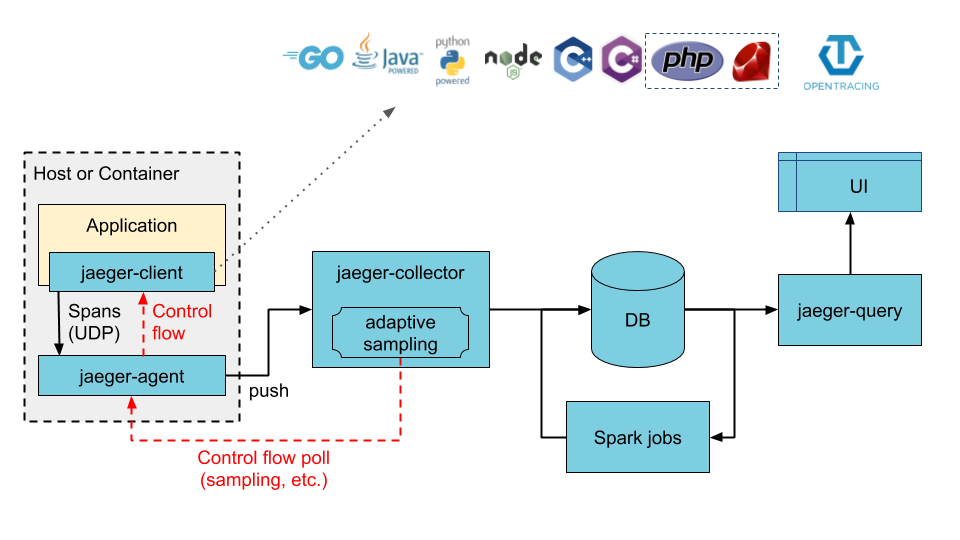
Jaeger is an open-source, end-to-end distributed tracing tool whose architecture was inspired by Google’s Dapper system and OpenZipkin.
Jaeger provides a backend which does all the heavy-lifting of the tracing work and a web UI that can be used to visualize the spans. Jaeger supports the OpenTracing standard out of the box and lets you store the traces in the database of your choice. It supports Cassandra and Elasticsearch by default, but community efforts have made it possible to run Jaeger with other databases like InfluxDB and DynamoDB, to name a few. The backend components also expose Prometheus metrics by default, making integration with Prometheus a breeze.
Jaeger provides client libraries for many mainstream programming languages, such as Go, Node, Java, Python, C++, and C#. However, the client libraries are being deprecated in favor of OpenTelemetry clients. Additionally, its main repository has over 14,000 stars (as of the time of writing this article) with a high number of contributors.
Some of Jaeger’s use cases include the following:
- Service dependency analysis
- Performance and latency optimization
- Root cause analysis
- Service dependency analysis
- Distributed context propagation
Since Jaeger is an open-source tool maintained by Cloud Native Computing Foundation, it is free to use and can be contributed to by the general public.
New Relic
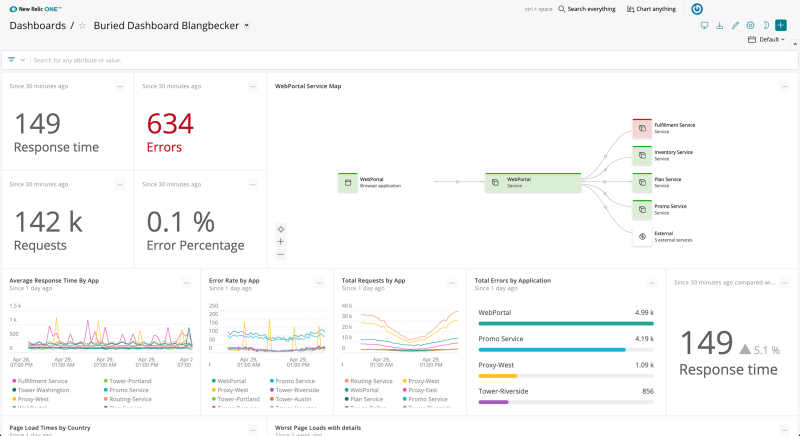
New relic is an observability platform designed to work with full-stack applications. One of the main features of New relic is how it brings together relevant data from various stacks of your technologies to show you how your entire system works. Shortly after signing up, you’ll begin to receive important performance data for your web app, including browser response time, real-time web transactions, and a log of database activities to see which queries may be causing trouble. A tool that captures, organizes, and makes sense of all your data so that errors can be easily tracked is highly advantageous.
Some of New relic’s key features include the following:
- New relic can act as the single source of truth for all your operational data. You can not only instrument your code, but also your entire infrastructure, including Linux, Windows, AWS, Azure, Google Cloud Platform, Kubernetes, Docker, and more. By putting all your logs in one place, New relic makes analyzing and understanding the operational metrics extremely easy.
- New relic offers a data explorer that can help you visually analyze your data without having to write any queries by hand. The New relic Query Language is an SQL-like query language that offers advanced querying capabilities to better analyze your data.
- New relic offers more than 400 integrations and agents that can connect to almost any component of your infrastructure, including GCP, AWS, Azure, Kafka, Jenkins, and many more. OpenTelemetry is supported as well.
- With New relic, you can get real-time alerts in Slack and other collaboration tools, along with in-depth analytics so that you can respond to anomalies quickly.
New relic has a free plan that offers 100 GBs per month and one full platform user. The “standard” plan starts at $0.25 GB per user for those using up to 100GB per month, $99 for full platform users, and $49 for core users. For other plans, such as Pro and Enterprise, companies can contact New relic’s sales team for more information.
Dynatrace
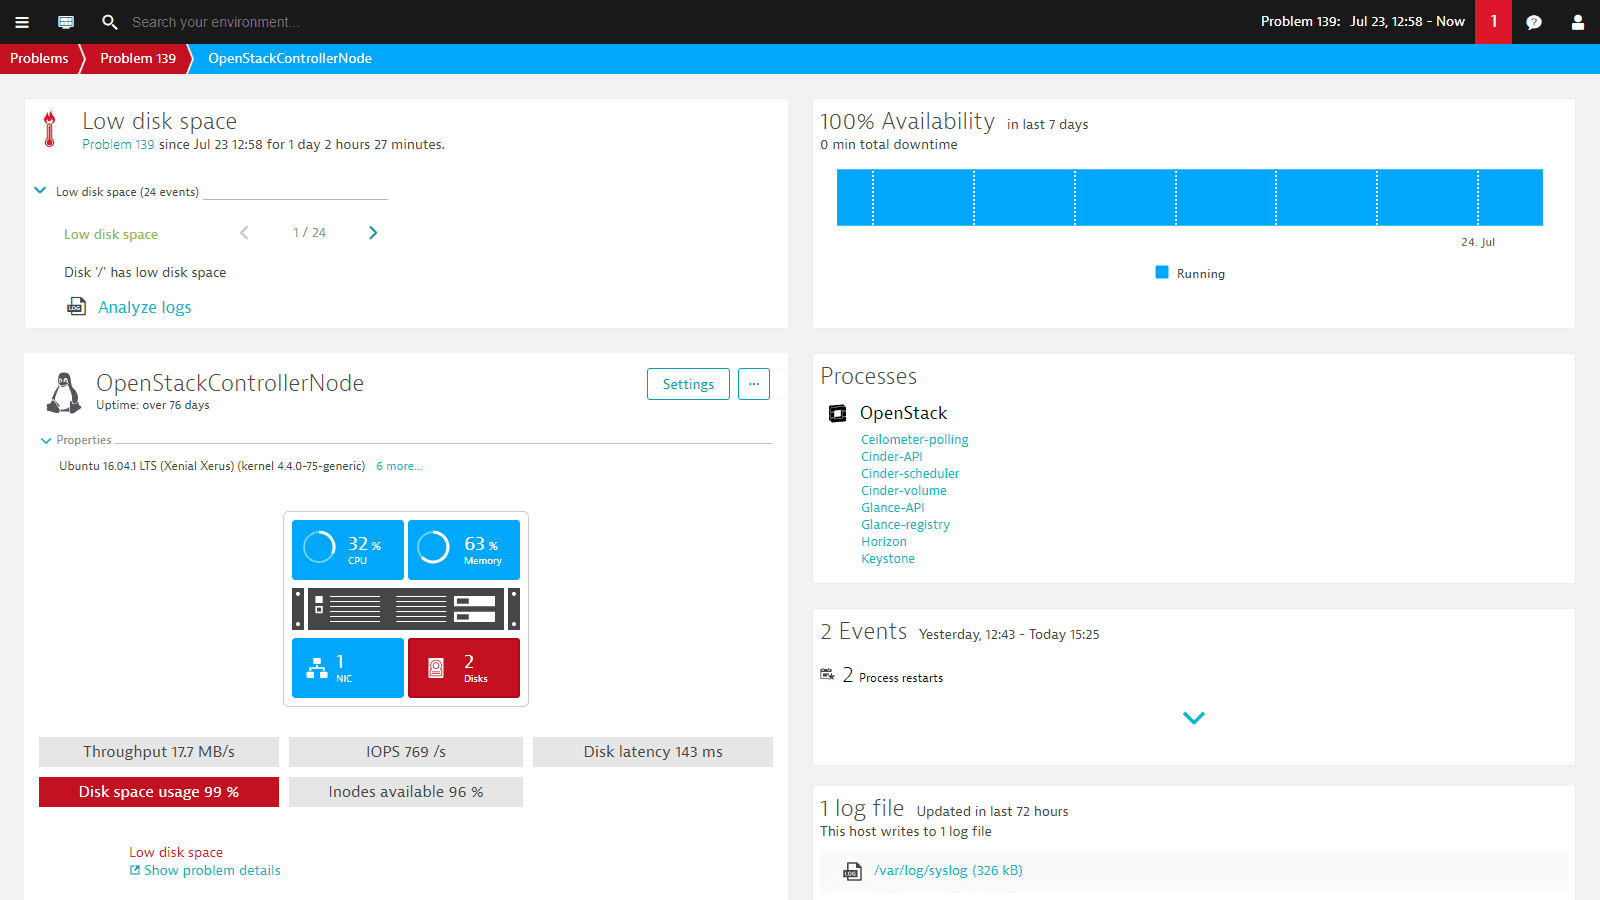
Dynatrace is an “all-in-one” platform for observability, automation, AI, and application security. Deploying Dynatrace is as simple as installing an agent with a line of code, and it automatically detects everything in your environment. This means there is zero configuration required while setting it up. Dynatrace provides a comprehensive view of everything going on in your application environment.
Some of Dynatrace’s key features are as follows:
- Dynatrace supports the OpenTelemetry standard.
- Dynatrace analyzes the performance of all user interactions. It analyzes the application’s availability and the performance of all the infrastructure components. Dynatrace can also instrument Android and iOS mobile apps.
- Dynatrace can instrument server-side services, including web services, web containers, database requests, and custom services. It’s also capable of monitoring the hosts, processes, and network of the infrastructure.
- Dynatrace integrates with cloud platforms such as AWS, Azure, GCP, and Heroku and container platforms like Docker, Kubernetes, and OpenShift to provide feedback metrics to a single display across a hybrid multi-cloud environment.
- Dynatrace seamlessly integrates with solutions like ServiceNow to enable features like automatic ticketing and real-time updates.
- Dynatrace provides extended observability with custom log metrics, as it writes log data to a log file.
- Dynatrace excels in application security, enabling the fast and secure delivery of applications with automated runtime vulnerability detection.
Dynatrace’s full stack monitoring services are available for $69 per month for 8GB per host, though they have many other service options available.
Honeycomb
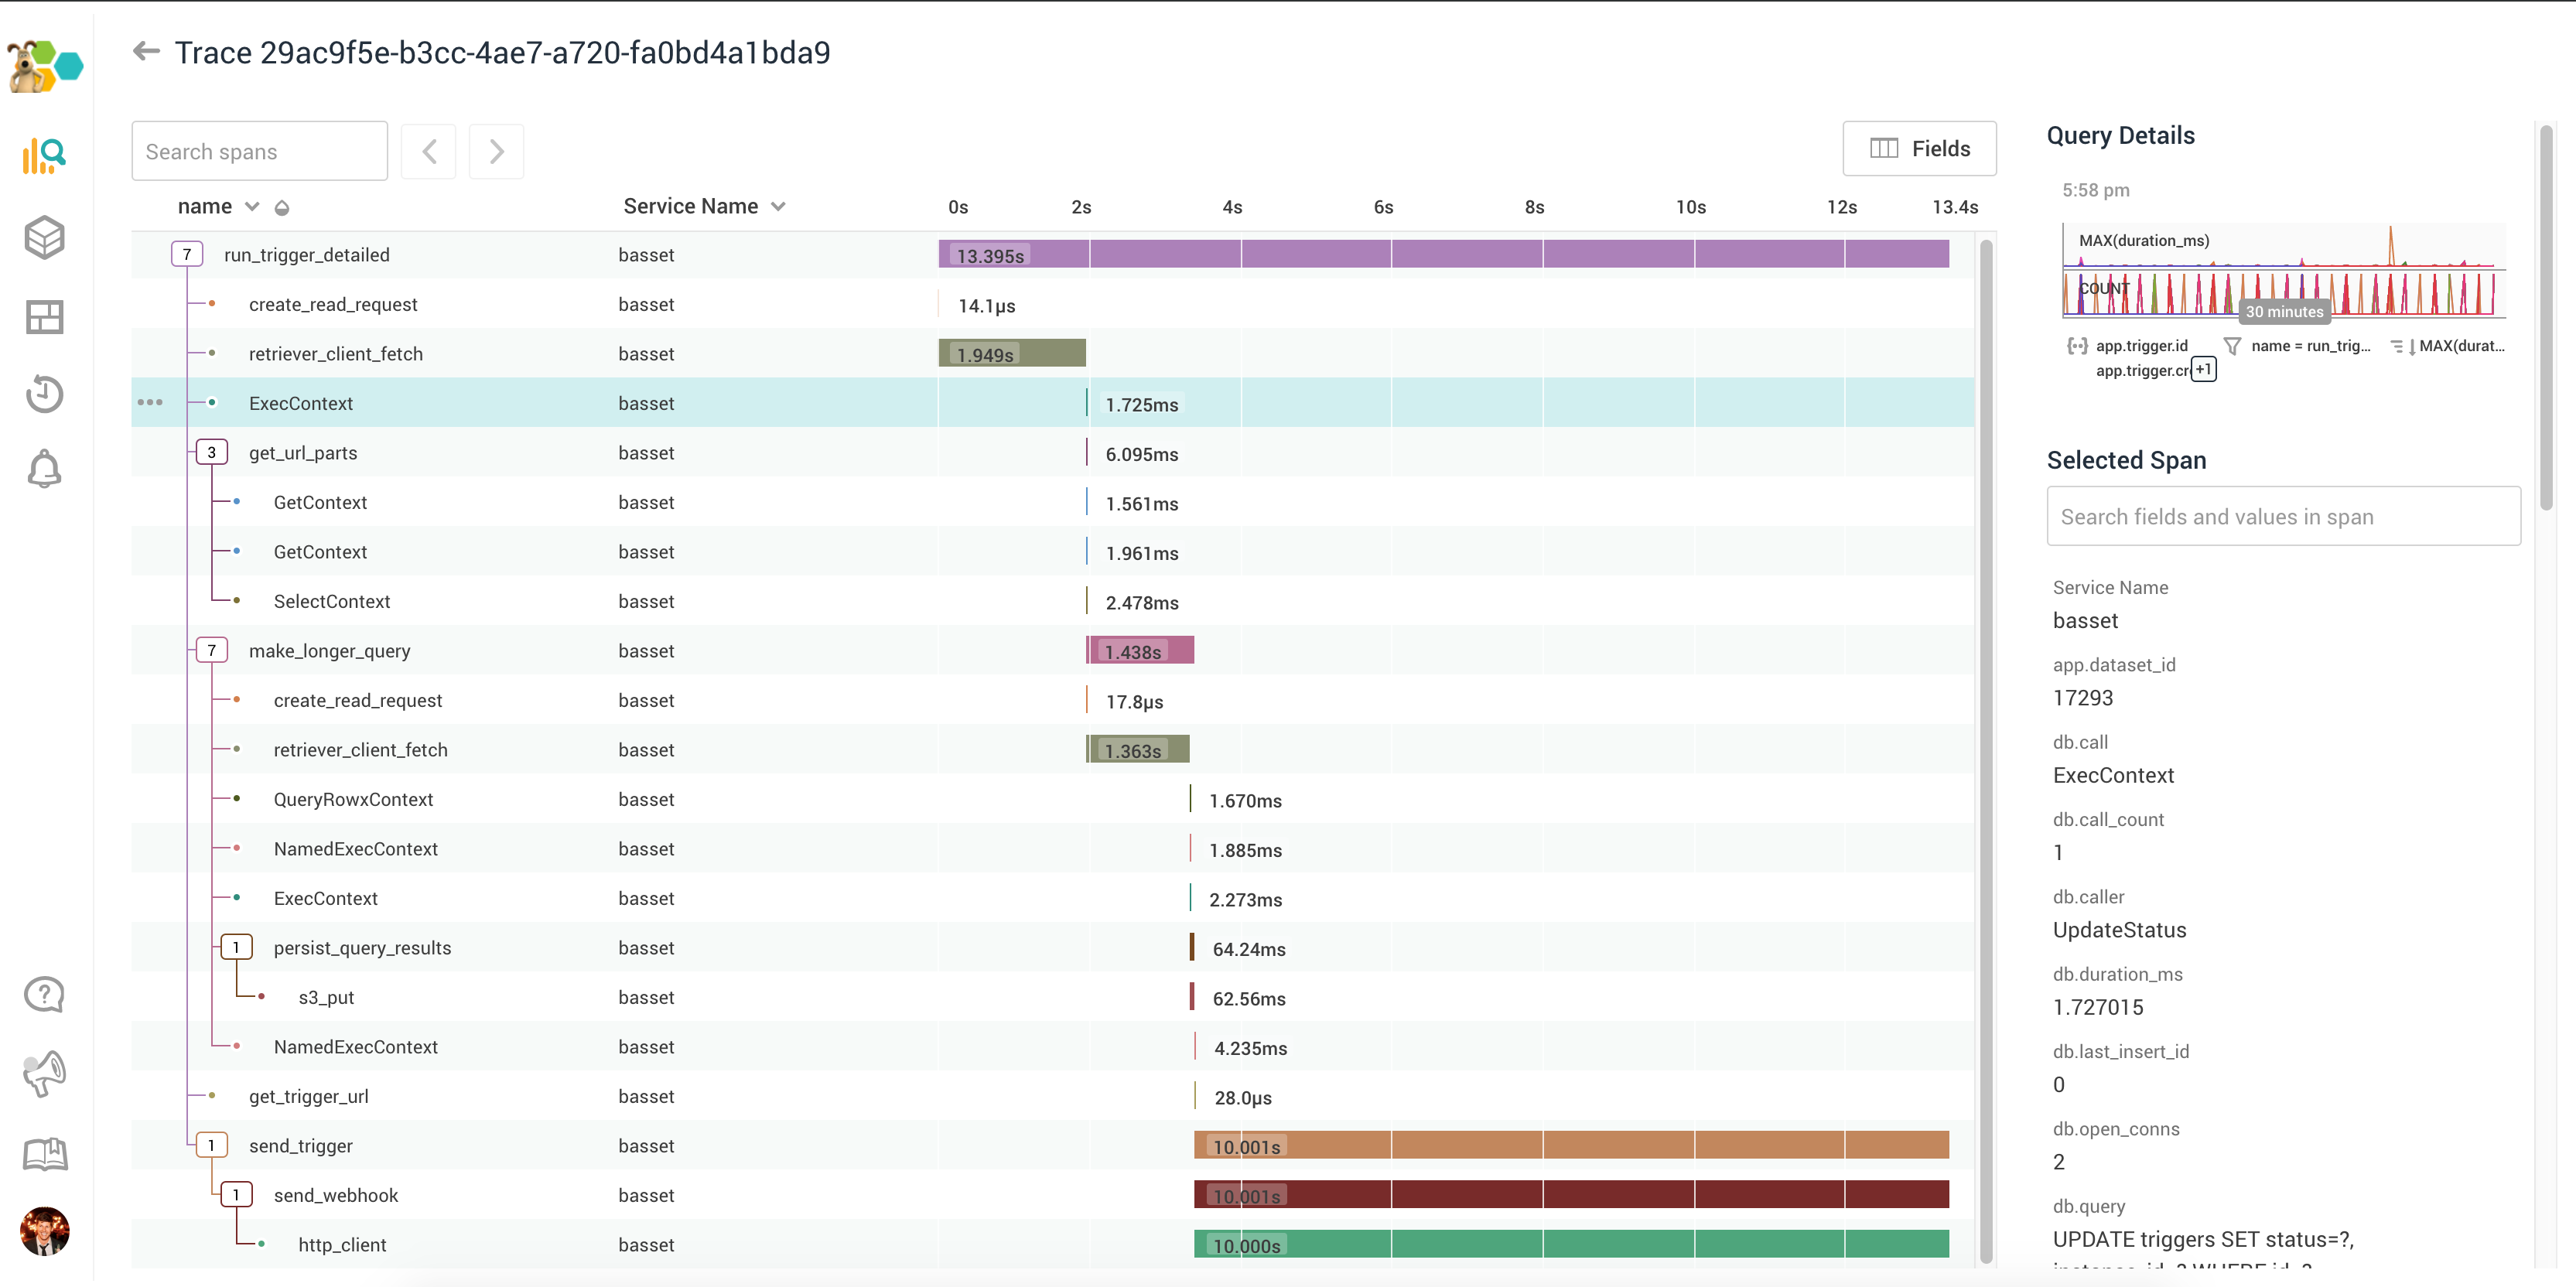
Honeycomb is an extremely fast data-tracking engine. Though sophisticated and highly dimensionalized, you can answer questions as to what’s going on in your system in seconds, with signal graphs that represent events in production. This could be as simple as clicking on a trace ID to launch directly into the tracing view. Regardless of how complex your system is, Honeycomb provides a seamless view of all the events happening in your system.
Here are some of Honeycomb’s key features:
- Support for the Opentelemetry standard.
- A powerful querying capability that offers incredible flexibility in querying data.
- Collective intelligence, which allows efficient debugging when the whole team uses Honeycomb, as system issues are captured and accessible to everyone.
- An intuitive UI that lets you visualize data and instantly spot any outliers.
Honeycomb offers three pricing options, including a free plan which includes limited services. The Pro plan costs $100 per month and includes more features, such as an unlimited number of triggers per month, and the Enterprise plan includes even more features and support and starts at $24,000 per year.
Lightstep

One of the really powerful things about Lightstep is its ability to dynamically create a pictorial representation of every query that you run with real-time analysis of trace data. Also, if your application is depending on third-party services, Lightstep might be a good option for you, as it detects your system’s latency versus the calling service itself.
Some of Lightstep’s key features include the following:
- It automatically detects changes to your application and infrastructure and highlights the specific causes of any performance issues.
- A super-fast time-series database that can produce system-wide insights in seconds.
- It provides dynamic service maps and immediate root cause analysis across traces, logs, and metrics from the entire infrastructure.
Lightstep has three payment options, including a free Community plan that offers limited features. The Teams plan is a service-per-month based plan in which one active service costs $100, ten active services average $99 per service, and twenty active services average $97 per service. Finally, the Enterprise plan provides a robust list of features, pricing for which is available with volume discounts via Lightstep’s customer support team.
Splunk
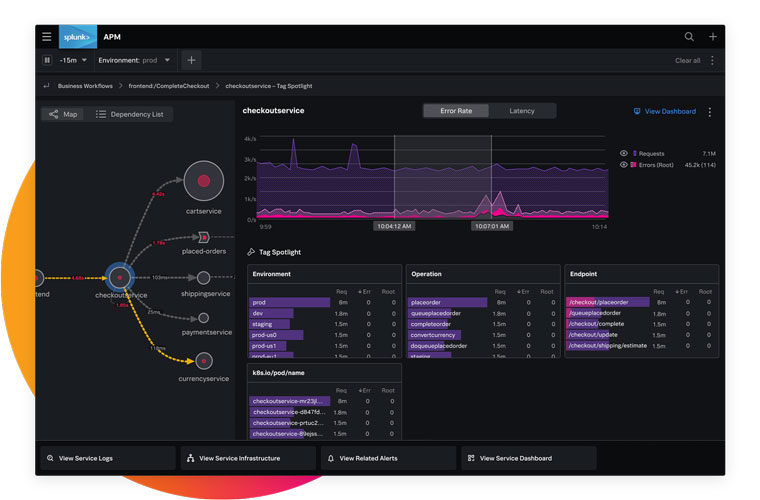
Splunk’s most striking feature is its unique and helpful AI-driven analytics that reduce investigation time by alerting you on pertinent patterns in seconds. Splunk provides its users with three search modes: fast mode, smart mode, and verbose mode. These allow you to experience the best of tracing, with each mode’s functionality built depending on how thorough you need to go while tracing.
Some of Splunk’s key features are as follows:
- Fast issue resolution using modernized monitoring engineered with speed and advanced analytics
- Full-stack visibility using KPI-driven insights
- Predictive machine learning, which is used to identify and respond to priority incidents
Splunk’s pricing starts at $15 per host per month, billed annually.
Zipkin
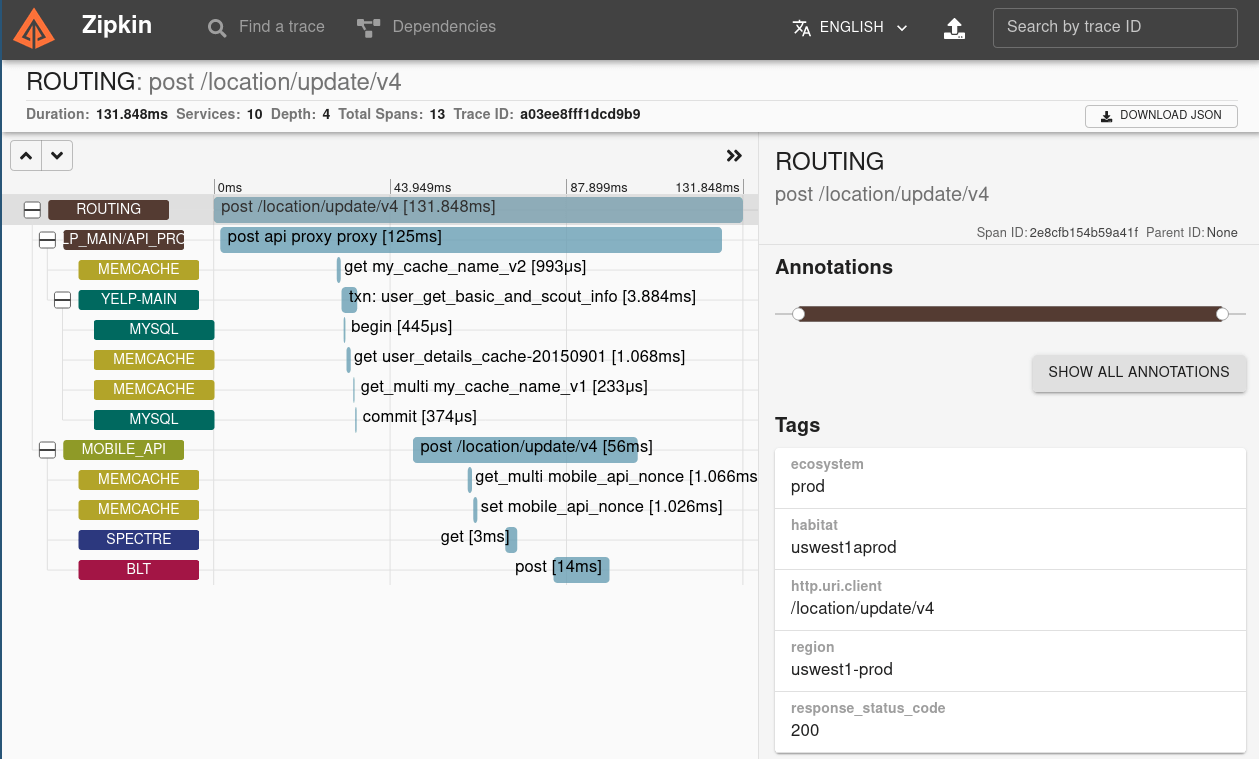
Zipkin was built by Twitter and is a distributed tracing tool that helps in gathering data used to troubleshoot latency issues in systems based on the open tracing standard. Zipkin provides detailed, structured logging for individual requests. Understanding how Zipkin works is quite straightforward. There are four key events that take place while using this service:
- Server receives events
- Server sends events
- Client receives events
- Client sends events
Zipkin’s architecture has four major components:
- Zipkin Collector performs lookup functions on trace data
- Storage for data currently supports Cassandra, MySQL, and ElasticSearch
- API queries and extracts traces
- Web UI allows users to view traces
Zipkin is an open-source project that can be used freely.
Datadog APM
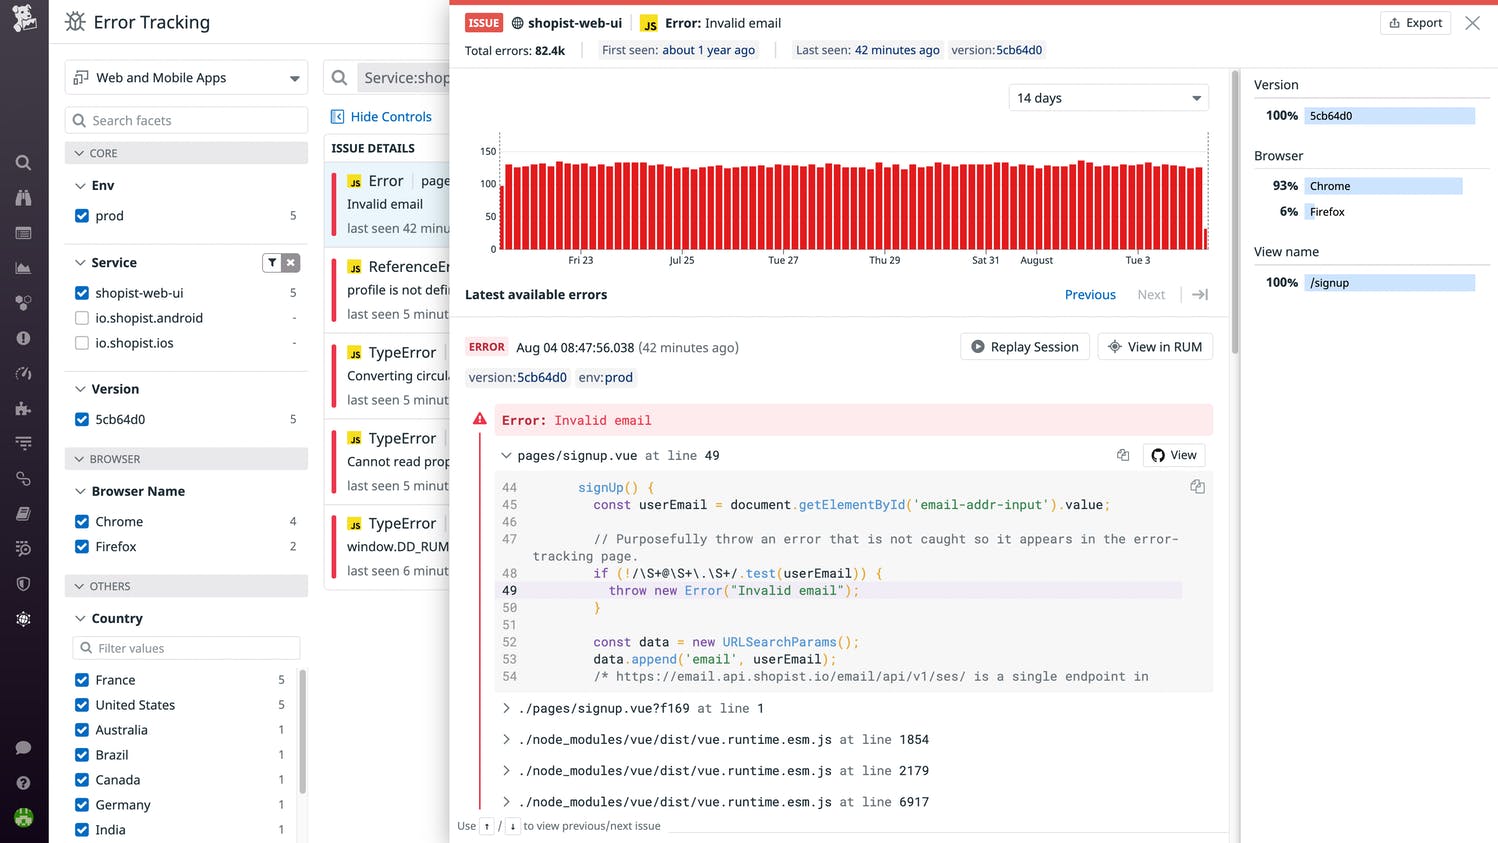
Datadog Application Performance Monitoring (APM) helps implement a full breakdown of backend and code-level engagements, and also receives and visualizes frontend data. This tool enables you to conduct a search of your traces by any tag for real-time visibility. For each request, Datadog makes it simple to navigate from the trace to the logs and provides key information, such as infrastructure metrics and runtime metrics. Finally, it guarantees end-to-end application monitoring from mobile apps to web browsers, all the way down to individual queries.
Here are some of Datadog apm’s key features:
- With more than 500 integrations available, Datadog seamlessly connects to your infrastructure components to aggregate metrics and events.
- It supports OpenTelemetry standards so that you can use open source tracing libraries.
- Datadog auto-generates service overviews and produces performance graphs for easy visualization.
- Datadog automatically collects logs from all services, applications, and platforms and lets you analyze them with powerful visualizations.
Datadog apm offers three pricing options which include a Free plan, a Pro plan available at $15 per host per month, and an Enterprise plan available at $23 per host per month.
Site24x7 APM
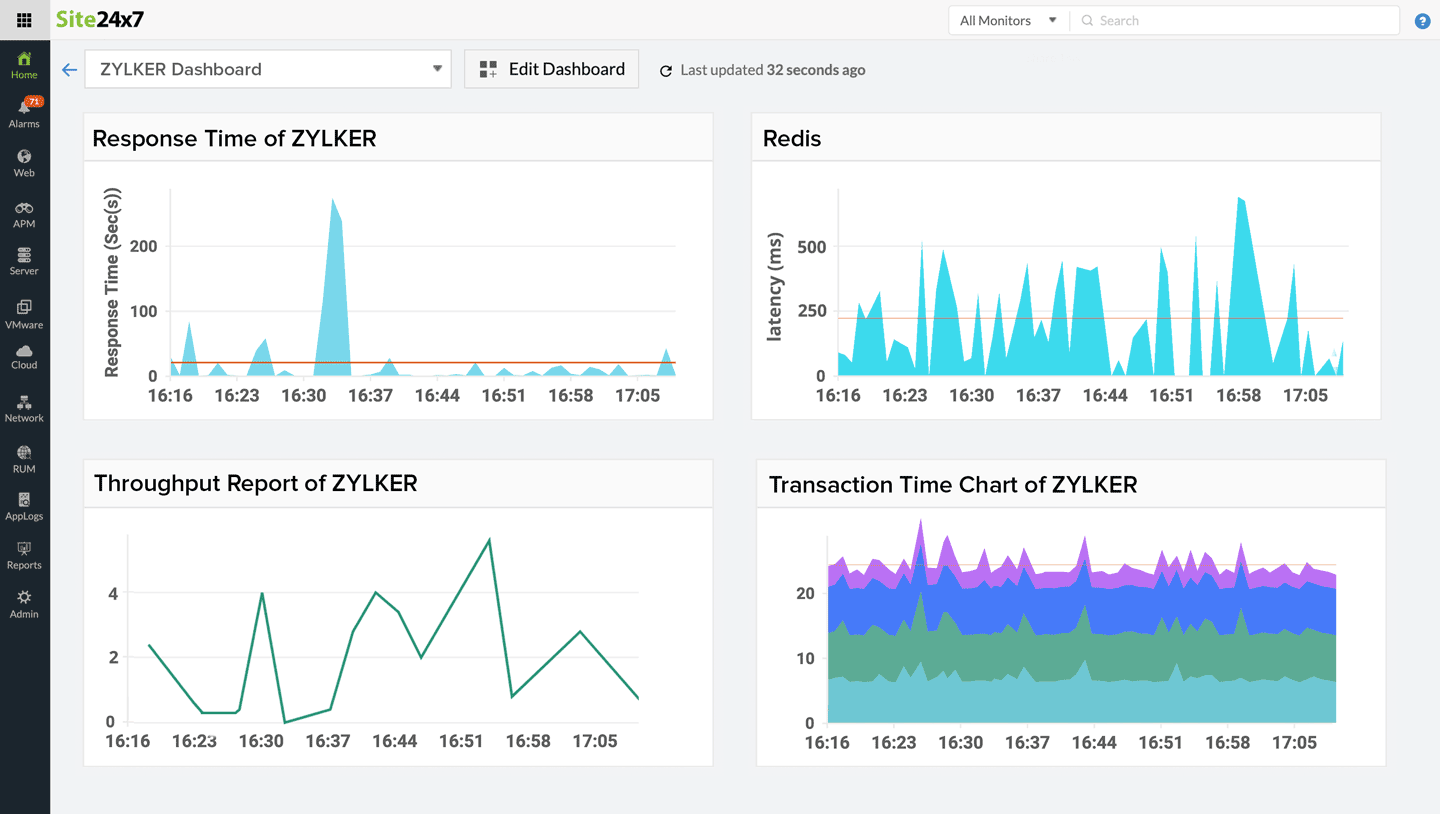
Site24x7 APM works by accessing performance gaps and measuring the impact of errors on application performance. Every transaction in your application is broken down into its individual components so you can easily identify and optimize slow transactions. Site 24x7 provides an all-in-one solution for website monitoring, server monitoring, cloud monitoring, network monitoring, application performance, and real time-monitoring.
Some key features of Site24x7 apm are as follows:
- Website monitoring to check availability, security, and performance
- Application monitoring to ensure optimum app performance
- In-depth access to the server performance, including app servers, mail servers, database servers, and web servers, ensuring that you stay ahead of server downtime and your data centers
- Log management to reduce mean time to identify (MTTI) and mean time to resolve (MTTR)
- Insight into cloud services, such as AWS, Azure, and Google Cloud
Site 24x7 APM offers a range of plans starting as low as $9 per month and as high as $449 per month, depending on the features your company decides to opt in for.
Instana
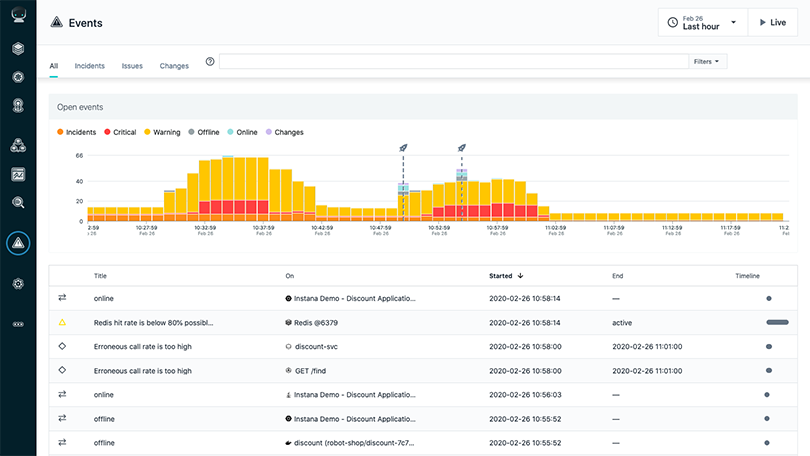
Instana studies observability metrics while tracing every request. It profiles each process automatically and, therefore, breaks through your application environment complexity to show you how everything fits together in context. Instana uses sensors to quickly and efficiently detect events from your infrastructure and collect logs and traces across all the components of your systems.
Some of Instana’s key features are as follows:
- Hybrid and multi-cloud monitoring, enterprise observability, and application monitoring, amongst others
- Automatic discovery, where a single lightweight agent continuously discovers all components in a system and then deploys sensors to monitor those components
- High-fidelity data metric collection
- Dynamic graph used to improve traces, so as to understand how a system’s components work together
- Stream processes to observe incoming data in real-time
Instana’s pricing is currently set at $75 per host per month, billed annually.
Final thoughts
Tracing tools should be in every developer’s toolkit, as these tools can be a great help in tracking down errors in your systems. In this article, you were introduced to some of the best tracing tools to use in 2022.
The tracing tools in this article were selected based on features like cost, ease of use, developer experience, and configurability. These features and considerations are at the core of selecting a tracing tool to meet your needs. This roundup has equipped your team to get a bird’s-eye view of how each tool works to help you make the best decision for your organization.
If you're looking to build a pipeline to process your logs to catch errors in an even easier way, then check out Airplane. With Airplane, you can build custom internal tools for your engineering workflows. If you need a frontend, Airplane Views can be used to rapidly build UIs that help non-technical team members use internal tools in a secure manner.
To get started, sign up for a free account or book a demo.


