


Kubernetes is making automation and orchestration the preferred route for deployment, management, and scaling of cloud applications. To support this increased adoption, there’s now a variety of tools available to monitor cluster and application health. By using a monitoring solution and toolset, engineering teams are able to get insight into the variables impacting performance, whether hosted on-premise or in the cloud.
In this article, we’ll break down the features of two popular Kubernetes monitoring tools — New Relic and Datadog. You’ll understand when to use each tool and when to use both.
Goal planning and tools| tools
No matter the specific tool, these metrics are important to engineers and system administrators monitoring Kubernetes instances in general:
- Number of active clusters and their histories
- Compute and storage usage metrics
- Various Kubernetes events and their effect on the overall performance of hosted applications
Before you settle on a monitoring solution, It’s essential that you know what each tool is trying to do. You don’t want to find yourself using multiple tools just to strengthen the weaknesses of your favorite option. For example, if your primary goal is speed—no matter the cost—you shouldn’t choose a self-hosted solution with no support channel.

New Relic Kubernetes monitoring goals
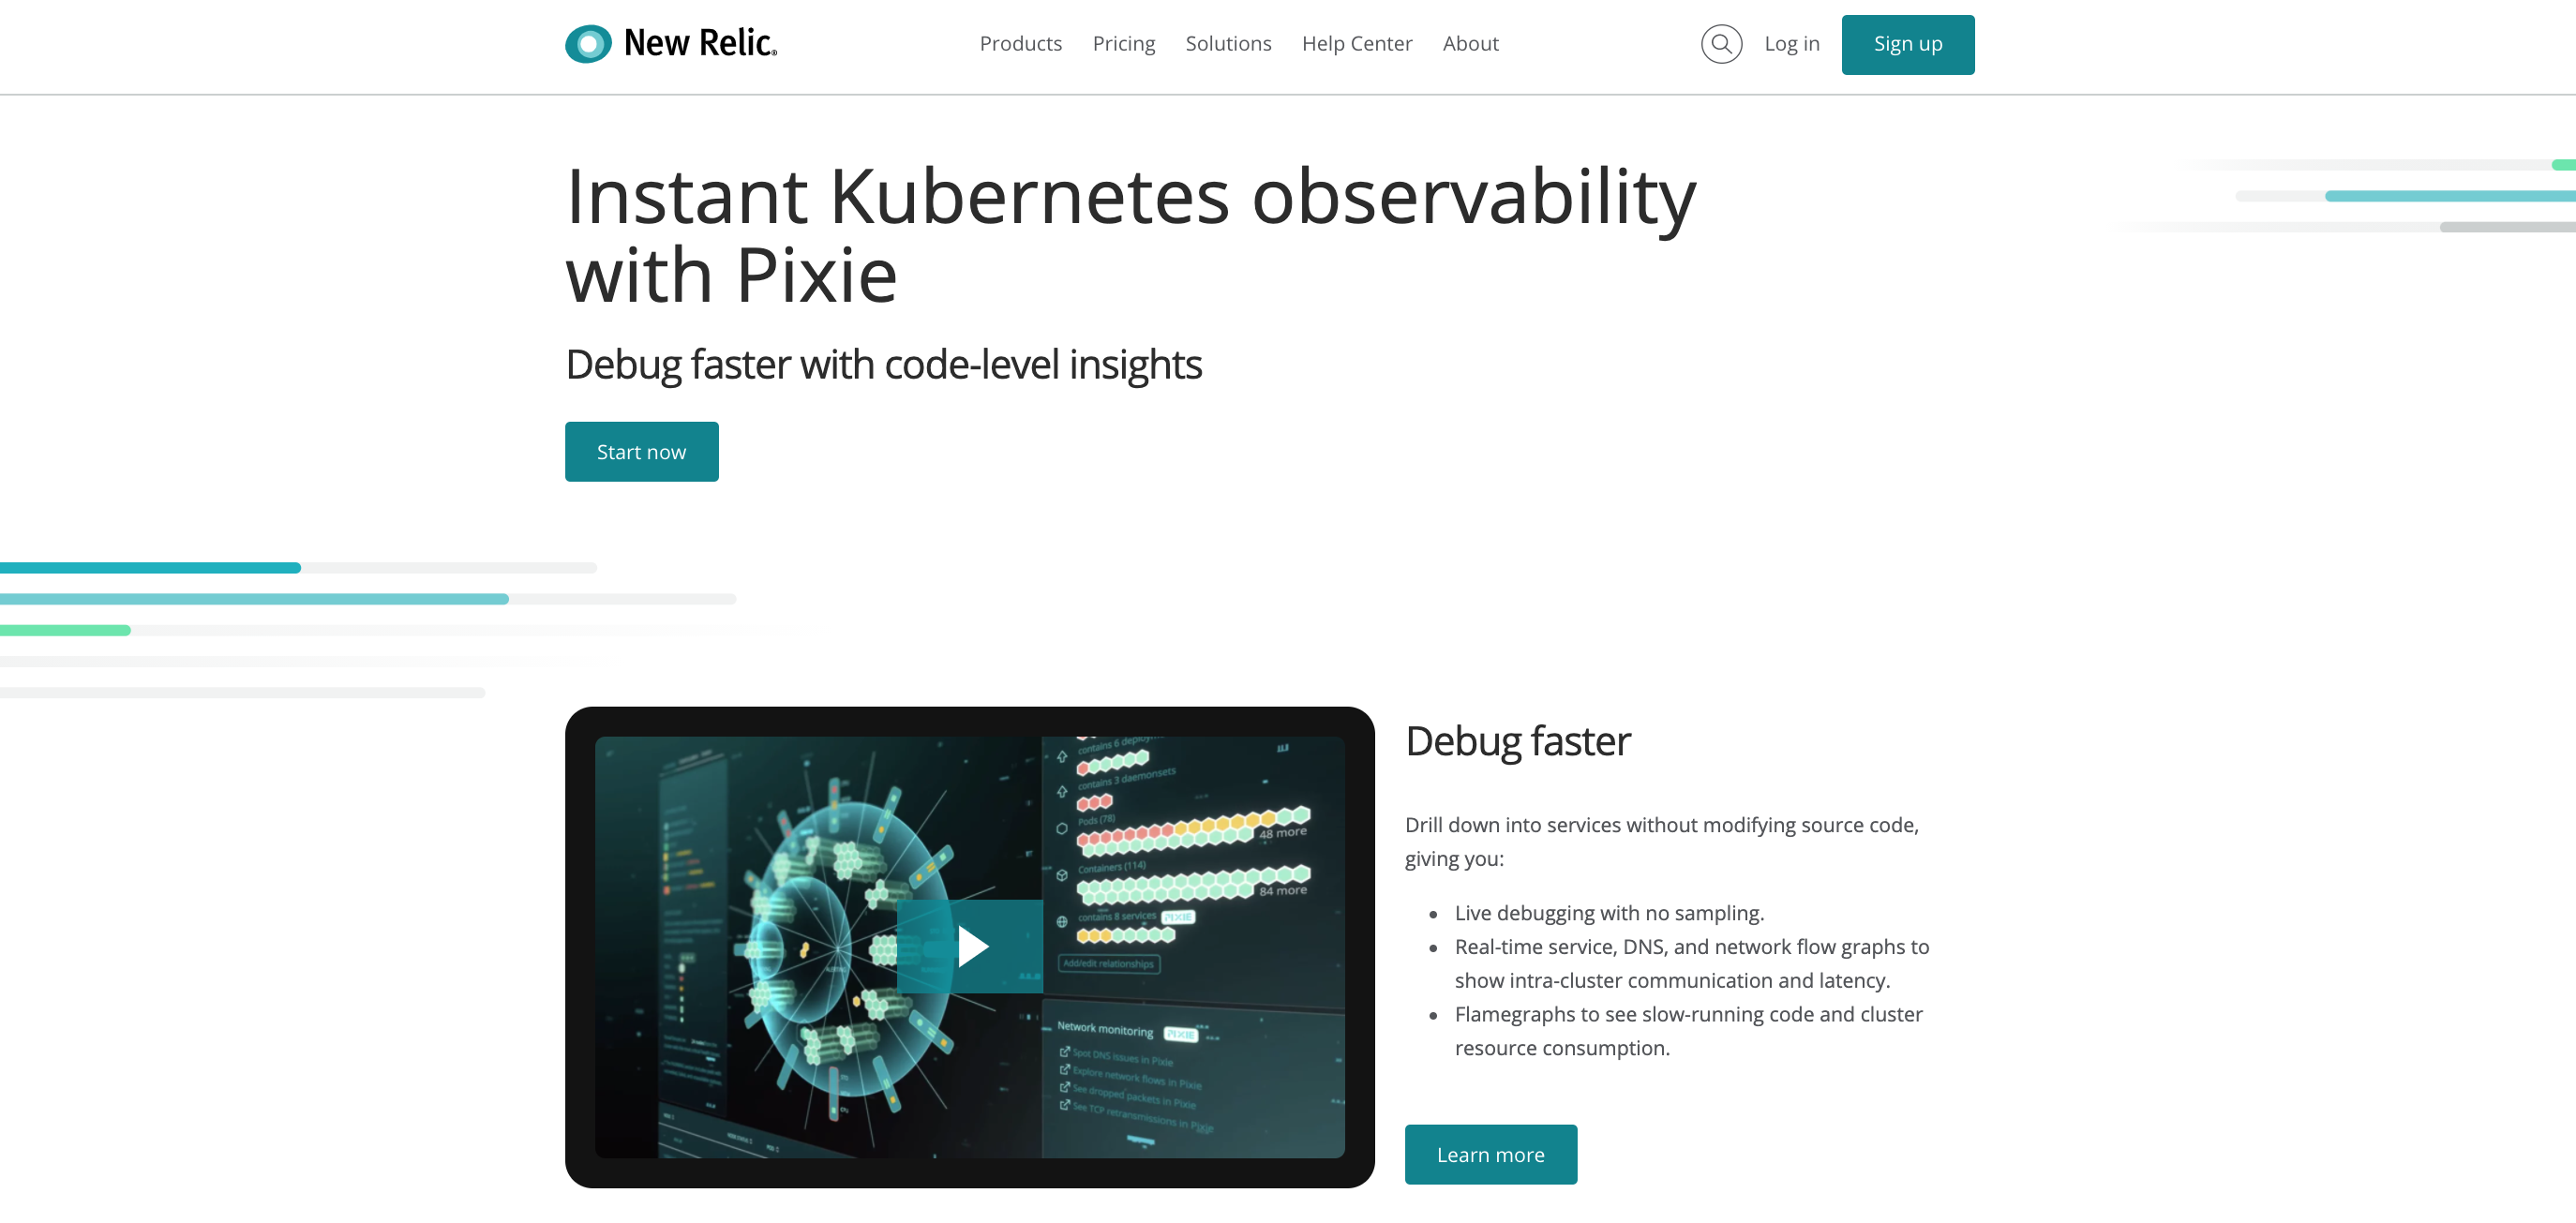
New Relic One recently launched a joint Kubernetes monitoring experience with Pixie. This combined approach provides telemetry for your Kubernetes instances—without the need for an instrumentation expert. Besides Pixie, New Relic’s core focus is on code-level application performance monitoring (APM).
Datadog Kubernetes monitoring goals
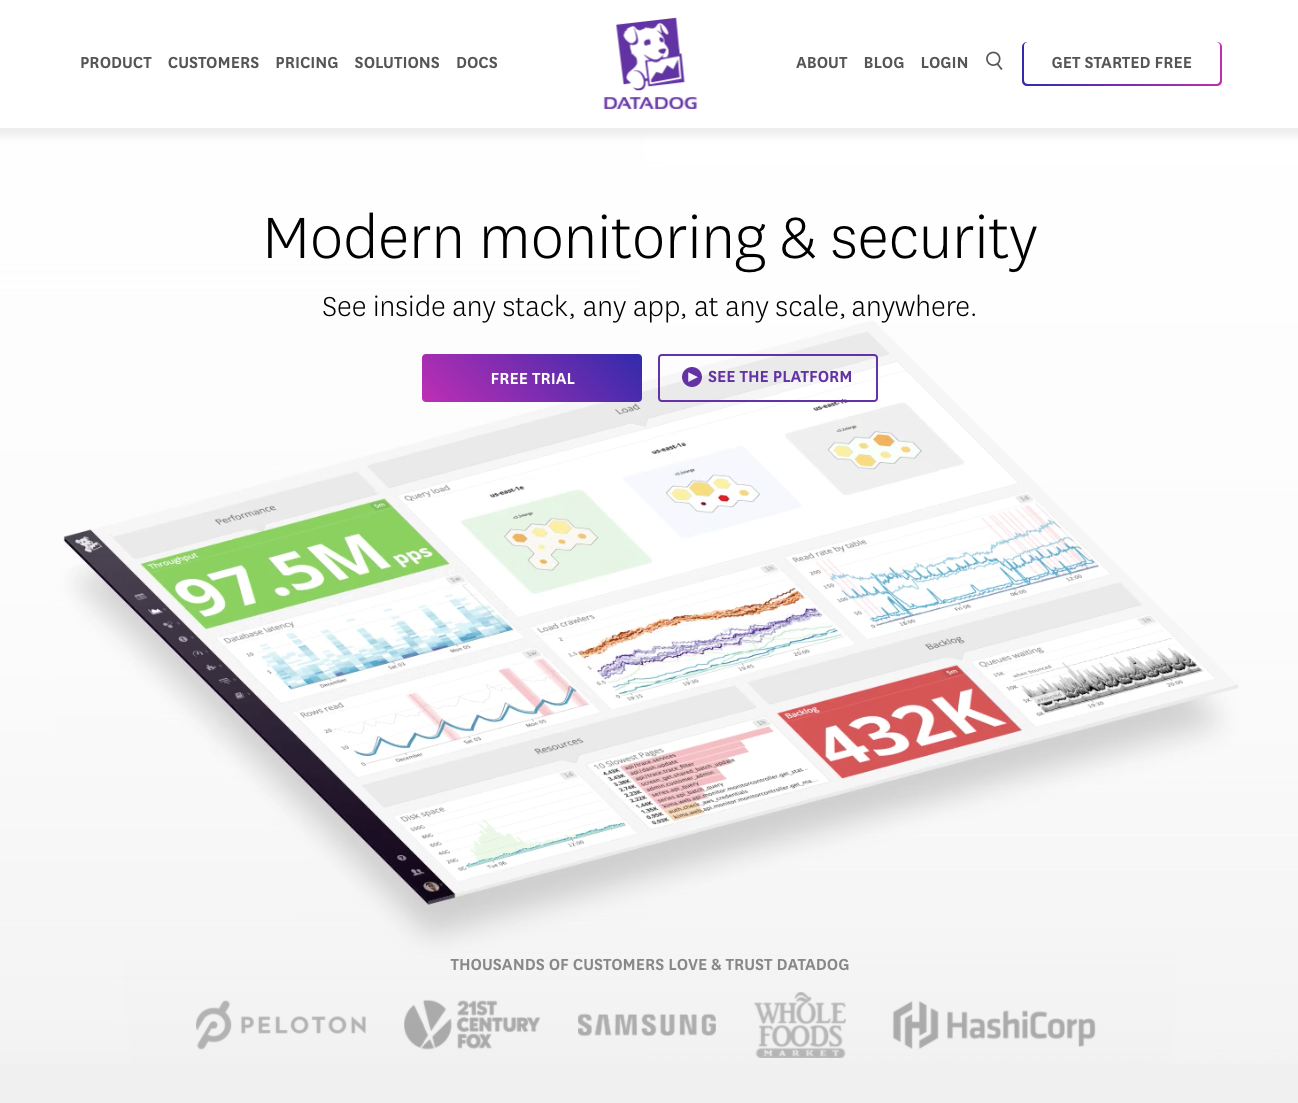
In contrast, Datadog aims to provide a managed Kubernetes monitoring experience on behalf of its users. This means engineers focus on the LOC-level scaling of applications while their system monitors the entire stack.
Datadog vs New Relic: Initial setup
When deciding between Datadog or New Relic, the setup process should be carefully considered. As an example, a user-friendly setup process will be highly beneficial to nontechnical stakeholders, but that may not be your absolute priority.
Setting up New Relic
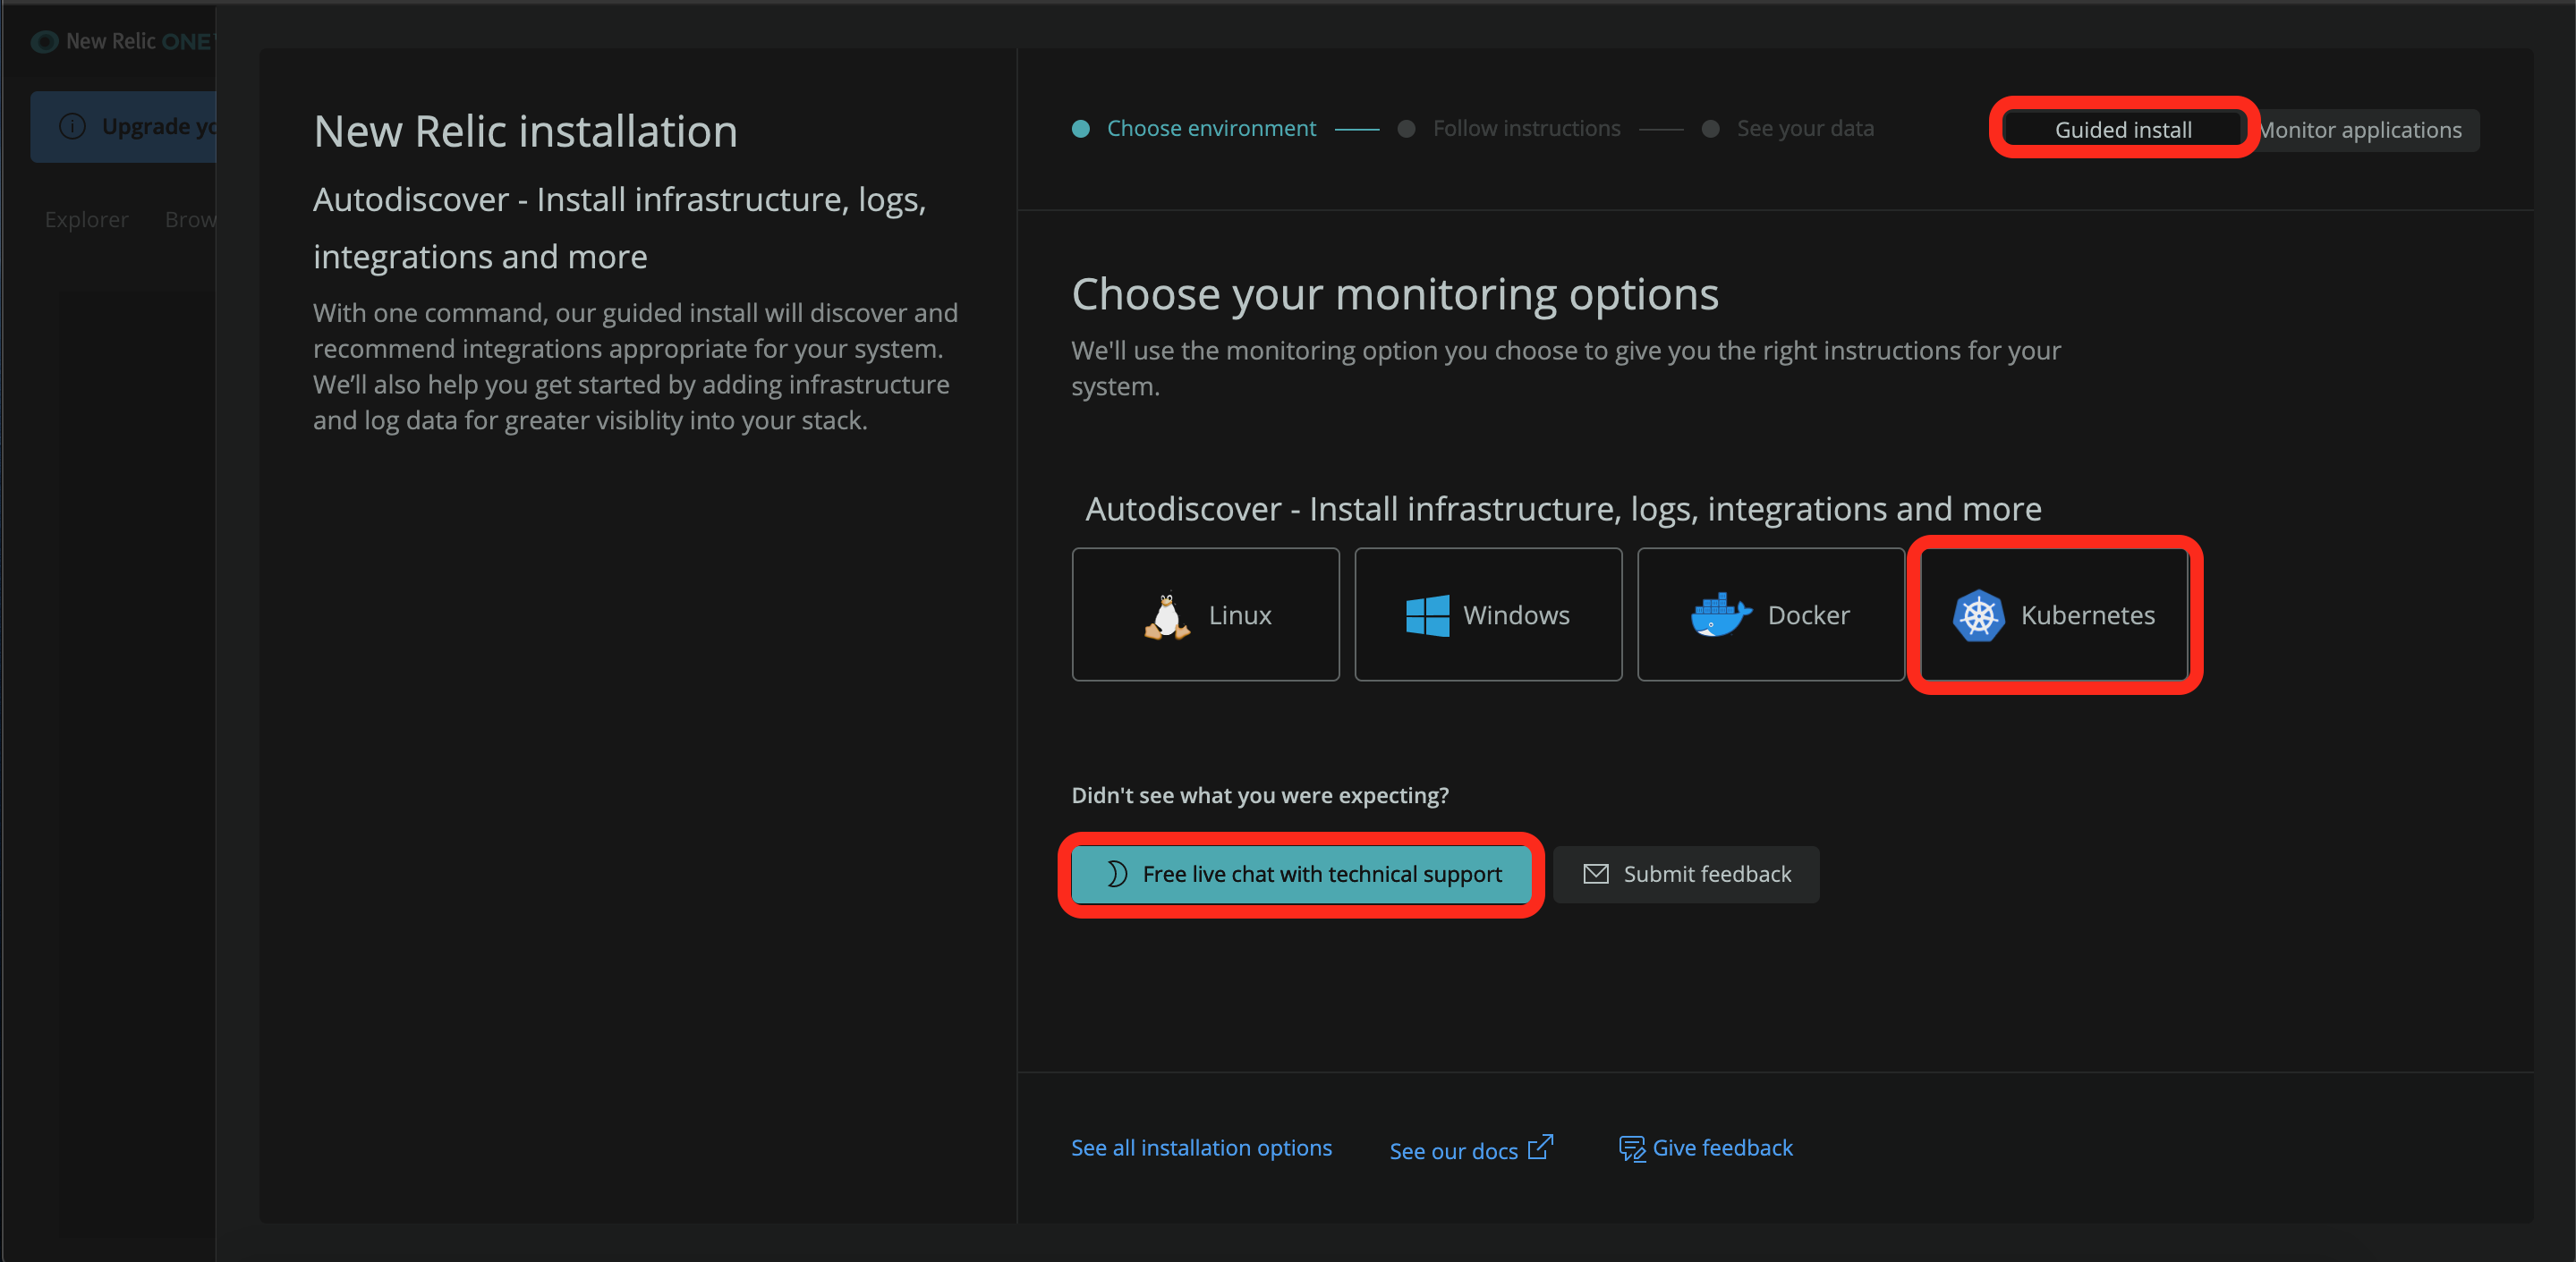
The New Relic (Pixie) installation begins once you submit your work email via the Start Now form on the site. The easiest way to start monitoring a Kubernetes cluster is by clicking the Guided Install menu option. Kubernetes is clearly labeled, along with Docker, Linux, and Windows environments.
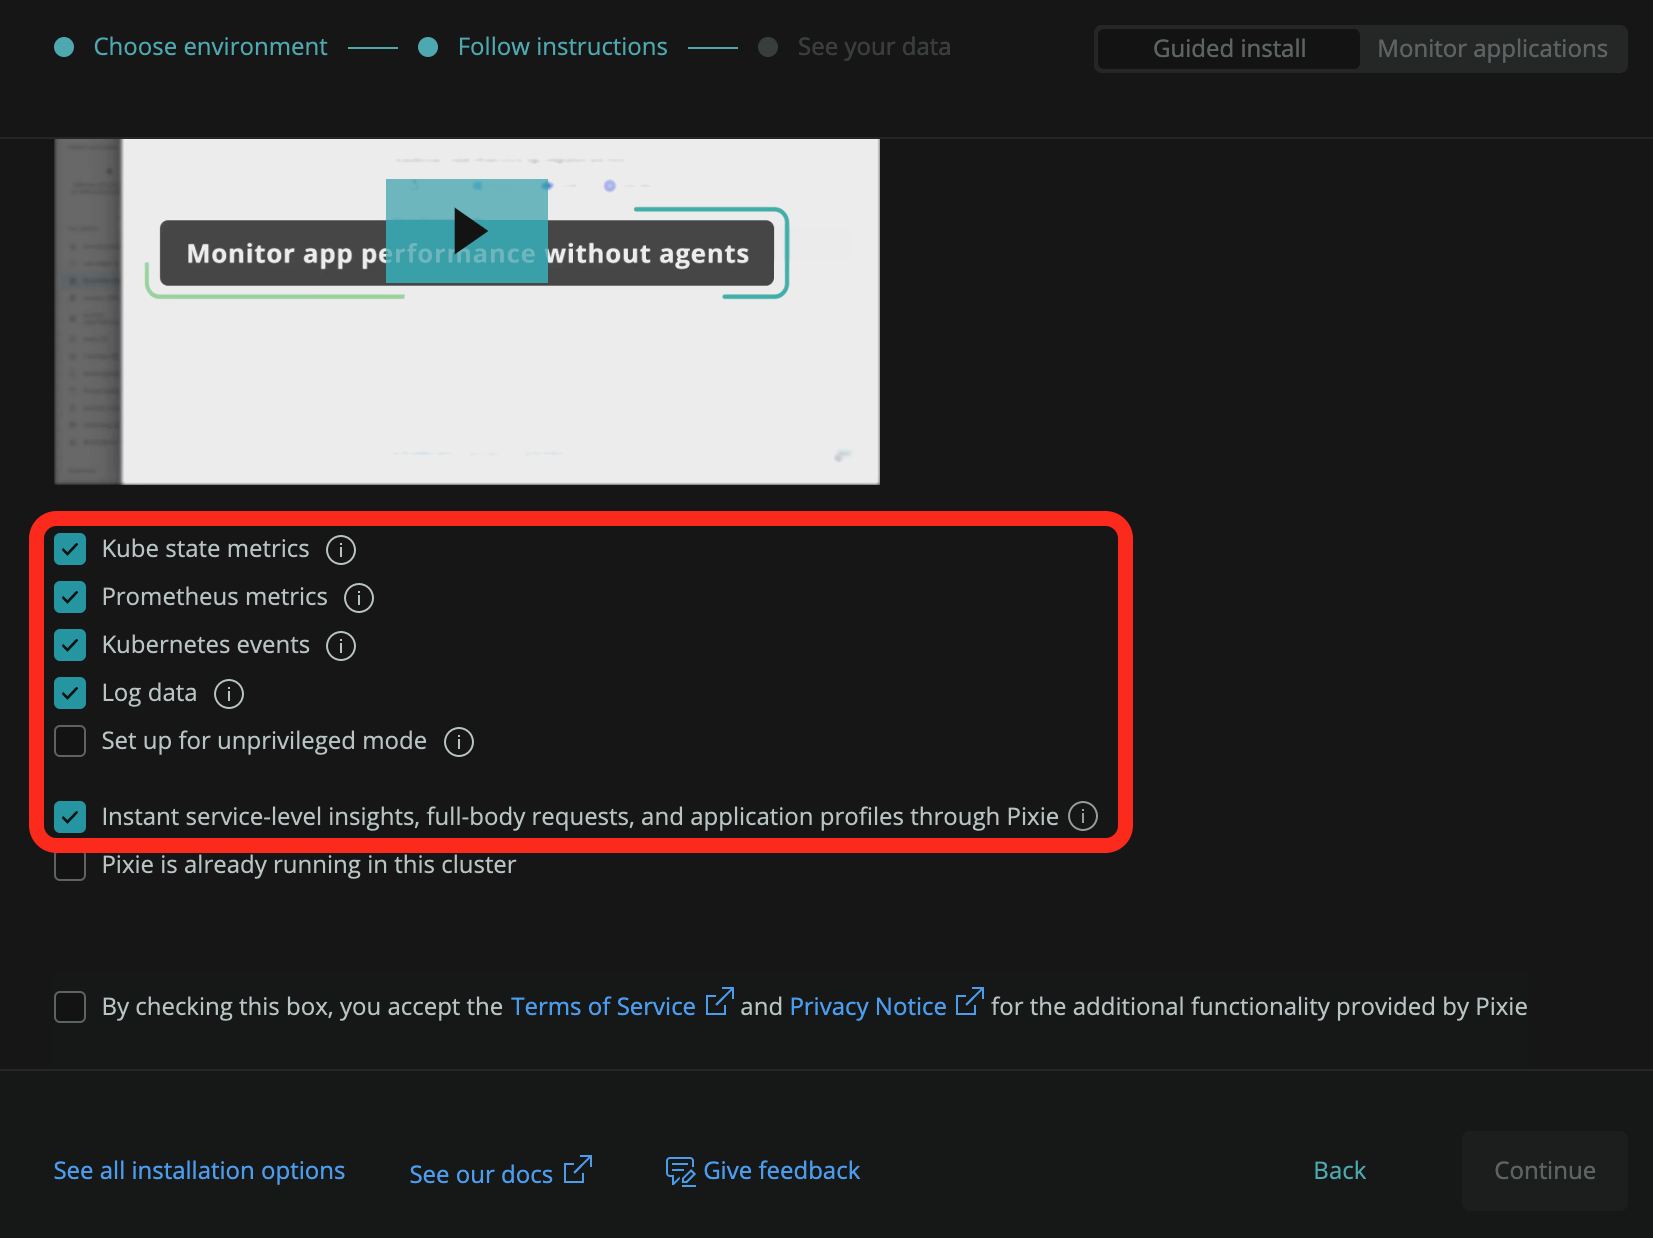
Once you select Kubernetes, the guided setup will prompt you to fill in your Helm file details (cluster and namespace identifiers). Next, select the variables you want to monitor: logs, events, state data, and any Prometheus endpoints.
That concludes the configuration process, which generates a manifest file or Helm config scripts that you must run to finalize the installation. The Helm 3 code generated looks something like this:
Once the commands are running successfully, New Relic starts listening for data from your specified cluster.
Setting up Datadog
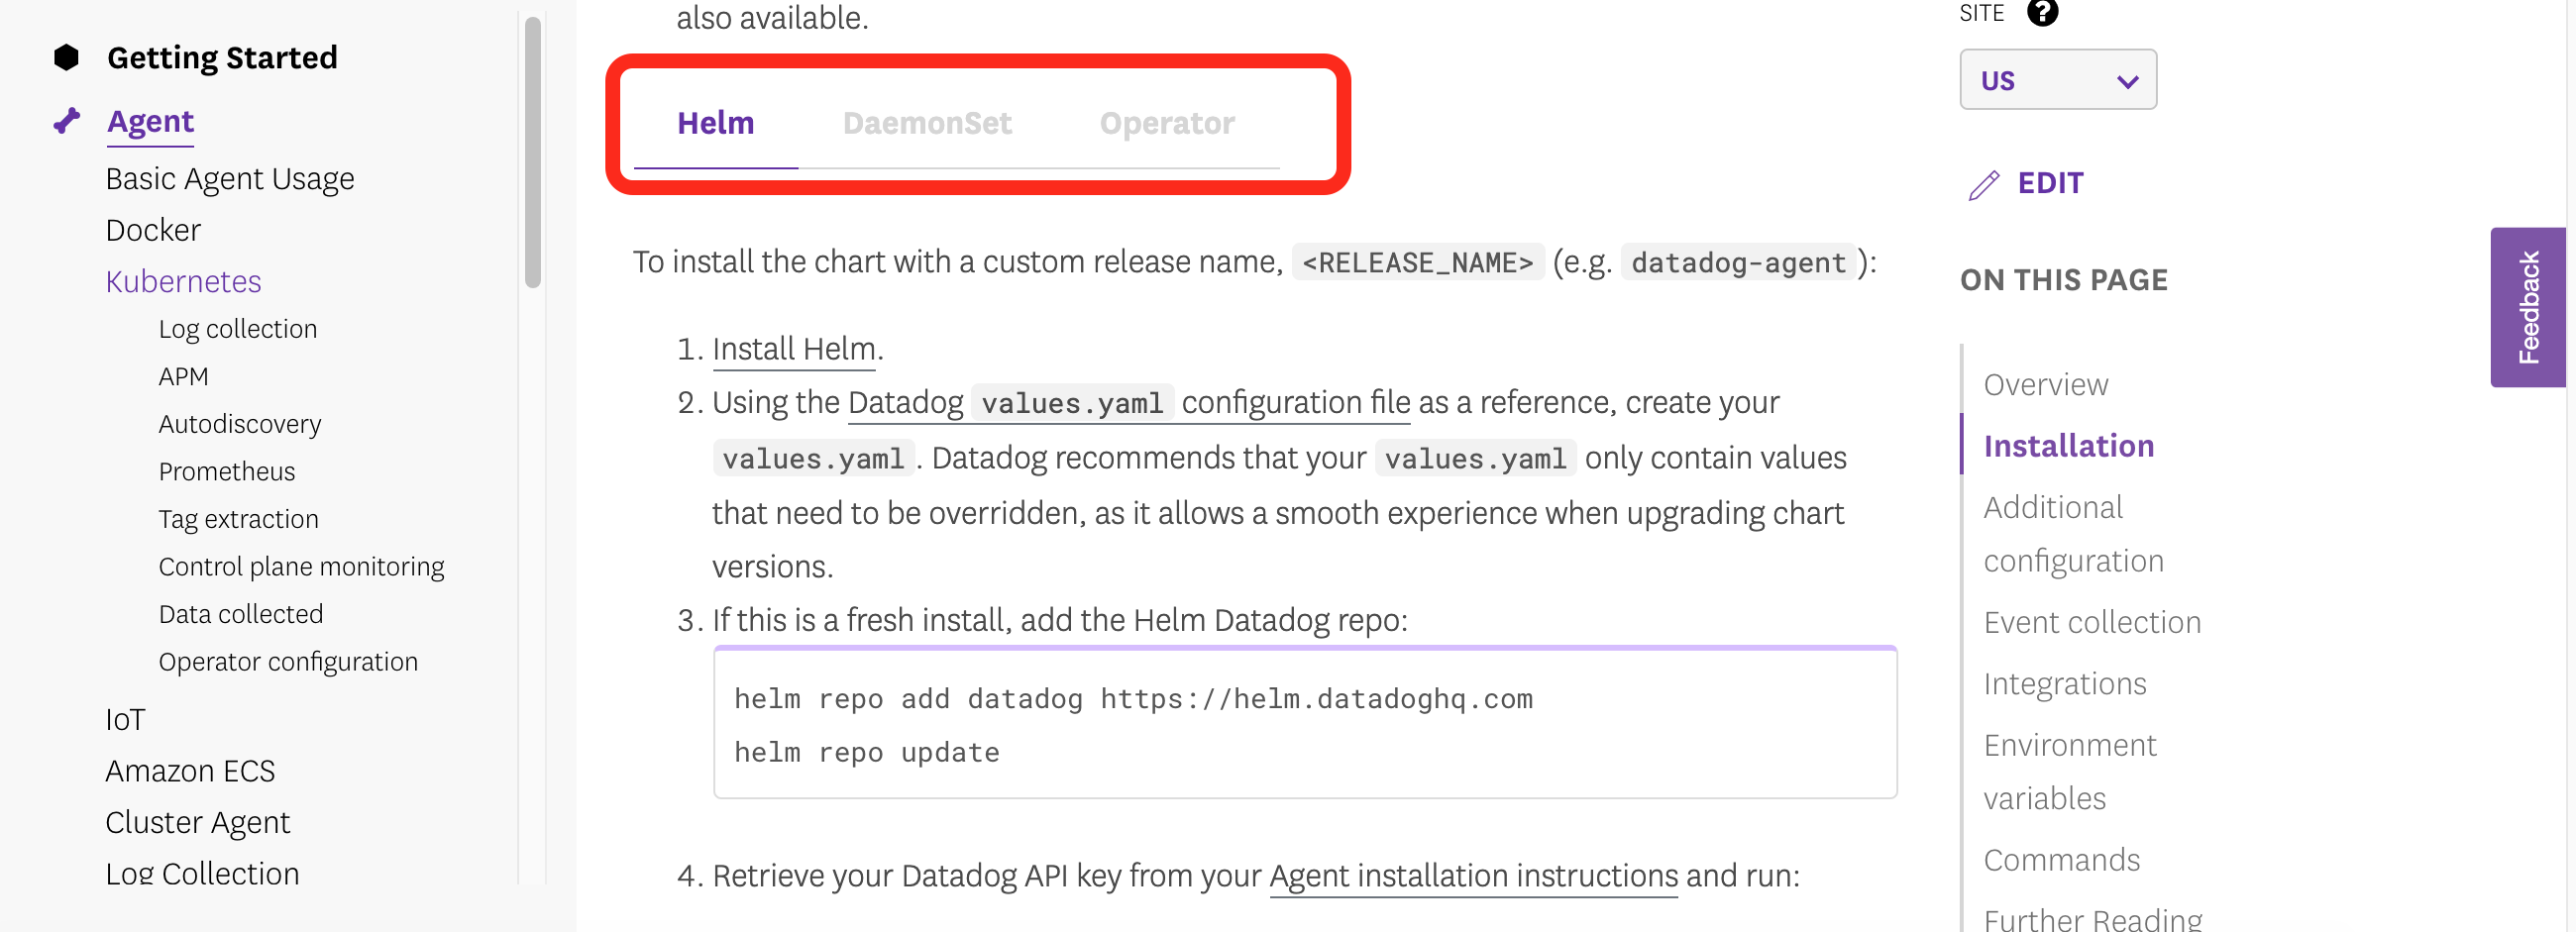
Datadog’s setup procedure includes the installation of an agent into your target cluster through either Helm, DaemonSet, or the Datadog Operator service. The Helm setup process is similar to New Relic’s, except you populate the resulting command file manually. This option offers more control over the spectrum of variables that push data to your dashboards. However, manually setting things up may be problematic for nontechnical users.
It’s worth noting that the Datadog Operator route offers the quickest implementation. This beginner-friendly step-by-step guide is a useful resource.
Feature differences
The biggest difference between Datadog and New Relic so far has to be the mostly CLI (Datadog) vs GUI (New Relic) approach to setting up the monitoring experience. The end result of setting up both platforms, even on the same cluster, is that Datadog just handles infrastructure monitoring better than New Relic, thanks to the Datadog Agent software. Essentially, the agent resides where your log source is and streams data to the Datadog platform dashboard.
Coverage
Once New Relic is configured for Kubernetes monitoring, you’re able to gather Prometheus-related data (data configured for collection through Prometheus), doing away with having both platforms active. This is also possible with Datadog, but you can also collect OpenMetrics data if you set up your cluster for observation with the platform. Collection of OpenMetrics data is a big advantage of using Datadog—you’re able to amalgamate data from a wider area of exposure.
Metric collection
Datadog has the most comprehensive metrics collection surface for Kubernetes clusters. Think of a variable, and it’s likely that the installed agent can monitor it. In comparison, New Relic’s metric monitoring is limited to the options available during setup. That said, unless your Prometheus exposed endpoints have granular variables of interest, New Relic’s metric collection is sufficient in understanding the essentials of what’s happening inside your Kubernetes clusters.
Event monitoring
Datadog has a comprehensive Events monitoring tab to configure all agents across the entire stack. This makes it possible for engineers to trace back occurrences when troubleshooting failure events.
While New Relic can keep you updated with cluster-specific events, diagnosis is geared more toward the actual application than underlying infrastructure. This makes New Relic more of a general APM, as opposed to a deep monitoring tool for all Kubernetes events, which you can filter out with a kube query.
Visualization
When it comes to reporting capabilities, there’s a noticeable difference between New Relic’s Pixel service and the rest of the platform. The GUI approach that both SaaS platforms take allows you to easily isolate metrics and pattern recognition.
That said, the interwoven nature of reports in Datadog offers a more holistic picture of what’s happening around your Kubernetes cluster.
Alerting
While it’s not a core monitoring function, both platforms integrate with mainstream communication channels to alert users to policy-determined triggers. This is where your Slack channel pipe comes into the spotlight, as do email and mobile push notifications.
One difference on the alerting front is how Datadog sends notifications to engineering teams when abnormalities are identified, thanks to monitors that know when best to send alerts. Datadog’s monitoring could result in alerts before the kind of events that New Relic’s implementation flags.
Datadog and New Relic also offer mobile applications for on-the-go monitoring of configured assets, eliminating the need for additional third-party connections.
Overall kubernetes monitoring capability
Overall, Datadog offers a more comprehensive monitoring solution for small to medium sized enterprises. However for larger organizations, New Relic comes out stronger, given its code-level analysis that is consistent with language-agnostic APMs.
Would you use both?
It is possible to use both, especially at larger organizations who may be running a variety of environments. And for organizations with engineers who have varying degrees of experience, implementing both tools might be preferable.
It is pretty common for engineering teams to be using Datadog for metrics and logging, but to be using New Relic's APM feature set for application level insights. And because both of these tools charge based on usage, it is possible to pay Datadog, or New Relic, for one set of features and not another. Using the previous example, it is quite common for organizations to pay Datadog for metrics, but not for the APM feature set.
Finally, New Relic's per seat pricing can get quite expensive for larger teams. In this situation, it might be preferable to give certain engineers access to both Datadog and New Relic, but not to give all engineers access to New Relic.
Final thoughts
Datadog and New Relic (Pixie) are useful Kubernetes monitoring tools that identify events, logs, and other metrics in and around a cluster.
Of the two, New Relic takes less programming knowledge to install and run. Unfortunately, this usability means you’re getting fewer reporting points relative to Datadog’s monitoring power. Datadog’s greater monitoring power is worth the more complex agent installation process required—you’re ultimately left with greater bigger-picture insight relative to New Relic’s visualizations.
Taking the above into account, the agent-monitoring-reporting route offered by Datadog provides a more comprehensive monitoring experience. The added difficulty of Datadog’s installation is still a problem, however, and that’s where other alternatives, may offer a solution.
If you're looking for a maintenance-free platform that makes it easy to build dashboards for monitoring your Kubernetes applications, then try using Airplane. Airplane is the developer platform for building internal tools. With Airplane, you can build React-based UIs (called Views) and single or multi-step functions (called Tasks) for your engineering workflows.
Sign up for free or book a demo to get started easily.


