


Monitoring is nothing new. Most engineers know of the basic monitoring principles, and many have spent time implementing them in some shape or form. When it comes to monitoring Kubernetes, most principles are the same. You still have to collect logs. You still have to collect metrics. You still have to create alerts based on certain thresholds or predictions. But what you can monitor changes a lot.
In Kubernetes, it’s not enough to monitor CPU and RAM usage. You have to monitor more complex metrics, like how many pods are running, how many of them are failing, and whether or not any pods are being constantly restarted.
Two popular tools help with this: Datadog and Grafana. In some cases, it comes down to choosing between the two. In others, it comes down to how well the two work together. In this article, you’ll be shown what sets these tools apart and how they can work together.

Comparing goals
First of all, it’s important to know what goals the two tools have. It’s easy to start comparing various features, but if you don’t know the goals behind the development of the tool, it becomes harder to know which is right for you.
Datadog is a tool that very much has a goal of becoming a one-stop shop. They want to keep as much complexity away from the user as possible. Datadog provides you with either a Helm image you can use to install their agent or instructions on configuring a DaemonSet. This agent will then take care of sending metrics (and logs) to Datadog servers.
Grafana, on the other hand, can be a bit more cumbersome to get started. Because their goal is to remain open-source and free, they don’t have a simple cloud offering—you have to host it yourself. Unlike Datadog, Grafana isn’t trying to be a one-stop shop with all the tools you’ll ever need for monitoring. Instead they focus on being good at visualizing data and being able to gather a lot of it.
Now let’s dive deeper into a direct comparison.
Setting up
As already mentioned in the goals section, there’s a big difference in how easy these tools are to set up. One is a paid cloud offering that manages its own infrastructure. The other is a free open-source offering that you have to host yourself. However, infrastructure is only part of the equation, you also have to configure them such that they monitor your Kubernetes cluster.
Datadog

Configuring Datadog to work with Kubernetes is surprisingly simple. They provide you with a Helm chart you can install in your cluster or instructions on configuring a DaemonSet. With the agent installed, data is being sent to Datadog, and you’re pretty much done. If you want to really take advantage of Datadog, you can go into the integrations page and enable the Kubernetes integration. This will provide you with many different Kubernetes dashboards.
All in all, getting started with Datadog is fairly easy. If you do end up running into any issues when setting it up, they have a dedicated support channel you can reach out to.
Grafana
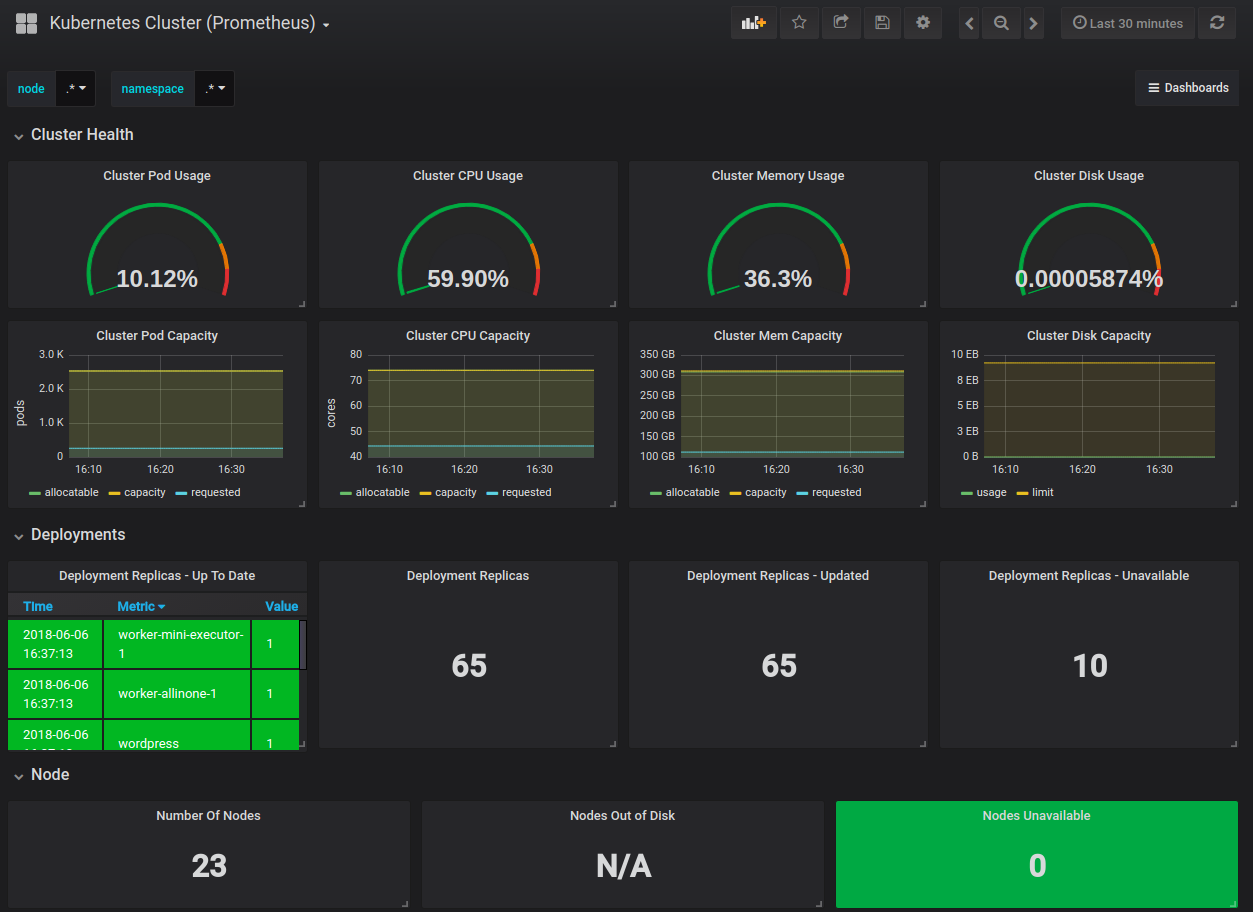
Once you’ve gotten past the hurdle of setting up Grafana on your own infrastructure, like the aforementioned case of having to host it yourself, it’s fairly easy to configure as well. You only need to install the Kubernetes plugin, authorize against your cluster, and Grafana picks up all the metrics it needs to collect. From here you can view the provided Kubernetes dashboards, showing your nodes, pods, clusters, etc.
Once the Grafana server is running, it’s pretty much just as easy as setting up Datadog.
Ease of use
When talking about ease of use, it’s close to the same story as with the setup, except that now of course, the Grafana server is set up. Both of these tools take a bit of getting used to, but not very long. Once you’ve spent an hour or two in each of them, you’ll be familiar enough that you can use them without running into too many issues.
At the end of the day, the winner here mostly comes down to personal preference. Datadog is a bit more polished and has a few more options like creating advanced alerts, storing logs, and Application Performance Monitoring. Grafana is going for the more simple and functional aspect.
Pricing
It’s been mentioned a few times that Datadog is the paid cloud offering, and Grafana is the free self-hosted offering. Many tend to hear that Grafana is free, and then go with Grafana for that reason. It is true that you don’t have to pay anything directly to Grafana, but you do have to pay the engineer tasked with setting up the infrastructure.
You also have to pay the engineer who has to troubleshoot the platform once something goes wrong, and something always goes wrong. This is not to say that going with Grafana is the wrong choice pricing-wise. For many, it makes perfect sense to go with Grafana. In many cases it will be cheaper than paying for Datadog. You just need to be wary of looking at the “free” price tag, and thinking it won’t cost you anything.
As for Datadog, you can view the cost mostly as a dollar-amount since you won’t spend much time configuring. Getting to know what this dollar-amount is not entirely simple though. They price based on how much you consume, the typical cloud way. This does however mean that you’ll almost always have to reach out to them if you want to know the exact cost. For an overview, you can check out their pricing page.
Biggest differences
Although these tools are indeed very similar in many forms, they are also very different. As mentioned earlier, Datadog is aiming to be a one-stop shop. This is true. Datadog has a lot more features than Grafana does. This is something to keep in mind.
The biggest difference, however, has to be where the data is stored. When you install the Datadog agent into your cluster, it is sending metrics and logs to Datadog servers, where this data will be stored. Grafana, on the other hand, is constantly querying your cluster for metrics, meaning Grafana doesn’t store anything. On a day-to-day basis this is not a big deal, but you may find that at some point, this makes a sizable difference in deciding which option is best for you.
Because Grafana doesn’t store data, it’s impossible to get a historic view if your cluster gets removed. In fact, your cluster doesn’t even have to be removed. If Grafana loses connection to the cluster, you won’t be able to view any metrics. This is definitely something to keep in mind, as historic data can be incredibly valuable in troubleshooting.
Working together
Many readers are probably looking to decide between either Datadog or Grafana, but it is possible to make these two tools work together. A great advantage of Grafana is the way it’s built around data sources. You can find data sources for many different systems, including Datadog, which means you can visualize data from Datadog in Grafana.
But why would you want that?
Maybe you prefer the visualization that you get in Grafana, but you want your metrics persisted in Datadog. Or maybe you just prefer the options that you get in Grafana when it comes to visualization. In any case, the option is there.
Conclusion
Now you know more about what Grafana and Datadog respectively provide. You know what the tools are aiming for, and you can evaluate which tool fits the goals of your organization. Datadog is great if you need a tool that’s more hands-off—something where you don’t have to spend as many engineering hours configuring the tool. It’s also great if you have more needs than what Grafana can provide. The fact of the matter is that Datadog can provide mostly the same things as Grafana.
The choice mostly comes down to the surrounding factors. Grafana is a great choice if you’re something like a startup where the budget may be tight, but engineers are willing to put in the extra few hours it takes to host Grafana. Additionally, Grafana works well where the calculations have been made, showing that it’s cheaper to use Grafana over Datadog, as is often the case when comparing Datadog to alternatives. In any case, it’s hard to go wrong. Both tools are good. Both get the job done. It’s a matter of which tool is better for you.
If you're looking for an even easier way to monitor your Kubernetes clusters, you should check out Airplane. With Airplane, you can build powerful workflows and UIs using code. Airplane Views is a React-based platform for creating custom dashboards that help you monitor and manage your applications easily. You can use Airplane's extensive template library and component library to get started.
To build your first metrics dashboard to help monitor your Kubernetes clusters, sign up for a free account or book a demo.


