


BPF is a register-based virtual machine in the Linux kernel that can execute bytecode in a secure, efficient, event-driven manner. Unlike kernel modules, BPF programs are verified to ensure they terminate and don’t contain any loop that could lock up the kernel. The kernel function calls allowed by the program are also restricted to ensure maximum safety against unrestricted access.
Even though BPF offers an efficient solution for writing event-driven kernel space code, the developer experience is not yet comparable to other programming languages or frameworks. Two of the most significant concerns with BPF development are its lack of easy debugging and portability.
To mitigate these issues, we turn to BPF Type Format (BTF). It’s a file format that encodes the type information of a BPF program and provides better introspection and visibility into the program. So let’s take a look at the typical limitations of BPF and how BTF can be used to overcome them.
Note that this article uses the term BPF to mean eBPF (extended Berkeley Packet Filter), which extends the “classic” BPF.
Common limitations of BPF
During the development and execution of BPF programs, you can often face debugging limitations and portability issues, as mentioned earlier.
Debugging limitations
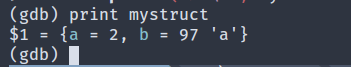
Almost all modern programming languages come with debuggers that can help you gain visibility into a running program. For example, GDB is a commonly used debugger for C and C++ that can, among many other things, dump the values of variables in a running program.
There are no such tools available for BPF programs. Even though inspecting data is only a tiny part of debugging, achieving a similar result for BPF can open up the doors to a wide range of debugging tools in the future. To enable this, BPF needs to know some metadata about the program.
One such piece of metadata is the type information, and that’s precisely what BTF encapsulates.
Portability
BPF programs operate in the kernel space and can access internal kernel states and data structures. However, the kernel data structures and types are not guaranteed to be the same across different kernel versions or even different machines with the same kernel version. This means that BPF programs compiled on one machine aren’t guaranteed to run correctly on another machine.
Imagine your program is reading a field from a kernel struct and the field is at offset 8 from the start of the struct. Now in a later version of the kernel, more fields are added before that one, and now suddenly it’s at offset 24, but your program is still reading (possibly garbage) data from offset 8. It might also happen that some field ends up getting renamed in a later version. For example, thread_struct's fs field might get renamed to fsbase between kernel version 4.6 and 4.7. It’s also possible that your program is running on a different kernel configuration, which has disabled some features and compiled out parts of the struct.
All this means that you cannot compile your BPF program on your machine and distribute the binary to other systems.
A standard solution has been to use BPF Compiler Collection (BCC). With BCC, you usually embed your BPF programs as a plain string into the user space program (for example, a Python program). During execution in the target machine, BCC uses its embedded Clang/LLVM combo and compiles the program on the fly using the locally installed kernel headers.
However, this approach introduces more problems. First of all, the Clang/LLVM combo is huge, and embedding it with the application results in a large binary size. It’s also resource-heavy and can use up a significant amount of resources during the compilation. Finally, this approach requires the kernel headers to be installed on the target machine, which might not always be the case.
The solution is BPF CO-RE (Compile Once—Run Everywhere). Using BTF, you can eliminate the need to install the kernel headers on the target machine or embed Clang/LLVM with the application and compiling on the target machine.
What is BTF?
As mentioned before, BPF is the metadata format that encodes the debug info related to BPF programs and maps. BTF can encode metadata data types, function info, and line info into a compact format.
In a non-BPF program, these metadata are usually stored using the DWARF format. Still, DWARF is quite complicated and verbose, making it unsuitable to include in the kernel due to size overhead. BTF, on the other hand, is a compact and simple format that can be included in the kernel image.
BTF represents each data type using one of few type descriptors:
BTF_KIND_INTBTF_KIND_PTRBTF_KIND_ARRAYBTF_KIND_STRUCT- etc.
The type information is stored in the .BTF section of the produced ELF. Other than the type descriptors, this section also encodes the strings. The function and line info is stored in the .BTF.ext section.
For a detailed description of the BTF, you can check the Linux Kernel documentation.
BTF quickstart
Now let’s get more hands-on with a tutorial for using BTF to pretty-print a BPF map, significantly improving debugging.
To get started, you need to have a Linux kernel compiled with the CONFIG_DEBUG_INFO_BTF option enabled. Most distributions come with this option enabled, but you can check by running the following command:
You’ll also need to install Clang and LLVM on your machine.
Since you’ll be writing XDP programs that will manipulate packets on your network devices, it’s a good idea to create a virtual network interface so you don’t end up losing internet connection in your physical interfaces. The easiest way to set up a virtual interface is with this repo.
Clone the repo and set up a virtual interface named test1.
Now write a BPF program that counts the number of IPv4 and IPv6 packets received on an interface. Save the following in xdp_count.c:
In the previous code, a BPF map named cnt stores the number of packets. cnt is an array of two elements. The number of IPv6 packets is stored in key 0, and the number of IPv4 packets is stored in key 1.
Compile the code with Clang:
Next, load the program using bpftool:
Run the following command and note down the ID of the program you just loaded and the ID of the map(s) being used by the program:
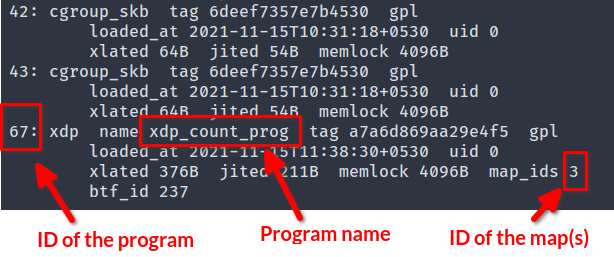
You can also get the map ID(s) by running sudo bpftool map list.
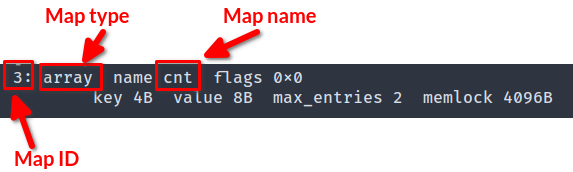
This command will also give you the name, type, key size, value size, and the max entries of the map.
Now, attach the program to a networking device.
Replace program_id with the ID of the program, and device_name with the name of the networking device you want to attach the program to (eg, enp34s0).
Now, send some packets to this device. The test environment script already provides a handy ping command to do so:
Dump the map and check how many packets have been processed.

As you can see, you have two elements in the map as expected. The values are in hexadecimal format and will also depend on your machine’s endianness. In the screenshot, it’s in the little-endian format, which means 22 IPv6 and 4 IPv4 packets have been processed.
Obviously, the result being in hexadecimal and little-endian format is not easy to debug at a glance. So you’ll need to annotate the map with BTF to allow better introspection.
Change the declaration of cnt as follows and save the new code in xdp_count_btf.c -
Observe that the section name is now .maps, and the map itself has been annotated with BTF enabled macros __uint and __type.
Compile the code with Clang:
The use of the -g flag will create the debugging information and generate the BTF. Note that the -g flag has been used previously, too, as it’s required by libbpf to load the program; however, previously the map wasn’t annotated by BTF, so bpftool couldn’t pretty-print it.
Verify the BTF sections are present in the generated object file.
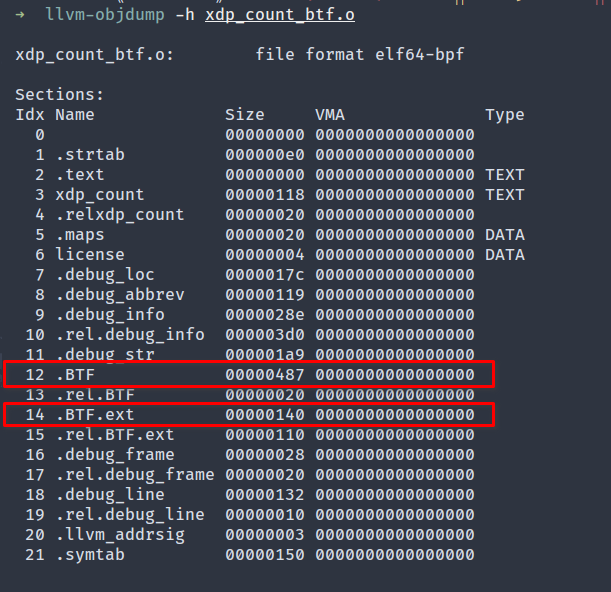
As explained before, the .BTF section contains the type and string data and the .BTF.ext section encodes the func_info and line_info data.
First, detach the previous program.
Then follow a similar procedure to load and attach the new program to the interface and send some packets to the interface.
Finally, dump the map corresponding to the new program. If you did everything correctly, this time, the output will be much different.

Not only is it pretty-printed in JSON format, but the values are also in decimal, making it much more readable and understandable.
BTF and CO-RE
As mentioned before, BTF can enable the use of CO-RE to make your BPF programs portable across different kernel versions or user configurations. You can eliminate the need for local kernel headers by generating the BTF information of the kernel itself.
This will create a huge vmlinux.h file that contains all the kernel types, including types that are exposed as part of UAPI, types that are internal and available through kernel-devel, and some more internal types not available anywhere else. In your BPF program, you can just #include "vmlinux.h" and get rid of other kernel headers like <linux/fs.h>, <linux/sched.h>, and so on.
Getting rid of kernel header dependency is just the tip of what BTF can achieve. For a thorough explanation of BTF and CO-RE, you can go through this article.
Conclusion
BTF is an extremely powerful tool that can make BPF programs more debuggable and portable. Since it’s a relatively new technology, the development is ongoing, and you can expect to see plenty of improvements in the future.
This article gave you a glimpse of what BTF can achieve. You learned the shortcomings of BPF, what BPF is, and how to annotate maps with BTF and pretty-print maps. Finally, you also learned how BTF acts as the starting place for enhancing portability with CO-RE.
If you're looking for a maintenance-free platform to build a dashboard that makes debugging and troubleshooting issues easier, then Airplane is a good solution for you. With Airplane, you can build powerful internal tools using SQP queries, Python scripts, REST API calls, and more. Airplane Views is a React-based platform that makes it easy to create custom debugging dashboards suited for your engineering workflows.
Sign up for a free account or book a demo to try it out.


