


BPF Compiler Collection, also known as BCC, is a toolset based on eBPF technology that allows you to analyze both OS and network performance of Linux distributions with ease. This article will explore what BCC tools are, their relationship with eBPF, their pros and cons, and the procedure to install BCC on Linux.
What is BCC?
To understand what BCC is, it’s necessary to go a step back and talk about the technology on which it is based: Berkeley Packet Filter (BPF), specifically, extended BPF (eBPF). You can think of eBPF as JIT virtual machines built into the Linux kernel that allow you to safely execute code in various kernel hooks. One of the properties that makes BPF useful is that it allows you to filter packets. This feature makes it possible for programs to work with the packets they need without worrying about filtering, which helps improve performance.
Currently, there are two tools based on Berkeley Packet Filter, BCC (BPF Compiler Collection) and Libbpf, which you’ll learn about later. BCC is a highly flexible toolbox that allows you to build kernel tracing and manipulation programs with ease. It frees developers from having to spend time compiling BPF, letting them devote their time and energy to creating applications that take advantage of the features offered by BPF. To this end, the BCC toolkit provides the following benefits:
- End-to-end BPF workflow in a shared library, including support for BPF kernel hooks such as socket filters, tc classifiers, tc actions, and kprobes.
- Bindings for Python, Lua, Go, and Rust.
- Sample BCC programs that you can use as templates for your own applications.
- Self-contained tools for tracing a running Linux system.
- Integration with llvm-bpf backend for JIT.
The convenience of being able to filter packets that come directly from the Linux kernel makes BCC an ideal solution for different use cases, including:
- Network traffic analysis: BCC has multiple tools to monitor, trace, debug, and diagnose networks. These include
tcptop,tcpstates,tcplife,tcpdrop,tcpconnlat, andtcpconnectamong others. - OS performance monitoring: BCC is also an ideal solution for measuring and monitoring OS performance with tools like
biolatecncy,opensnoop,execslower,biosnoop, andcachestatamong others.
In the next section, you will learn how to install BCC and do simple tests with BCC tools.
Setting up BCC tools
Since the BCC tools are based on BPF, which is built into the Linux kernel, the only requirement to install this robust set of tools is a distribution of Linux 4.1 or higher. For the purposes of this tutorial, you’ll be using two identical VPSs running Ubuntu 20.04 LTS; however, you can use any other distribution. For more information about packages for other distros, you can read the BCC documentation.
In Ubuntu, you can install BCC tools using binary packages from the Ubuntu Universe repository, Upstream Nightly repository, IO Visor’s PPA, or build it from the source. For convenience, this tutorial will use the packages included in the Universe repository. Note that the names of these packages differ slightly from those used by IO Visor upstream packages.
Before starting, it’s always a good idea to verify the kernel version of your Linux machine. To check the Linux version, use the following command:
At the time of writing this tutorial, the output from Ubuntu 20.04 LTS is 5.4.0-100-generic.
You also need to make sure your Linux box is up to date:
Install the BCC tools and Linux headers using the following command:
The tools will be installed in /usr/sbin, so they will be immediately available without the need to add a new directory to your PATH. You can easily identify them, because they all use the -bpfcc extension.
| argdist-bpfcc | dcstat-bpfcc | javagc-bpfcc | perlcalls-bpfcc | runqlen-bpfcc | tcpdrop-bpfcc |
| bashreadline-bpfcc | deadlock-bpfcc | javaobjnew-bpfcc | perlflow-bpfcc | runqslower-bpfcc | tcplife-bpfcc |
| biolatency-bpfcc | deadlock.c-bpfcc | javastat-bpfcc | perlstat-bpfcc | shmsnoop-bpfcc | tcpretrans-bpfcc |
| biosnoop-bpfcc | drsnoop-bpfcc | javathreads-bpfcc | phpcalls-bpfcc | slabratetop-bpfcc | tcpstates-bpfcc |
| biotop-bpfcc | execsnoop-bpfcc | killsnoop-bpfcc | phpflow-bpfcc | sofdsnoop-bpfcc | tcpsubnet-bpfcc |
| bitesize-bpfcc | exitsnoop-bpfcc | klokstat-bpfcc | phpstat-bpfcc | softirqs-bpfcc | tcptop-bpfcc |
| bpflist-bpfcc | ext4dist-bpfcc | llcstat-bpfcc | pidpersec-bpfcc | solisten-bpfcc | tcptracer-bpfcc |
| btrfsdist-bpfcc | ext4slower-bpfcc | mdflush-bpfcc | profile-bpfcc | sslsniff-bpfcc | tplist-bpfcc |
| btrfsslower-bpfcc | filelife-bpfcc | memleak-bpfcc | pythoncalls-bpfcc | stackcount-bpfcc | trace-bpfcc |
| cachestat-bpfcc | fileslower-bpfcc | mountsnoop-bpfcc | pythonflow-bpfcc | statsnoop-bpfcc | ttysnoop-bpfcc |
| cachetop-bpfcc | filetop-bpfcc | mysqld_qslower-bpfcc | pythongc-bpfcc | syncsnoop-bpfcc | vfscount-bpfcc |
| capable-bpfcc | funccount-bpfcc | nfsdist-bpfcc | pythonstat-bpfcc | syscount-bpfcc | vfsstat-bpfcc |
| cobjnew-bpfcc | funclatency-bpfcc | nfsslower-bpfcc | reset-trace-bpfcc | tclcalls-bpfcc | wakeuptime-bpfcc |
| cpudist-bpfcc | funcslower-bpfcc | nodegc-bpfcc | rubycalls-bpfcc | tclflow-bpfcc | xfsdist-bpfcc |
| cpuunclaimed-bpfcc | gethostlatency-bpfcc | nodestat-bpfcc | rubyflow-bpfcc | tclobjnew-bpfcc | xfsslower-bpfcc |
| criticalstat-bpfcc | hardirqs-bpfcc | offcputime-bpfcc | rubygc-bpfcc | tclstat-bpfcc | zfsdist-bpfcc |
| dbslower-bpfcc | inject-bpfcc | offwaketime-bpfcc | rubyobjnew-bpfcc | tcpaccept-bpfcc | zfsslower-bpfcc |
| dbstat-bpfcc | javacalls-bpfcc | oomkill-bpfcc | rubystat-bpfcc | tcpconnect-bpfcc | |
| dcsnoop-bpfcc | javaflow-bpfcc | opensnoop-bpfcc | runqlat-bpfcc | tcpconnlat-bpfcc |
Testing BCC tools
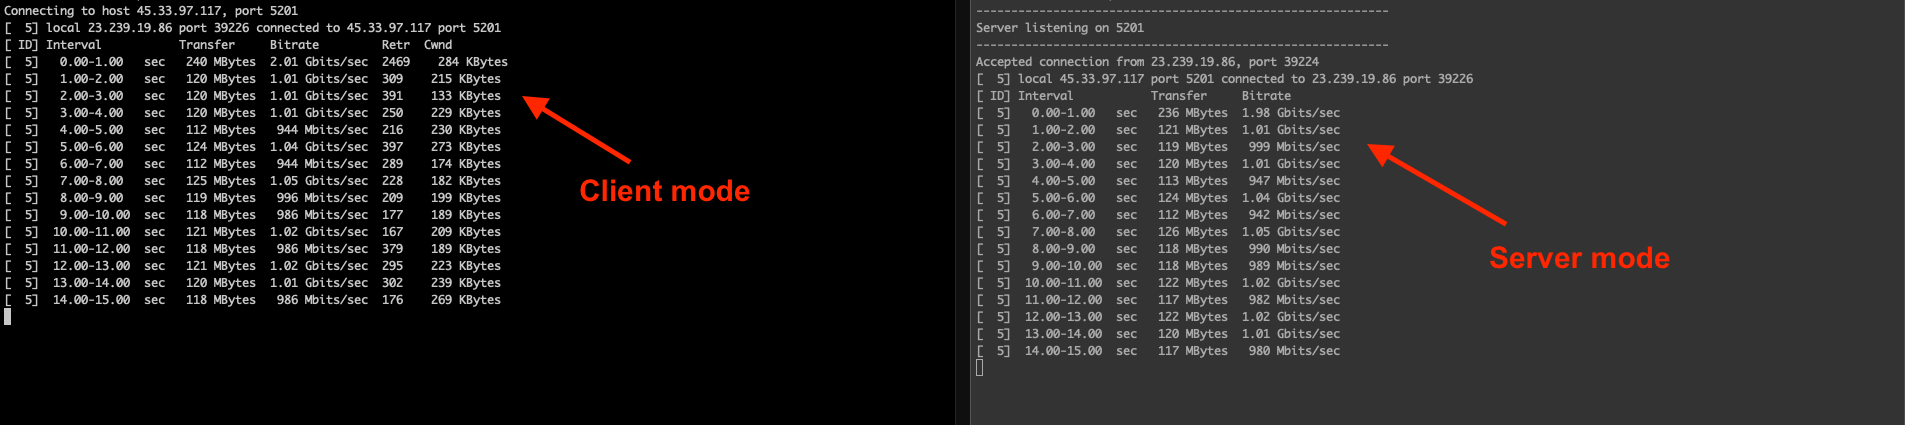
In order to explore the features of BCC, you will use iPerf3 to establish a temporary connection with a second server, thus generating traffic that will allow you to do some testing.
Install iPerf3 on both servers using the following command:
On the secondary server, run the following command to start iPerf3 in server mode:
The output should look something like this:
On the primary server (where you installed BCC tools), run the following command to run iPerf3 in client mode:
Replace IPERF3 SERVER IP with the appropriate IP address. The -t flag allows you to set the duration of the test; if not set, the default test duration is ten seconds. The output should be similar to the following:
Once the connection is established, you can start to run some tests of BCC tools. Please keep in mind that to perform the tests described below, you will need a third terminal window to run the BCC commands.
Tracing active TCP connections
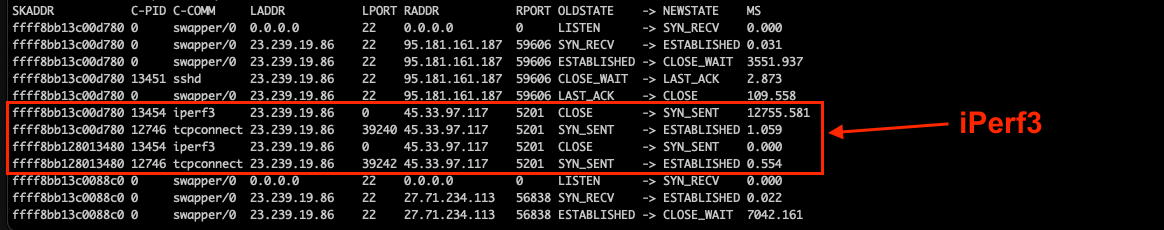
An easy way to explore TCP connections is by using BCC’s tcpconnect. This tool provides the necessary information (source and destination addresses) to trace new TCP connections in the kernel queue, whether they are accepted or not. This could be useful for checking which connections are active, as well as monitoring failed connection attempts.
To start checking connections, run the following command on the primary server:
The output should be similar to the following:
Tracing connect... Hit Ctrl-C to end
| PID | COMM | IP SADDR | DADDR | DPORT |
|---|---|---|---|---|
| 12752 | iperf3 | 4 23.239.19.86 | 45.33.97.117 | 5201 |
| 12752 | iperf3 | 4 23.239.19.86 | 45.33.97.117 | 5201 |
In the example shown above, the address 23.239.19.86 corresponds to the server from which the command is being executed (the primary server), and the address 45.33.97.117 corresponds to the secondary server.
Note that you may not see any output at first, since tcpconnect only detects new connections. To remedy this, go to the terminal that is running the iPerf3 client and press CRTL+C to stop the process. Then restart the connection by running the command iperf3 -c <IPERF3_SERVER_IP> -t 600 again to establish a new connection.
TCP state monitoring
Another useful command is tcpstates, which allows you to monitor TCP changes during a session. This command will check changes in the state of each TCP connection, and is also useful to monitor the time each connection lasts in milliseconds, shown in the last column.
To use it, you run the following command:
The output should be something similar to this:
Testing network throughput
Another of the many features of BCC tools is the ability to measure network throughput. The ability to perform this measurement in real time is helpful when performing network performance adjustments, troubleshooting, verifying process bandwidth consumption, and more. To do this, run the command:
You should see output similar to the following:
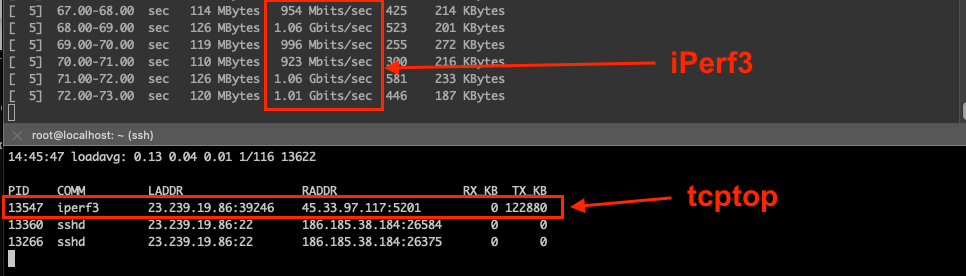
The tcptop command displays the TCP traffic that the host (the primary server) sends and receives in kilobytes. As you can see, the value matches the one returned by iPerf3.
How BCC compares to similar tools
Although BCC offers a complete set of tools that allows you to trace different interactions with the Linux kernel, it also has some drawbacks.
- BCC compiles programs at runtime, which requires more CPU and memory resources than other alternatives.
- As you saw in the previous section, BCC requires the Linux kernel header packages to be installed on the host. This has some drawbacks, such as portability to other systems using a different kernel version, and a larger package size once compiled.
- Since the
libbcclibrary includes the LLVM and Clang libraries, this increases the size of the resulting binary.
Fortunately, there are other tools that offer similar functionality to BCC, including strace and Libbpf.
strace is one of the most popular tools for monitoring, debugging, troubleshooting, and diagnosing processes on Linux operating systems. In addition to its power to analyze how a program interacts with the system, strace’s popularity is partially due to the fact that it has binary packages for almost all modern distributions. strace’s drawbacks include high resource consumption, and less powerful filters than BPF offers.
The other major contender is Libbpf. As explained before, Libbpf is an alternative to BCC that allows building BPF low-level programs. Libbpf is often used in conjunction with BPF CO-RE (compile once, run everywhere) to easily create binaries that can run on different kernel versions. Such portability is an advantage over BCC, but it’s not the only one. Since Libbpf doesn’t require the same dependencies as BCC—Linux headers, for example—it produces lighter binaries that use fewer resources. Libbpf is a great alternative to BCC, especially if you’re looking for something more portable.
Final thoughts
In this article, you’ve explored what BCC tools are, their advantages and disadvantages, and how they compare to similar tools, as well as followed the step-by-step procedure to install BCC and perform simple tests with it. You also touched on BCC’s core technology, eBPF, which allows you to create programs that collect data directly from the kernel. Imagine the potential of using eBPF in more complex applications! The ability to collect data with minimal latency is just one of the many benefits offered!
If you're looking for an internal tooling platform to monitor application performance, then Airplane is a good solution for you. With Airplane, you can use scripts, queries, APIs, and more to build custom internal tools for your engineering workflows. Use Airplane for admin panels, deployment pipeline dashboards, and more.
To build your first internal tool using code within minutes, sign up for a free account or book a demo.


