


Application observability is one of the most important keys for solving performance, security, governance, scalability, and availability problems. You can improve your app’s observability with instrumentation, specifically in two different ways:
- Manual instrumentation, where you create telemetry data by creating traces and metric events using the tracer and meter objects.
- Automatic instrumentation where you don’t have to make any changes in your application code to send telemetry data.
OpenTelemetry is the de facto open standard for instrumentation. Its automatic instrumentation packages make it easier for developers to enable instrumentation for their application. OpenTelemetry also makes the instrumentation consistent throughout the application, making it much easier for developers and testers to debug any issues that might come up.
Let’s run through a short tutorial about using automatic instrumentation simply by including some boilerplate tracer code in your application. We’ll leave the rest to the wide range of libraries that support automatic instrumentation in OpenTelemetry.
Currently, OpenTelemetry supports automatic instrumentation for DNS, Express.js, GraphQL, MongoDB, PostgreSQL, MySQL, and Redis, among many more. You can check the complete list in the npm registry.
What is automatic instrumentation?
Traditionally, tracing has meant manually adding checkpoints in the code to send data after making an HTTP call, producing a message, writing to the database, and so on. When instrumenting a service, you create spans by invoking any methods defined in the service. (A span) is just some information about the service event along with some metadata.
While you can use manual instrumentation, automatic instrumentation gives you a great chance to save up code changes in your application. It allows for instrumentation just by using an intelligent agent that reads the application activity and extracts traces by building spans and capturing relevant metadata.
Implementing automatic instrumentation
Automatic instrumentation is beneficial in several ways:
- You can set it up within just a few minutes.
- It’s a great starting point for you to observe your application and look at issues that matter.
- Once the observability baseline is set up, you can figure out any custom instrumentation you might want.
The baseline approach is a good way to get started; that way, at least a large chunk of the application is consistently observable and isn’t dependent on any custom changes.
Let’s dive in.
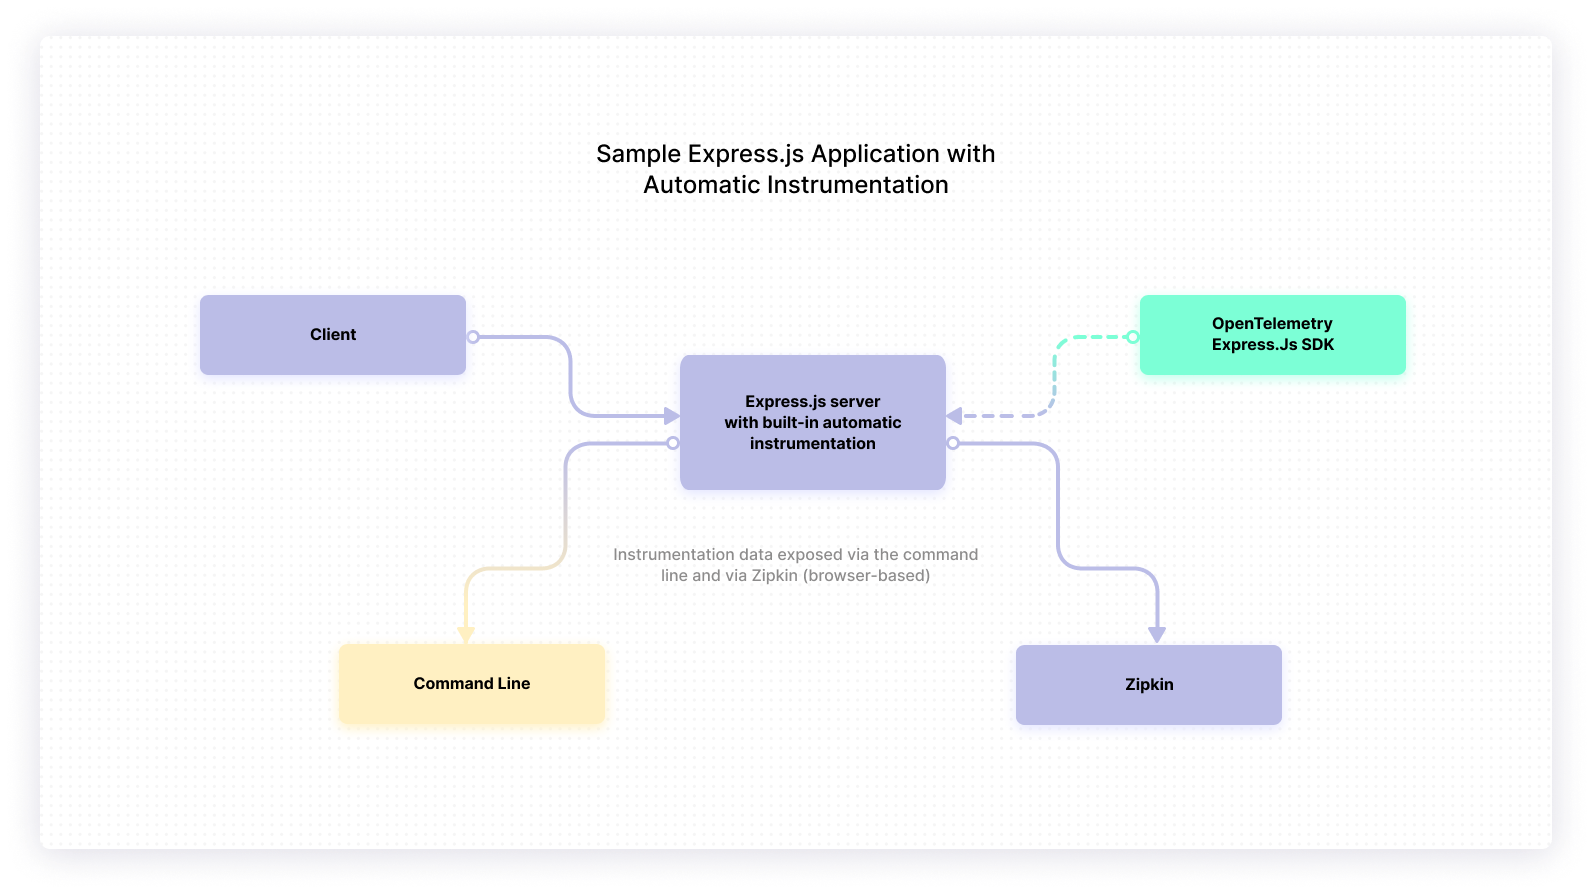
This is a sample application that deploys a mock Express.js server along with a mock client to send requests to the server. OpenTelemetry is used to build in automatic instrumentation for this app. Zipkin is used to expose the instrumentation data via the browser.
Clone the repository
You can implement automatic instrumentation in your application by using the official OpenTelemetry API or SDKs by integrating them into your application. To follow along, start by cloning the following repository:
This repository contains a demo app with an Express.js server and a client that makes requests to the server.
The intent is to get instrumentation data using OpenTelemetry for every request that comes through. This app uses some of the supported instrumentations and exporters for Node.js specified in the OpenTelemetry documentation.
To set up the demo app, please follow the instructions provided in the ReadMe document of the aforementioned repository.
Setting up zipkin
Now, there are several ways that you could look at the instrumentation data:
- Using the command line.
- Using one of the many open-source tools
- Using a proprietary one
In this article, we’ll use Zipkin to search and visualize traces from the captured instrumentation data.
If you already have an application that uses another interface for search and visualization, such as Prometheus, Splunk, Dynatrace, DataDog and so on, you can install the relevant exporter in your app. It will be a minor change, as OpenTelemetry supports a wide range of exporters out-of-the-box. You can find the complete list of exporters here.
You also need to install exporter dependencies in your application to export the collected data in a certain format. Once you start Zipkin and install the relevant dependencies, you can log onto http://localhost:9411 and look at the instrumentation data for your app.
Use the following command to start Zipkin:
If you’re not using Docker, you can always build Zipkin from source or deploy using the binaries.
Configure the opentelemetry api and sdk
To enable automatic instrumentation for your app, install dependencies for the OpenTelemetry API and SDK. Although you can configure the data source, exporter, etc., to get started, the only mandatory thing to configure is a service name. This signifies the name of the service you are instrumenting.
In addition to the core packages and dependencies, the following dependencies are pre-installed to take care of automatic instrumentation in the demo app:
- @opentelemetry/instrumentation-express— npm package that takes care of automatic instrumentation for Express.js
- @opentelemetry/sdk-trace-node — npm package that takes care of automatic instrumentation and tracing for Node.js applications
- @opentelemetry/instrumentation-http — npm package that takes care of automatic instrumentation for HTTP and HTTPS
You can choose the packages for automatic instrumentation that your app needs for increased observability from the official npm documentation.
The demo app also contains a tracer.js file that you need to run just before running any other piece of code that needs to be instrumented. The logic for exporting the data for Zipkin’s consumption is also written here. You can choose to have specific tracers for more custom use cases.
However, for the sake of consistency, it’s a good practice to reuse the tracer code as much as possible.
Run the demo app
To run the app, start the Express.js server that will run on port 8080. In a separate tab, run the following command to start the client, which will send mock HTTP requests to the Express.js server.
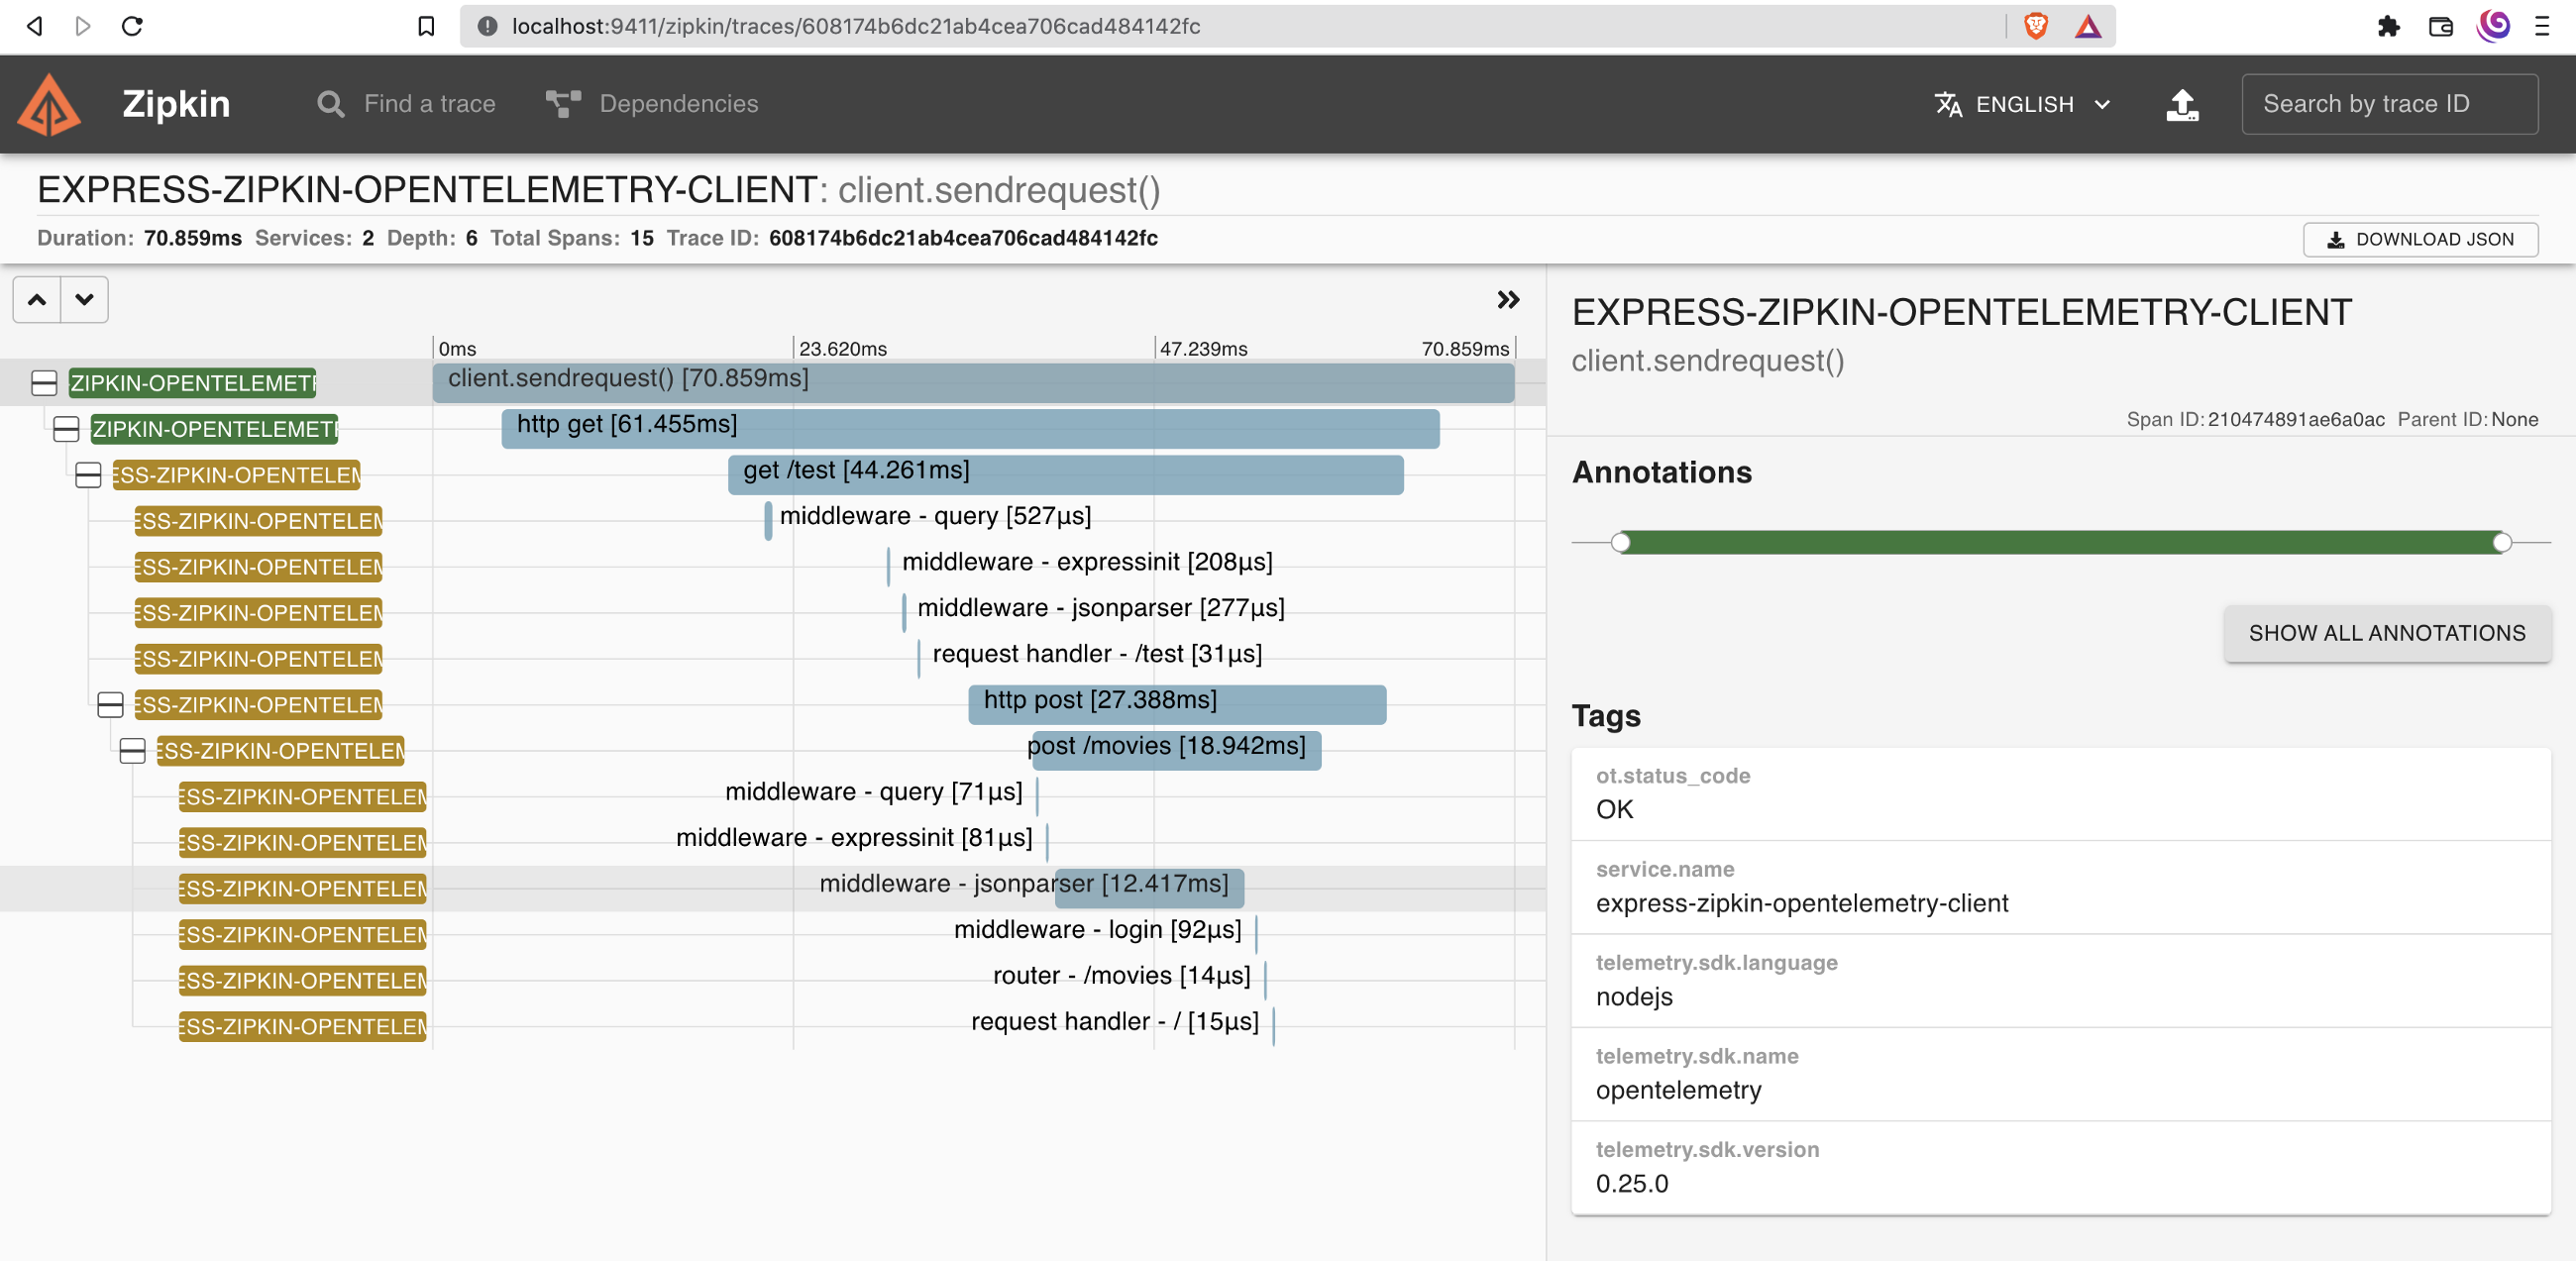
The sendRequest method will be called ten times at an interval of one second each. To see the data, log onto your Zipkin server and look into any of the traces.
When you look at one of the traces, notice how OpenTelemetry has automatically instrumented your data by creating several spans intelligently. Here’s an image of a sample trace from the demo app:
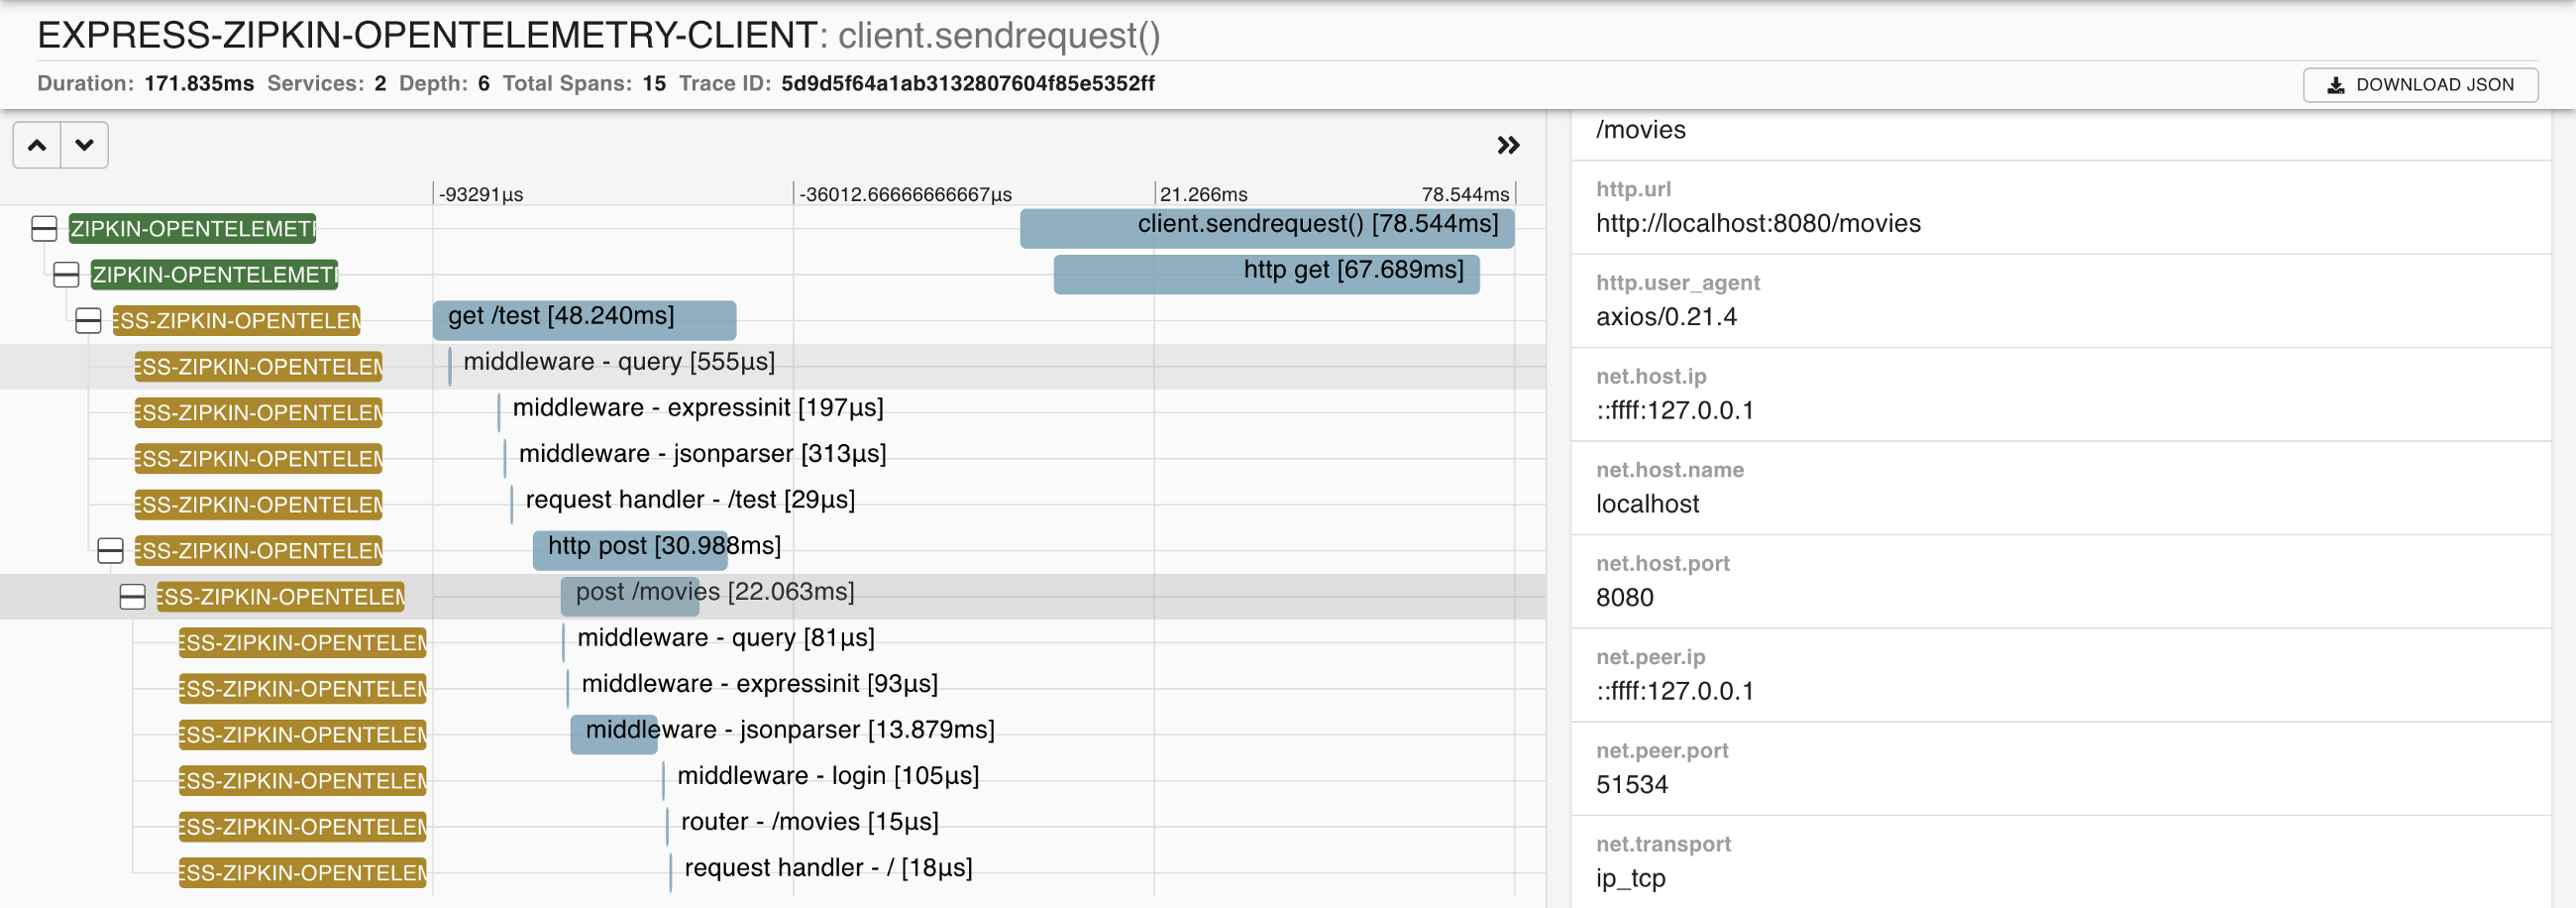
In the next image, look at the post /movies span along with all the details that have been captured for this stage of the request. If you were instrumenting your application using manual instrumentation, you’d have to define the spans yourself. Here, you just have to provide the name of the service.
Visualization is just one part of the offering here. You can also aggregate the trace metrics and extract insights such as what percentile of requests are being served within 100 ms. Wherever there’s a skew, you can drill down and investigate particular requests and figure out what component of the app is taking time.
Properly presented telemetry data gives you a complete view of what’s happening with your application, so you’ll be able to detect, verify, and debug issues quickly and effectively.
Final thoughts
Instrumentation sits at the core of the observability of your application. Having a well-observed application gives you great insights that enable you to improve performance, remove bottlenecks, and fix issues. This article showed you how to add automatic instrumentation to an Express.js app using the OpenTelemetry API and SDK without any hassle.
If you’ve built your app in another framework, head over to the official documentation for guidance.
The end goal of setting up instrumentation is to solve the observability problem.
If you're looking to improve how you monitor your applications and make fixing errors easier, try using Airplane. Airplane is the developer platform for building custom internal tools. You can transform scripts, queries, APIs, and more into powerful workflows and UIs that anyone on your team can use. With Airplane Views, you can build React-based dashboards that help you monitor and troubleshoot your applications in real time.
To build your first View, sign up for a free account or book a demo.


